Pipeline Earnings Confirm Positive Trends

Energy remains probably the least loved of the S&P500’s 11 sectors. Over-investing in new projects has turned off many investors, who would like to see more cash returned via buybacks and dividends. And the Democratic primary debates remind that an anti-fossil fuel stance is needed to excite the party’s hard core, introducing some electoral uncertainty to the outlook.

The good news is that cash flows are growing, as pipeline companies are responding positively to investor feedback (see The Coming Pipeline Cash Gusher). And the aspirational goals of some Democrats to phase out oil and gas will collide with technical realities and popular reluctance to return to 18th century living standards.

Earnings season is generally confirming the positive free cash flow story we’ve articulated for midstream energy infrastructure (see The Coming Pipeline Cash Gusher). Enterprise Products Partners (EPD) continues to execute well, beating EBITDA expectations by around 10% with 18% year-on-year growth. Williams Companies (WMB) modestly exceeded expectations and provided good guidance, boosting the stock. This highlights that weak natural gas prices, which had kept the stock under pressure for a couple of weeks, have little impact on operating performance.

TC Energy (TRP, formerly known as Transcanada) reported another solid quarter. And Oneok (OKE) reported Distributable Cash Flow (DCF, the cash generated from existing assets after maintenance expense), of $541MM, $100MM ahead of expectations. Only Western Gas (WES) bucked the trend, with poorly-timed lower guidance just when Occidental (OXY) is considering selling their position following the acquisition of Anadarko (ADC).

Midstream energy infrastructure has undergone a transformation in recent years. Predictable and rising distributions were abandoned when the Shale Revolution required new pipelines. Income seeking investors felt betrayed, and many big MLPs converted to corporations so as to access a far broader set of investors (see It’s the Distributions, Stupid). Today, MLP-dedicated investors are missing two thirds of the sector including most of the big companies.

The ten biggest companies comprise the bulk of the industry. Dividends average 6.4%, comfortably covered by 10.8% DCF, which is growing at 9%. Leverage is down, at 4.1X Debt:EBITDA, and all are investment grade. Yields on their bonds are typically less than half their dividend yields, revealing that banks and rating agencies, with their access to proprietary information are far more optimistic than equity investors.

The positives include:

  • Capex on new projects, which continues to fall from last year’s peak
  • Improved governance for those MLPs that have converted to a corporate structure. This makes them more attractive to institutional buyers.
  • Stronger balance sheets, especially compared to more levered sectors such as REITs and utilities where over 5X Debt:EBITDA is common
  • Low borrowing costs
  • Interest from private equity, whose managers see better value in public markets. IFM’s acquisition of Buckeye Partners for a 27.5% premium earlier this year was an example
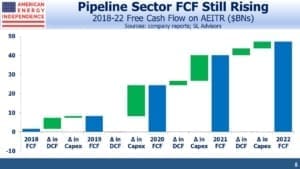
  • Free Cash Flow growth which is on course to leap from $1BN last year to $45BN by 2021, based on our analysis of the companies in the broadly-based American Energy Independence Index.

2Q19 earnings reports are so far confirming all the positives noted above. Midstream is out of favor, cheap and poised to rise.

We are invested in EPD, OKE, TRP, and WMB

SL Advisors is the sub-advisor to the Catalyst MLP & Infrastructure Fund. To learn more about the Fund, please click here.

SL Advisors is also the advisor to an ETF (USAIETF.com).

Natural Gas: The Big Energy Story

The world’s energy sector is undergoing a transformation. Widespread press coverage of the growth in renewables reflects increasing concern about climate change. Nextera Energy, the world’s biggest producer of wind and energy power, epitomizes the excitement about clean energy (see Is Nextera Running in Place?). A recent investor day highlighted falling costs and growing demand in the move away from fossil fuels.

Opposition to new natural gas pipelines has led Con Ed in Westchester County to place a moratorium on new gas hookups. Berkeley, CA has banned natural gas in new buildings. Investors wonder how long fossil fuel demand will last.

But the numbers reveal that natural gas is the real revolution, with renewables having far less impact than press coverage suggests.

Last year, natural gas provided 43% of the growth in global energy use, versus 18% for renewables. In the U.S. renewables increased their market share from 3.9% to 4.2%, but natural consumption jumped 7X as much in absolute terms, taking market share from 29.2% to 31%. Oil, coal, nuclear and hydro power all suffered modest declines.

The U.S. figures relate to domestic consumption, but Chinese imports of Liquified Natural Gas (LNG) will provide further demand. China consumes more than half the world’s coal. Beijing’s smog is well-known, and domestic pollution has led the government to set ambitious goals for increased natural gas use. Chinese citizens are dying earlier and suffering respiratory illnesses because of coal pollution. The 13th Five Year Plan calls for natural gas to be 10% of China’s primary energy use by next year, and 15% by 2030. Last year natural gas was 7.5%. Although China can claim they are lowering their greenhouse gas emissions, they’re fighting domestic pollution not global climate change.

Since China’s energy use is growing, achieving their 2030 goal of 15% natural gas will require much more than simply doubling their existing consumption. Chinese energy demand is growing at 4.3% annually. At that rate, they’ll need 65% more energy than at present. Natural gas use will have to more than triple to reach their 15% goal by 2030.

China will need an additional 61 Billion Cubic feet per Day (BCF/D), approximately three quarters of current U.S. consumption. This is approximately the amount of new gas supply unleashed by the U.S. Shale Revolution. China’s current coal use is equivalent to around 200 BCF/D. There is enormous potential to substitute natural gas.


Russian gas from Eastern Siberia will be an important source of new supply, but China is also short of storage capacity. As in the U.S., demand peaks seasonally in summer and winter, but unlike the U.S. China has limited ability to build up reserves in the shoulder seasons. It’s also expected that the new Russian gas supply will have fairly inflexible volumes and won’t be able to vary production seasonally. These two factors are behind the expected jump in Chinese LNG imports over the next decade shown in the chart.

Even if Chinese LNG imports quadruple as in one forecast, China will fall far short of its goal to get just 15% of its energy from natural gas. If the Chinese are serious about combating pollution, they’ll want every feasible LNG export facility built.


If President Trump ran an energy company, he’d blame the liberal media for reporting fake news about the growing dominance of renewables. Solar and wind are an interesting story, and there’s no shortage of reporters covering their growth. But the figures show that profound change in the world’s energy markets is being driven by natural gas. It doesn’t receive commensurate press coverage, but it’s the big story.

SL Advisors is the sub-advisor to the Catalyst MLP & Infrastructure Fund. To learn more about the Fund, please click here.

SL Advisors is also the advisor to an ETF (USAIETF.com).

Is NextEra Running in Place?

Investing in midstream energy infrastructure today means pipelines, storage, gathering and processing and all the physical networks that sit between oil and gas wells and their customers. It doesn’t have to be limited to servicing non-coal fossil fuels. We research and think about other sources of energy including nuclear, renewables and coal.  We prefer the more visible cashflows that come with handling and transporting energy over the cyclicality and capital intensity of production and generation. It’s why we have avoided upstream oil and gas, coal mining, and power generation companies.

Mining and burning coal releases many pollutants including nitrous oxide, sulfur dioxide, particulate matter and other pollutants. It is in long-term decline in North America.  Furthermore, transportation is by rail and ship, which have lower barriers to entry than pipelines.

Public opposition to nuclear has added uncertainty and harmed economics, which makes investing unattractive.

However, renewables offer the opportunity for both long haul transmission lines and large scale storage. These are two areas with the potential for visible, persistent cashflows, although today there are few opportunities for scale and pure plays. Renewable generation is largely owned by utilities within portfolios that include coal, natural gas, and nuclear assets.

NextEra Energy Projected Capital Expenditures

An exception is NextEra Energy (NEE), the world’s biggest producer of wind and solar energy. They’re the largest component of the SPDR Utilities ETF (XLU). On a list of countries ranked by wind power generation, they would be 8th. Just as the Shale Revolution has created ample opportunities to invest capital for growth, so has the burgeoning renewables business in the U.S., albeit with a wholly different response from investors.

Although energy investors have revolted against endless investments in more production and additional pipelines, NEE investors cheer the company’s stepped up commitment to renewables. Over the past year, their stock has returned 24%,  8% ahead of the S&P500 and 16% ahead of XLU. From 2015-18 NEE’s capex rose from $3.9BN to $6BN, a pace they expect to maintain over the next four years. They’re planning the world’s biggest battery center by a factor of 4X, in central Florida, to store intermittent renewable energy for later use when it’s not sunny or windy.

Strong Growth Projected in Renewables

Much of this investment will be in new wind and solar generation, a sector NEE expects to enjoy 15% annual growth through 2030. This growth will be driven by declining prices for produced power. NEE expects improving technology to bring the cost per Megawatt Hour for wind and solar below all other sources.

CEO Jim Robo recently led an investor day during which his team enthused about the being a low-cost renewables company delivering the benefits of clean energy to customers and investors.

Renewables Power Prices to Fall

But here’s the catch. The company is plowing capital into assets that will depreciate, because continued efficiencies will lower the price of produced power. It’s analogous to holding a huge inventory of microchips when Moore’s Law dictates that the cost of computing power falls by 50% every 18 months; or of stocking millions of iphones, when the next version will drive down the price of the old ones.

Rapid advances in technology cause deflation in assets. While Intel and Apple have shown that it’s highly profitable to manufacture products with continuous improvement, NEE is on the other side of this trade.

It means that every windmill they install and every battery facility they build is worth less than it cost from the moment it begins operation. The falling cost of renewable energy, which is driving their pursuit of growth, threatens to erode the pricing power of the assets they’re developing.

Correctly assessing the cash flow generating capability of a new solar facility must be hard. NEE can depreciate their property, plant and equipment (PP&E) based on the physical useful life of what they’ve bought, but the impact on cashflows from future pricing pressure is less clear. As their installed asset base ages, they’ll become less competitive, unless they constantly reinvest to upgrade their depreciating equipment. They face a constant uphill struggle to maintain competitive, cost-effective assets.  Eventually, they’ll reach a cash flow cliff as their contracts roll off.

In 2018, NEE’s depreciation of its renewables-heavy PP&E jumped, and is now higher than peers Duke Energy (DUK) and Dominion Energy (D), the 2nd and 3rd largest components of XLU respectively. At $3.9BN, it was two thirds of their growth capex. In other words, two thirds of their capex is spent to preserve the value of their PP&E. Assuming straight line depreciation, NEE expects its existing asset base to have a useful life of just over 18 years, which contrasts with the 35X earnings multiple assigned its stock by the market. Free Cash Flow has been declining as a percentage of net income, and will shift negative this year.

NEE is a company that’s investing heavily in the future, but will always be racing against advances in renewable technology. A purchase delayed will provide cheaper power, later. Advances in renewables may one day cause an impairment charge on old assets struggling to compete. A 10% write-down in PP&E would wipe out a year’s profits.

The irony is that pipelines regularly raise prices, and the sector has been punished by investors for spending on new infrastructure to transport growing oil and gas output. Disruptive pipeline startups are rare, because expanding an existing pipeline brings network effects and is cheaper than building new. Moreover, FERC’s regulatory framework  recognizes the oligopolistic role pipelines play and is designed to limit egregious pricing.

By contrast, NEE is being rewarded for investing heavily in assets whose pricing power diminishes. It’s true their customers are locked in via long term power purchase agreements. One of these is being challenged by bankrupt PG&E in California, although NEE is confident it will be upheld. But they still face the risk of lower-priced competition in the future, and no-one knows if regulators will allow them to charge customers rates above what new power assets would dictate indefinitely. Their potential competitors include new entrants unburdened by legacy, inefficient infrastructure. Even their customers can turn into energy providers by adding rooftop solar panels. The technology around renewables and battery storage continues to improve, creating the possibility of further disruption by new entrants.

We don’t own NEE. By all accounts they are a well-run company. Their progress will provide a useful guide to the growth of renewables in the U.S. and their ultimate profitability.

SL Advisors is the sub-advisor to the Catalyst MLP & Infrastructure Fund.  To learn more about the Fund,  please click here.

SL Advisors is also the advisor to an ETF (USAIETF.com).

Reviewing Russell Gold’s The Boom

Although Russell Gold’s The Boom: How Fracking Ignited the American Energy Revolution and Changed the World is now almost five years old, it still provides a relevant commentary on America’s Shale Revolution. Unlike many other chroniclers of America’s energy renaissance, Gold managed to obtain an invitation to see first-hand how drillers unlock hydrocarbons from shale. We already know it’s a noisy, dirty process that’s highly disruptive to the local community. But we also learn about the intersection of science with the brute force required to fracture the rock holding the commodity. Huge trucks carrying water and pump trucks converge on the drilling site. Inside the trailer where technicians control the process, “The computers, the headphones, and the focused faces make the van feel a bit like a NASA command center.” But they’re still oil sector workers, so better resemble a NASCAR pit crew working at NASA.

The Boom By Russell Gold

Gold highlights Shale’s huge benefits to the U.S. Oil companies have known for decades that impenetrable source rock held enormous reserves. Early efforts at fracturing it used high explosives, and in the 1960s there was serious discussion about using nuclear bombs. Between 1969 and 1973 several nuclear devices bigger than the one dropped on Hiroshima were detonated underground to release natural gas. Subsequent production wasn’t impressive, and poor economics as well as environmental concerns soon ended such efforts.

The author balances the positives with concerns about drilling’s local environmental impact, as well as the continued use of fossil fuels. He concludes that increasing natural gas use is the preferred outcome because it displaces far dirtier coal plants for electricity generation. In time, like many observers, he expects renewables to dominate, but that’s still likely decades away. Battery storage continues to be a significant hurdle to relying on intermittent sources of energy such as solar and wind. Bill Gates noted this in a recent blog, writing that, “…solar and wind are intermittent sources of energy, and we are unlikely to have super-cheap batteries anytime soon that would allow us to store sufficient energy for when the sun isn’t shining or the wind isn’t blowing.”

It turns out oil is a fantastically efficient form of energy storage. A memorable illustration comes from a speech by Steven Chu, former U.S. Energy Secretary under Obama. In comparing different materials for their energy density per unit of weight, or volume, he noted that, “The most efficient energy sources were diesel, gasoline and human body fat” (italics added). Apparently, an ample girth has energy storage capabilities to which battery developers aspire in their labs. Chu added that a battery holding a comparable amount of energy would require eighty times more space and weight. This was back in 2010, but today’s best batteries still don’t come close.

Gold identifies privately owned mineral rights as a crucial difference between America and the rest of the world. Although English Common Law underpins the U.S. legal system, sovereign ownership of what’s underground is one attribute that happily didn’t cross the Atlantic. The sharing of wealth with the community where drilling takes place is an important pillar of support. In 2014 when The Boom was published, fifteen million Americans lived within a mile of a well that had been fracked within the past few years. Today’s it’s certainly more. Although proximity produces supporters and opponents, generally fracking happens where it’s welcome, which is as it should be. Since Gold’s initial interest in the subject was due to Chesapeake buying drilling rights on his family’s farm, his perspective is well informed.

The rise and fall of Aubrey McLendon, late founder of Chesapeake, take up two chapters. McLendon was a colorful character who thought big and took the industry to higher gas production than would have happened without him. The Boom was published before McLendon’s fiery death in an automobile accident. It looked like suicide, occurring in March 2016 when the energy collapse was straining his high risk business strategy, but was later ruled accidental.

It’s also interesting to learn about the career of George Mitchell, often called the father of fracking. Mitchell’s persistence with unlocking shale reserves where others had given up is now industry legend.

The Boom deserves a place on the bookshelf of anybody interested in learning more about the Shale Revolution.

Join us on Thursday, July 11th at 1pm EST for a webinar. We’ll discuss the pipeline sector’s growing Free Cash Flow. To register, please click here.

SL Advisors is the sub-advisor to the Catalyst MLP & Infrastructure Fund.  To learn more about the Fund,  please click here.

SL Advisors is also the advisor to an ETF (USAIETF.com).

Texas Reconsiders Flaring

Nothing exemplifies America’s low natural gas prices more than its flaring where takeaway infrastructure is inadequate. In the Permian basin in West Texas and New Mexico, from where most of the growth in crude production originates, associated natural gas is more often a disposal problem, like wastewater. Oil production has grown faster than expected, leaving gathering and processing systems struggling to keep up. Natural gas is hard to handle. Transportation by truck isn’t common because it has to be compressed, requiring specialized equipment. Mexican utility demand has grown more slowly than planned, and absent pipelines for transportation elsewhere in the U.S., the only remaining option is flaring.

natural-gas-flaring

A few years ago North Dakota faced a similar problem. Nighttime satellite photos revealed what looked like a new, brightly lit city in an uninhabited part of the country. Although regulators typically allow flaring for limited periods of six months or so, volumes of wasted gas continue to grow. By one estimate, the natural gas currently being flared in the Permian could power every home in Texas. The Texas Railroad Commission (RRC) regulates flaring permits. Oil drillers routinely request and receive permission for flaring where they can argue that oil can be profitably produced but there’s no take-away infrastructure for natural gas.

In theory, flaring requests can be challenged although they never are. Last week the RRC heard an application which raised an interesting question whose resolution could have a profound impact on such permits in the future. Exco Operating Company, LP sought a flaring permit on the basis of unavailable pipeline infrastructure. Unusually, it was protested by Williams Companies (WMB) who owns a nearby gathering and processing network. You can watch a video recording of the hearing here. Go to Item 9.

It turned out that a gathering pipeline was available to transport the associated natural gas, but Exco felt the economic terms were unfair. As the owner of the only available pipeline, Exco argued that WMB could charge an unfairly high price. Natural gas pricing at the Waha hub in Midland, TX has often been negative this year, meaning gas producers have to pay to offload their output. So it’s likely Exco was balking at pricing that reflected the paucity of options.

This led to an interesting dialogue between the RRC commissioners and representatives of Exco and WMB. The RRC has traditionally been charged with minimizing the waste of oil and gas. Natural gas flaring has been allowed because it’s necessary to access the crude oil. But Exco’s argument was one of economics. Implicit in their flaring request was that disposing of the natural gas would cost them more than its value.

As one commissioner noted, if flaring permits were based on economic hardship, there would be no need to have an approval process because companies would simply flare when that provided a better return than accessing a pipeline. And yet, the RRC is charged with regulating flaring, which means there must be some other, non-financial framework they’re intended to follow.

It was fascinating to watch both lawyers and the commissioners spar over this issue. WMB noted that the pipeline had been built at a cost of $1.5BN in order to gather gas from wells such as Exco’s, and said that Exco could have built their own takeaway pipeline early in the process but chose not to.

The RRC recognized the fundamental question raised by WMB’s challenge to Exco flaring application. It seems that however it’s resolved, it will set a precedent for future applications. Exco’s view would negate the need for the RRC to regulate flaring, since the decision would be a financial one for the company. WMB’s view would require drillers to access a gathering system where available even if pricing was unattractive.

The RRC decided to pass on the case at its first hearing, leaving it currently unresolved. When they meet to reconsider, the result could be far-reaching. If the RRC requires drillers to use available gathering and processing networks regardless of economics, as WMB wants, that would be good for pipeline investors.

Join us on Thursday, July 11th at 1pm EST for a webinar. We’ll discuss the pipeline sector’s growing Free Cash Flow. To register, please click here.

We are invested in WMB.

SL Advisors is the sub-advisor to the Catalyst MLP & Infrastructure Fund.  To learn more about the Fund,  please click here.

SL Advisors is also the advisor to an ETF (USAIETF.com).

Partnering with Pipeline Protesters

Suppose that the owner of a pipeline operating at 100% capacity opposed the construction by a competitor seeking to meet unsatisfied demand. Or consider two operators of competing pipelines that agree to refrain from adding needed capacity. Such behavior would be anti-competitive, hurting consumers but good for the pipeline operators and their owners. Scarcity of pipeline capacity would allow higher tariffs and curtailed investment in new projects. Investors would cheer.

Pipeline Protesters Unite

In many ways, the efforts of environmental extremists to oppose new pipeline construction has the same effect as if the pipeline operators themselves declined to invest in meeting new demand. Con Edison has placed a moratorium on new gas hookups across most of Westchester County, because of the inability to bring more gas into New York State.

Over the last decade, New York’s residential gas consumption has jumped by 20%, and electricity generation has become increasingly dependent on gas-fired generators. When the state retires its two Indian Point nuclear reactors in 2020 and 2021, it will need to find a replacement for 25% of the power for New York City and Westchester county. Anti-nuclear groups call for renewables to replace the lost power, but that may be difficult as non-hydroelectric renewables account for just 6% of the current mix.  Natural gas provides the largest share at 35%.

Category New York Net Electricity Generation thousand MWh % of Electric Mix
Natural Gas-Fired 3,343 35%
Nuclear 2,796 29%
Hydroelectric 2,710 28%
Nonhydroelectric Renewables 608 6%
Coal-Fired 66 1%
Petroleum-Fired 12 0%

Opponents of new pipelines want to impede consumption of natural gas in their quixotic effort to combat climate change. Although they would appear to share little common ground with pipeline investors, their success reduces the backlog of new projects, thereby lowering the sector’s capex. Perversely, pipeline investors complaining about poor capital discipline are being helped by environmental activists.

Natural gas demand is growing across the U.S., and globally. U.S. crude oil is gaining market share and meeting most of the growth in demand, which is largely from developing countries. The midstream energy infrastructure sector continues to plan new projects to transport America’s growing output. Although growth capex probably peaked last year, substantial investments are planned this year. Williams Companies (WMB) estimates $2.4BN in spending on new projects, including their proposed natural gas pipeline across New York harbor that was recently rejected.

Growth capex is the chief headwind to generating higher Free Cash Flow (FCF), a metric broadly familiar to generalist equity investors and likely to draw non-traditional buyers once FCF yields exceed the S&P500.

Moreover, recognizing the strength of opposition to new construction allows pipeline operators to enjoy stronger pricing supported by relative scarcity. They have a convenient excuse for their customers and regulators to justify profitable bottlenecks and constrained capacity. If the industry sought to create such conditions itself, an anti-trust investigation would surely follow. In fact, environmental opposition is providing the political cover to seek oligopolistic profits.

Building new infrastructure is in the DNA of every midstream management company. Their dislike of the Sierra Club is visceral. Investors have reflexively joined the criticism of those who would impede customers’ access to more oil and gas.

But on reflection, while we disagree with the virtue-signaling that governs much of the anti-carbon movement, we’ve concluded that, as investors in midstream energy infrastructure wanting higher FCF, our interests are more aligned than with company managements.

We want fewer new pipelines too. MLP investors might consider joining the next protest. The outcome could be better than you think.

Gas Pipelines having Problems Gets Built? Owner Description
Atlantic Coast Coin flip Dominion, Duke, Piedmont, Southern WV  to VA & NC
Constitution Long shot Williams, Cabot, Piedmont, WGL PA to NY
Mountain Valley Perhaps EQM, NextEra, Con Edison,  WGL, RGC WV to Southern VA
Northeast Supply Enhancement Doubtful Williams PA to NYC

We are invested in WMB.

SL Advisors is the sub-advisor to the Catalyst MLP & Infrastructure Fund.  To learn more about the Fund,  please click here.

SL Advisors is also the advisor to an ETF (USAIETF.com).


Pipelines Get Adult Supervision…Private Equity

Last week’s blog (see Plain Talk, Fuzzy Math) showed how Plains All American (PAA) miscalculates its cost of equity capital. Equity is the key component in a company’s Weighted Average Cost of Capital (WACC). In the presentation from their investor day, it was too low. We received several comments from readers and investors on the topic. The energy industry has been plagued with executives who value growth in assets over achieving an appropriate Return On Invested Capital (ROIC). Profits come from ensuring that a company’s assets earn a return higher than the cost of financing them, or that ROIC > WACC.

Return of Capital v Cost of Capital for pipeline companies

In one meeting with PAA, we asked if they’d considered selling themselves, since there’s a case that the company’s worth more in another’s hands. “Not yet ready to retire” was the answer. Financial discipline comes in many forms.

In too many cases, a CEO’s pay is directly linked to a company’s size. Per share operating metrics and capital efficiency ought to dominate. Management teams often strive for growth, which can conflict with an owner’s desire to earn a good return. Identifying companies where interests are more clearly aligned with investors is worthwhile.

Calculating ROIC for energy infrastructure businesses is tricky. Projects are funded over several years, and project-based returns are generally not disclosed. Therefore, some judgment is required. Wells Fargo made a serious attempt at calculating company-specific ROIC figures last year. A couple of companies (Enterprise Products and Plains) preferred their own methodology over that used by Wells Fargo, and their objections were duly noted in the research report. We explained in last week’s blog why we disagreed with PAA’s approach.

Pipeline Companies Five Year Return on Capital

One solution to poor capital allocation decisions is to favor public companies with a significant private equity investor. At first this might seem odd. Private Equity (PE) has delivered mediocre results for investors (see a recent WSJ article, Private-Equity Firms Are Raising Bigger and Bigger Funds. They Often Don’t Deliver). The problem for PE investors is the ubiquitous “2 and 20” fee structure, which is a big drag on returns and has created some fabulous fortunes. However, most PE managers are financially more astute than the typical pipeline company finance department. The best apply rigorous financial analysis, and investing alongside them can be an attractive proposition.

Pipeline companies with a large private investor

Having a PE partner doesn’t guarantee good judgment, but it does assure that when such decisions are being made, there will be a voice demanding a profitable spread between ROIC versus WACC. Private equity is all about capital efficiency and achieving an attractive IRR. Many energy companies could benefit from greater financial discipline. A few already have such a partner, reflecting the more optimistic outlook PE investors have of the sector compared with public market valuations.

Blackstone and its affiliates own 44% of Tallgrass Energy (TGE). Investors in TGE are in effect co-investing alongside Blackstone, without having to pay Blackstone a fee. It’s appealing to all TGE holders to know that capital allocation decisions require Blackstone’s support.

Crestwood (CEQP) is a similar situation, with their private equity partner First Reserve, who own 25% of CEQP and has also invested in JVs with CEQP on mutually beneficial terms.

Activists can also play a constructive role. In 2016 Carl Icahn pushed Cheniere’s (LNG) CEO Charif Souki out of the company. That’s one solution to the principal-agent problem. Souki is a colorful character (see Coals to Newcastle), but Icahn disagreed with LNG’s investments in oil companies, which were not linked to their core business of exporting liquefied natural gas. In an interview with CNBC, Icahn explained why, and also vented his frustration with Souki’s compensation. The subsequent improved capital allocation and focus on executing their core business plan has seen LNG stock rise from $39 at the time of Icahn’s intervention to $66 today, without paying a dividend.

Enterprise Products Partners (EPD) has a well-regarded reputation for prudent management. Growth projects are funded internally. The Duncan family owns a third of the company and controls EPD, helping align shareholder interests with managements.

Global Infrastructure Partners recently invested in Enlink Midstream (ENLC), and currently owns 41%. Texas Pacific Group and Goldman together own 12% in preferred securities which are convertible into common equity. It’s too early to judge the impact of their ownership, but encouragingly ENLC’s CEO Mike Garberding was previously the CFO. We think it’s highly likely that capital discipline will become apparent at ENLC.

Significant equity ownership by management doesn’t always lead to good decisions. Rich Kinder continued to add to his already significant holding in Kinder Morgan (KMI), even as it lost two thirds of its value from 2015-16. KMI investors could have benefitted from an influential outsider. Energy Transfer (ET) is also heavily owned by management, but trades at a steep valuation discount because CEO Kelcy Warren has shown a willingness to exploit his investors if he can (see Will Energy Transfer Act with Integrity?).

Prior to their simplification, the significant insider ownership at Plains may have led the GP to place too much leverage at the MLP level, leading to unsustainable dividends at the MLP before consolidation. In some cases, management teams whose interests weren’t aligned with investors under the old GP-MLP model have not yet altered their behavior to acknowledge the alignment of interests that simplification brings.

The addition of PE investors makes creating value for all stockholders a higher priority.  This requires disciplined capital allocation.  While Rich Kinder, Kelcy Warren, and the insiders at Plains still own significant stakes, they are holdovers from a different model of wealth creation.  Under their old structure, the GP directed the MLP’s activities while receiving preferential economics through Incentive Distribution Rights (IDRs).  Growing the MLP increased IDRs even if it diluted returns for MLP investors.

Kinder’s simplification was almost five years ago, and yet their continued use of DCF and EBITDA in evaluating their Enhanced Oil Recovery (EOR) business betrays that they still haven’t updated their thinking. Depleting assets such as these reduce the return earned by equity holders, while the GP and his IDRs are largely immune. As a simplified, single entity KMI still hasn’t shown that it understands its long term ROIC for the EOR business.

Plains is using flawed math for capital allocation decisions.  And, Kelcy may be back on the hunt for acquisitions to continue building his pipeline empire at ET.

The energy sector has been roundly criticized for overinvesting. Investors who favor companies where the rigor of PE analysis is applied to future projects could find that better capital allocation decisions follow. In our portfolios, we are biased towards companies likely to choose their investments wisely.

We invest in CEQP, ENCL, EPD,  ET, LNG, KMI, TGE, PAA via Plains GP Holdings.

SL Advisors is the sub-advisor to the Catalyst MLP & Infrastructure Fund.  To learn more about the Fund,  please click here.

SL Advisors is also the advisor to an ETF (USAIETF.com).

Oil and Gas Growth Powered by U.S.

Last year the U.S. set a new world record for annual increase in production of oil and gas by any country in history. The recently-released BP Statistical Review of World Energy 2019 highlights these and many other useful facts.

U.S. Sets Record in Oil Production
U.S. sets World Record in Natural Gas Production

Total U.S. energy consumption rose by 3.5% last year, the fastest in 30 years and a surprising jump following a decade of no growth. Growth in population and GDP have normally been offset by lower energy intensity and improving efficiency. But periods of extreme weather (both excessive heat and cold) boosted energy demand, as well increased use of ethane for America’s resurgent petrochemicals industry.

US Annual Energy Consumption

The U.S. was one fifth of the 2018 increase in global energy consumption, with China and India together representing half. Climate change and CO2 emissions figured prominently in the report. Developed countries desire lower emissions and emerging countries higher living standards. China consumes 42% more energy than the U.S., a gap that will grow in the decades ahead. The resolution of these conflicting goals dominates the outcome.

Per Capita Oil Consumption US v China and India

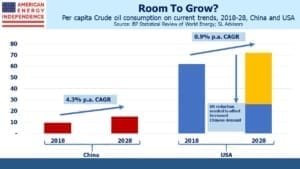
So it’s worth noting that the Asia-Pacific region energy consumption is more than double North America’s, and half of this comes from coal. The difference in coal volumes is by a factor of 8X. China alone consumes 6X as much coal as the U.S. But to illustrate unmet energy demand, China and India’s per capita consumption of crude oil is only 10% that of the U.S.

World Energy Consumption by Fuel

Until we confront these twin issues, little else that’s done to reduce emissions will have much impact.

Global carbon emissions grew by 600 million tons, or around 2%, the fastest for many years. This is the equivalent of increasing the global passenger car fleet by a third. Last week, India’s Adani Mining won Australian regulatory approval to begin developing one of the world’s largest untapped coalmines. Its critics contend that this project alone will eventually add 700 million tons of CO2 emissions, exceeding last year’s global increase from all sources. This is where India’s desire for more energy to raise living standards manifests itself. New York’s environmental extremists opposing a new natural gas pipeline might consider where the real problem lies.

Increased use of renewables alone will not solve the issues of climate change. BP notes that simply maintaining carbon emissions from the power sector at 2015 levels would have required growth in renewables generation at more than double the actual rate. The additional output is equal to all of the U.S. and China’s 2018 energy output from renewables.

US Natural Gas and Renewables Consumption

Natural gas provided 43% of the additional power the world consumed, more than twice that provided by renewables. For all the excitement about increasing use of solar and wind, their share rose by 1.4%. 84.7% of the world’s energy came from fossil fuels in 2018, versus 85.1% in 2017. As Bill Gates and others have pointed out, R&D should be directed towards making the 85% less carbon intensive, rather than trying to replace what obviously works.

Netpower is developing the ability to generate electricity from natural gas with no emissions, which would represent a significant breakthrough if successful.

It’s still possible to find writers warning of a production collapse because of shale’s chronic unprofitability.  An article on Seeking Alpha (see Here’s Why Oil Stocks Are Priced For Armageddon) or Bethany Mclean’s Saudi America: The Truth About Fracking and How It’s Changing the World both reflect a simplistic view. Exxon Mobil (XOM), now the biggest driller in the Permian, clearly finds it profitable. Anadarko had two suitors for its Permian assets. Volumes keep growing, in defiance of some writers’ claims to better understand the economics.

BP’s report showed that the 2.2 Million Barrels per Day (MMB/D) of increased global crude oil production came from the U.S., a point echoed in Plains All American’s (PAA) Investor Day.

The path to lower global emissions requires far more use of nuclear power, far less coal use in China and India, and more R&D into using existing energy sources more efficiently. Otherwise, investments in seawalls and flood mitigation will be a safer bet.

We are invested in PAA, via Plains GP Holdings.

SL Advisors is the sub-advisor to the Catalyst MLP & Infrastructure Fund.  To learn more about the Fund,  please click here.

SL Advisors is also the advisor to an ETF (USAIETF.com).

Plain Talk, Fuzzy Math

Plains All American (PAA) held their investor day last week. Continued growth in output from the Permian in West Texas is driving new pipeline construction, for which PAA is at the forefront. Limited pipeline capacity has hurt economics for some drillers that have resorted to trucks to move their crude, which is far more expensive.

PAA’s Supply and Logistics (S&L) business thrives on infrastructure constraints, since it allows them to exploit basis differentials using spare capacity on their pipeline network. From 2014-17 S&L EBITDA collapsed by 90%, as spare capacity came online. It has since rebounded to $450MM, around two thirds of its 2014 peak.

One analyst asked about the impact of new pipelines, both on the S&L business (where PAA expects to see EBITDA drop 50% next year) as well as on existing pipelines which face possible cannibalization of demand:

“You’re creating your own weather when you think of the S&L impact…there’s a lot of moving parts here…Loss of marketing, loss of basin flows, loss of potentially some spot barrels on Bridgetex”

Executives wouldn’t be drawn into discussing the impact in more detail, which was a pity because an investor day is supposed to offer an opportunity to dig more deeply into a company’s business. The response was:

“The guidance for this year fully reflects our views of how that impact is…we’ll give guidance later in the year for 2020… I don’t think we’re going to specifically work towards guidance during this meeting today, that’s not the intent.”

This interaction captures the conundrum facing investors. The Shale Revolution’s dramatic increase in oil and gas production isn’t yet profiting midstream infrastructure investors. One reason is fear that the industry will overbuild, pressuring pipeline tariffs and leading to projects that fail to cover their cost of capital.

PAA laudably tried to demonstrate financial discipline with two slides illustrating how they think about their cost of capital versus their return on invested capital. For any company, the spread between these two is the main source of profits.

Cost of Capital PAA

So it was disappointing to see errors and omissions. Distributable Cash Flow (DCF) as a cost of equity was based simply on the current DCF yield without adding anticipated long term growth, though investors are told to expect such growth of 10% this year and presumably further growth beyond.

Return on Invested Capital PAA

The problem in using current EBITDA as the basis for assessing projects is that it doesn’t reflect the long term return on assets with years of useful life and fluctuating tariffs. It omits corporate overhead, maintenance, cost for potential delays and cost overruns. Most investors calculate the net present value of cashflows from a proposed investment, discounted using a rate appropriate to the risk.

How PAA Should Calculate its Cost of Capital

PAA isn’t calculating their cost of equity properly. More correct would be to use the dividend yield plus long term expected growth rate. The growth rate is derived from the portion of retained earnings not paid out (i.e.  1 minus the payout ratio) times the return on equity, which PAA shows has historically been 19.5%.

Although they’re targeting 130-150% coverage of their distribution, it’s currently 2X. Raising the dividend such that it was 150% covered would give them a yield of 8.5% (versus 6.37% currently). 150% coverage  equals a 67% payout ratio. 1 minus the payout ratio, or 33%, times their 19.5% ROE, implies a 6.5% growth rate, which should be added to the projected 8.5% dividend yield.

So PAA’s own figures and assumptions suggest their cost of equity is really around 15%, not the 12.1% they presented. PAA’s Weighted Average Cost of Capital (WACC), using their desired 55/45 equity/debt split and with a 4.25% interest rate on their debt, is almost 10.2%, 1.6% higher than they presented.

Since they seek an investment return of 3-5% above their WACC, any project needs a return of 13-15%. Riskier projects need an even higher return than this. The Alpha Crude Connector acquisition failed to meet this hurdle.

This minimum return on new projects is further illustrated through their desired leverage of 3-3.5X Debt:EBITDA. Assuming they continue to finance their investments with 45% debt, anything new must have an EBITDA multiple (i.e. cost of investment divided by EBITDA) of no higher than 7X. 3.25 leverage (the midpoint of their 3-3.5 range) divided by 45% debt share of finance is 7.2, which equates to around 14% (1 divided by 7.2), the midpoint of the required return we calculated based on their WACC.

The 55/45 ratio between equity and debt could be unsustainable if EBITDA falls. For example, a manageable 4X Debt:EBITDA leverage ratio would become an unsustainable 8X if EBITDA later dropped by half. Building in the possibility of lower tariffs in the future means debt should be less than 45% of the capital, which raises the WACC since equity is more expensive.

It’s also why you want to own strategic assets that don’t face huge drop-offs in revenues after initial contracts expire.

The flaw in PAA’s math can be illustrated by showing that they’d be willing to raise capital at today’s cost to buy an identical enterprise to their own, with identical EBITDA. Using their own cost of capital and 2019 EBITDA, they’d value this twin at over $33BN. Adjusting for debt, the twin’s equity would be worth $24BN, compared with PAA’s current market cap of only $17BN. Their math allows that PAA could pay up to a 39% premium to buy a business identical to what they own before the acquisition would no longer be accretive.

This is why investors are usually unenthusiastic when management teams announce another growth project. PAA, like most of its peers, should be more willing to repurchase shares.

The stock’s poor performance over the past five years is due to poor capital allocation decisions, probably driven by faulty logic such as described here.

No sell-side analyst pointed this out, but the shareholders who have lived it understand the flaws in PAA’ internal investment process.

Meanwhile, PAA is a cheap stock, trading at just 8X cash flows that are growing, assuming management is more prudent with investors’ money than over the past five years. The industry’s fortunes will turn on correctly calculating the spread between cost of, versus the return on, invested capital.

We are invested in PAA, via Plains GP Holdings.

SL Advisors is the sub-advisor to the Catalyst MLP & Infrastructure Fund.  To learn more about the Fund,  please click here.

SL Advisors is also the advisor to an ETF (USAIETF.com).

Miscounting America’s Crude

Wednesday’s report on crude oil stocks from the Energy Information Administration (EIA) showed a sharp jump in storage of 1 million barrels per day (MMB/D). Given the already fragile mood around tariffs slowing GDP growth, crude oil prices predictably slumped.

Interestingly though, over the past year the “Adjustment”, or fudge factor which is used to make the numbers add up, has grown substantially.

In simple terms, the EIA counts production, exports, imports, change in storage and refinery usage. This should pick up every barrel of oil moving through the U.S. It must frustrate the EIA’s number crunchers that the figures never foot, so they use a balancing item which used to be called “Unaccounted for Crude Oil”, nowadays simply the Adjustment. Since June 2018, the Adjustment has almost tripled.

Over the past year, crude oil used by U.S. refineries has been stable. Because much of America’s increased production is light crude from the Permian ill-suited to domestic refineries, imports have also remained unchanged. Higher exports have absorbed most of the increase in output.

The Adjustment exists solely because one of the other figures is wrong. So we’re refining more, exporting more, importing less, storing less or producing more than reported. Of these five different items, some should be easier to measure than others. The refinery figure seems unlikely to be far wrong; refineries must know what they’re using and there are 135 refineries in the U.S. from which to gather information.

Similarly, imports must surely be correct since the government licenses imports, and counting exports would also seem reasonably straightforward – the number of points of exports (cross-border pipelines and crude-loading export facilities) are known and not that numerous.

However, in reviewing the EIA’s methodology for calculating exports, they rely heavily on data from the U.S. Customs Border Protection (CBP) as well as figures from Statistics Canada (since exports to Canada don’t require a U.S. export license). The EIA runs the data through estimation models that they believe improve its accuracy. In some cases they’re using monthly data, even though their report is weekly.

There are many types of petroleum product beyond crude oil, including finished motor gasoline, kerosene, distillate and residual fuel oil among others. And the granting of an export license need not coincide with the physical shipment of the product. So it’s a more complex task than you might suppose.

Storage would also seem straightforward. Storage terminals are hard to miss. So the 967 thousand barrels per day (MB/D) build in storage ought to be reliable. Since the prior week saw a 41 MB/D decrease in storage, crude traders inferred softening demand.

But storage has its own complexity, since crude oil sitting on a tanker awaiting unloading is, in effect, floating storage. A possibility suggested by one sell-side firm is that floating storage was drawn down sharply. This presumes that several million barrels of crude was in tankers bobbing within U.S. territorial waters, already counted as imported but not yet unloaded. If true, this would mean the apparent jump in onshore storage was offset by a drawdown in floating storage, making the report far less bearish.

While this could explain the sudden, one-time shift in the storage figure, the Adjustment was the same last week, which undercuts the logic behind this explanation.

This brings us back to production, currently estimated at 12.4 MMB/D. Of the line items in the EIA’s report, it seems to us that this one is most plausibly the source of the growing Adjustment. There are around a million wells in the U.S. producing crude oil, from some decades old dribbling out a few barrels a day to new Permian wells producing 10 MB/D or more. We think it’s likely that the EIA is somehow undercounting crude oil output.

Flaring of associated natural gas in the Permian recently hit 661 million cubic feet per day (MMCF/D), up sharply from the previous high late last year of 450 MMCF/D. This reflects growing crude oil production. The continued shortage of take away infrastructure in the region to handle the natural gas that is extracted with the crude oil is why there’s more flaring.

Nobody really knows why the EIA’s weekly report includes an error term that is growing embarrassingly large. Robert Merriam, director of the office of petroleum and biofuels statistics at the EIA, admitted, “There’s something more systematic going on that our surveys aren’t capturing. We have some theories on what that may be and we’re trying to look into it.”

Undercounting crude oil production seems the most likely explanation. If so, this would reinforce a couple of important themes:

1) The U.S. continues to gain market share in world energy markets

2) Growing volumes even with moderate pricing defy those who argue that much of our shale activity is unprofitable

Oil and gas production continue to surprise to the upside, which can only be good for midstream energy infrastructure.

SL Advisors is the sub-advisor to the Catalyst MLP & Infrastructure Fund.  To learn more about the Fund,  please click here.

SL Advisors is also the advisor to an ETF (USAIETF.com).

image_pdfimage_print