Bond Market Looks Past Fed
Last week Fed chairman Jay Powell walked back his earlier, clumsy comments which had implied several additional rate hikes in 2019. His words at the press conference following their December 19 meeting were poorly considered, “Maybe we’ll be raising our estimate of the neutral rate and we’ll just go to that, or maybe we’ll keep our neutral rate here and then go one or two rate increases beyond it.” That sounded as if rates could move 1% higher.
Many analysts focus on the “blue dots”, a graphical representation of individual FOMC members’ rate forecasts. The Fed’s been publishing these for seven years now, and the increased transparency of which they are part is most welcome. But it’s important not to confuse what the FOMC says they’ll do with what actually happens. The bond market is far more accurate at forecasting Fed policy than the Fed itself.
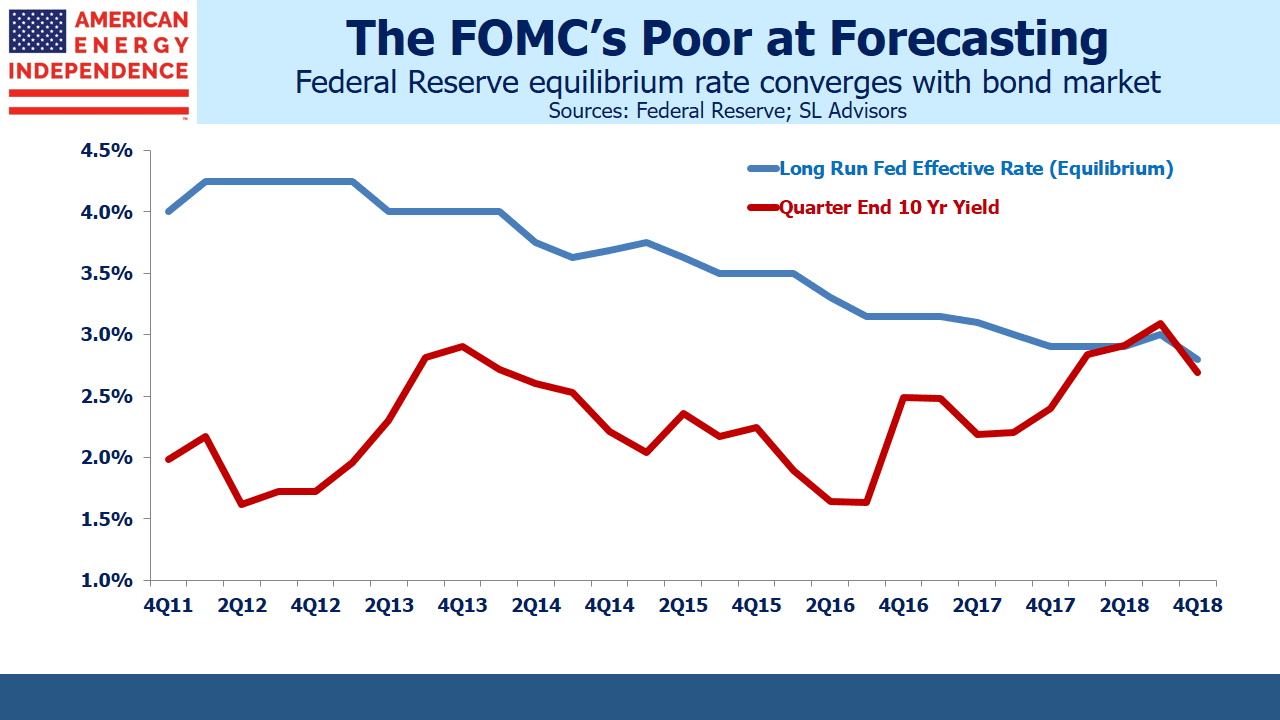
The long-run equilibrium rate, or neutral Fed funds rate, has been sliding lower for years. Bond investors never believed that the Fed would eventually increase short term rates to 4.25% back in 2012 when the first blue dots appeared. The yield on ten year treasury notes represents the average short term rate likely to prevail over the next decade, and it hasn’t been above 4% since the 2008 financial crisis. The market has maintained its disbelief, and FOMC rate forecasts have been steadily revised down to converge.
December was a particularly bad month for equity investors everywhere, and Powell’s comments provided another reason for sellers to act. Press reports suggested that the softening global growth and market turmoil weren’t factors in their deliberations.
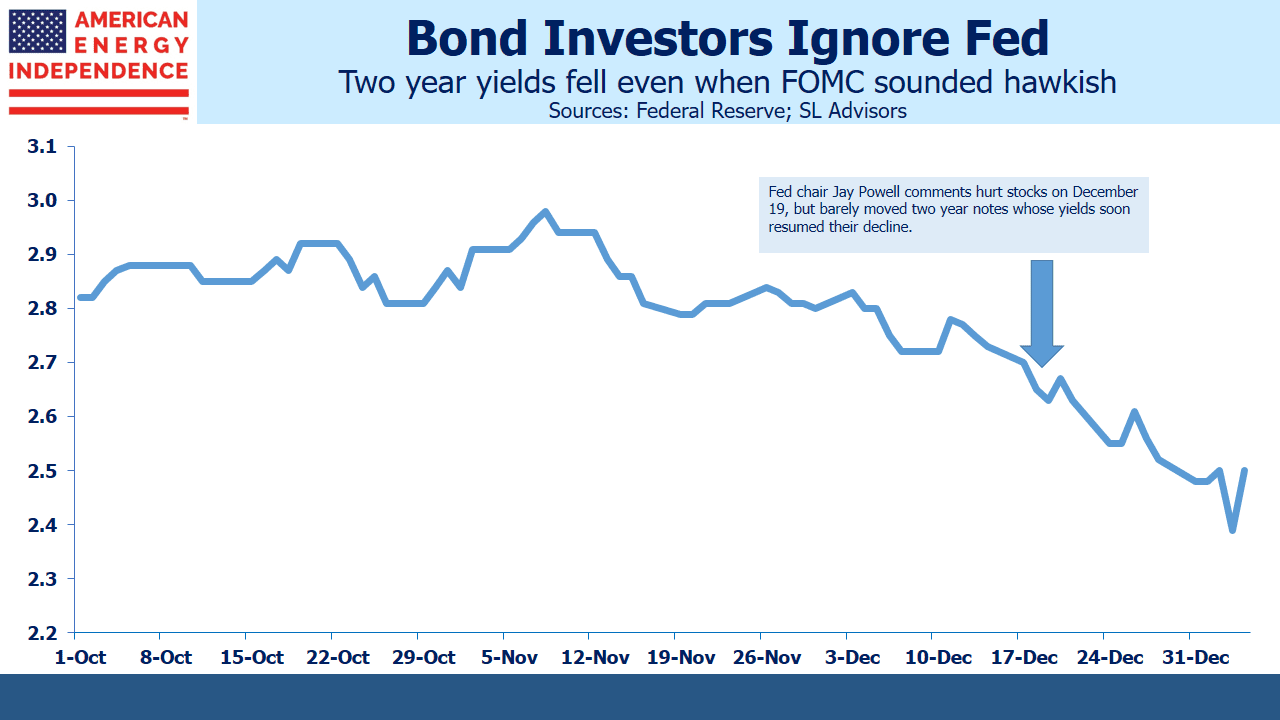
However, two year treasury yields, a good indicator of market expectations for near term Fed policy, barely rose on the day of the press conference before resuming their downward trend. So the Fed chair bowed to the inevitable, and moderated his public position to reflect what the bond market already knew, “We’re listening carefully with – sensitivity to the message that the markets are sending and we’ll be taking those downside risks into account as we make policy going forward,”
The point here is that equity investors seem to be more scared of the Fed than bond investors. Fixed income markets never priced in Powell’s clumsy comments, even while stocks dropped at the time. The growing history of the blue dots reveal a welcome insight into FOMC member thinking.
Years ago, when Alan Greenspan personified the mysterious Fed chairman as oracle, speaking but rarely providing much information, markets believed the Fed knew more than anyone. Their superior access to data on current economic performance meant that Fed comments on growth were likely informed by data unavailable to others. The truth is that JPMorgan Chase and Amazon probably have better real-time data on the U.S. consumer than the Fed.
It’s helpful to know what policymakers expect to do, which is why the blue dots, or “dot plot” are interesting. Although Jay Powell has argued that they’re individual forecasts and not meant to represent a consensus, it’s hard to interpret them any other way. The median of fourteen individual estimates clearly reflects group consensus, no matter how much he may try to downplay it.
What we’ve learned over the seven years of blue dots is that the Fed’s consensus is terrible as a forecast. The bond market is better at predicting Fed policy than the Fed. With the two year treasury yield at 2.5%, the market is expecting little change in Fed policy this year. And with ten year yields at 2.7%, below the FOMC’s equilibrium rate, the peak in the rate cycle isn’t far away.
With the Fed likely on hold for a while, the Equity Risk Premium continues to show stocks are cheap (see Stocks Are the Cheapest Since 2012). Energy Infrastructure, in spite of its strong start to the year, is still lower than where it was a year ago even while every financial metric (EBITDA, leverage, volumes) is improving.
Comments from Fed officials shouldn’t be confused with policy actions. Equities remain very attractive.
SL Advisors is the sub-advisor to the Catalyst MLP & Infrastructure Fund. To learn more about the Fund, please click here.
SL Advisors is also the advisor to an ETF (USAIETF.com).
Important Disclosures
The information provided is for informational purposes only and investors should determine for themselves whether a particular service, security or product is suitable for their investment needs. The information contained herein is not complete, may not be current, is subject to change, and is subject to, and qualified in its entirety by, the more complete disclosures, risk factors and other terms that are contained in the disclosure, prospectus, and offering. Certain information herein has been obtained from third party sources and, although believed to be reliable, has not been independently verified and its accuracy or completeness cannot be guaranteed. No representation is made with respect to the accuracy, completeness or timeliness of this information. Nothing provided on this site constitutes tax advice. Individuals should seek the advice of their own tax advisor for specific information regarding tax consequences of investments. Investments in securities entail risk and are not suitable for all investors. This site is not a recommendation nor an offer to sell (or solicitation of an offer to buy) securities in the United States or in any other jurisdiction.
References to indexes and benchmarks are hypothetical illustrations of aggregate returns and do not reflect the performance of any actual investment. Investors cannot invest in an index and do not reflect the deduction of the advisor’s fees or other trading expenses. There can be no assurance that current investments will be profitable. Actual realized returns will depend on, among other factors, the value of assets and market conditions at the time of disposition, any related transaction costs, and the timing of the purchase. Indexes and benchmarks may not directly correlate or only partially relate to portfolios managed by SL Advisors as they have different underlying investments and may use different strategies or have different objectives than portfolios managed by SL Advisors (e.g. The Alerian index is a group MLP securities in the oil and gas industries. Portfolios may not include the same investments that are included in the Alerian Index. The S & P Index does not directly relate to investment strategies managed by SL Advisers.)
This site may contain forward-looking statements relating to the objectives, opportunities, and the future performance of the U.S. market generally. Forward-looking statements may be identified by the use of such words as; “believe,” “expect,” “anticipate,” “should,” “planned,” “estimated,” “potential” and other similar terms. Examples of forward-looking statements include, but are not limited to, estimates with respect to financial condition, results of operations, and success or lack of success of any particular investment strategy. All are subject to various factors, including, but not limited to general and local economic conditions, changing levels of competition within certain industries and markets, changes in interest rates, changes in legislation or regulation, and other economic, competitive, governmental, regulatory and technological factors affecting a portfolio’s operations that could cause actual results to differ materially from projected results. Such statements are forward-looking in nature and involves a number of known and unknown risks, uncertainties and other factors, and accordingly, actual results may differ materially from those reflected or contemplated in such forward-looking statements. Prospective investors are cautioned not to place undue reliance on any forward-looking statements or examples. None of SL Advisors LLC or any of its affiliates or principals nor any other individual or entity assumes any obligation to update any forward-looking statements as a result of new information, subsequent events or any other circumstances. All statements made herein speak only as of the date that they were made. r
Certain hyperlinks or referenced websites on the Site, if any, are for your convenience and forward you to third parties’ websites, which generally are recognized by their top level domain name. Any descriptions of, references to, or links to other products, publications or services does not constitute an endorsement, authorization, sponsorship by or affiliation with SL Advisors LLC with respect to any linked site or its sponsor, unless expressly stated by SL Advisors LLC. Any such information, products or sites have not necessarily been reviewed by SL Advisors LLC and are provided or maintained by third parties over whom SL Advisors LLC exercise no control. SL Advisors LLC expressly disclaim any responsibility for the content, the accuracy of the information, and/or quality of products or services provided by or advertised on these third-party sites.
All investment strategies have the potential for profit or loss. Different types of investments involve varying degrees of risk, and there can be no assurance that any specific investment will be suitable or profitable for a client’s investment portfolio.
Past performance of the American Energy Independence Index is not indicative of future returns.


Wonderful insight.