Criticism Of The Fed Goes Mainstream

SL Advisors Talks Markets
Criticism Of The Fed Goes Mainstream
Loading
/

Earlier this month there was a fascinating exchange on Bloomberg TV between former NY Fed president Bill Dudley and journalist Jonathan Ferro. Dudley has been vocal in criticizing the slow rate at which his former FOMC colleagues have been normalizing monetary policy. He’s pointed to the robust stock market and warned that the Fed’s going to tighten financial conditions enough to push up the unemployment rate. Ferro, refreshed by the frank analysis and used to more guarded responses from Fed officials, asked Dudley “why Fed officials don’t talk like you?”

Dudley responded that it’s unpleasant to talk about how you have to push up the unemployment rate and put people out of work, even though that is the Fed’s goal.

The Fed wants tighter financial conditions. This needs to manifest itself via higher long term yields, since sectors like housing and capital spending are more sensitive to the ten year yield than the Fed Funds rate. And the Fed needs a weaker stock market, because households that feel poorer will spend less, cooling things down. It is truly an unpleasant prospect. Covid has receded other than a few remaining constraints – Broadway shows still require masks and travel outside the country may still leave you stranded if the required Covid test before re-entry is positive.

But with 3.6% unemployment the vast majority must be better off, and happier, than they will be once the Fed engineers tighter financial conditions and the consequent economic slowdown. On Thursday, Fed chair Jay Powell said, “It’s absolutely essential to restore price stability. Economies don’t work without price stability.”

Ten year yields are approaching 3%. Compared with 8.5% annual inflation Bill Dudley notes that policy remains very loose. But yields are edging up, helped by Fed officials warning of successive 0.50% rate hikes, as Powell did last week.

The stock market isn’t helping much, even after last week’s sell-off. For the first time in a decade, the Equity Risk Premium (ERP) doesn’t make stocks look cheap. The 5.4% earnings yield, based on Factset bottom-up figures, versus a 2.9% ten year yield puts the ERP at 2.5, right on the average since 2000 when the dot.com bubble burst.

Earnings forecasts are being revised higher, reflecting little evidence of any influence from the Fed. Analysts still expect growth next year of 10%. But a 3.4% ten year yield in 2023 would be enough to keep the ERP at 2.5. By this measure, stocks are as expensive as they’ve been in the past decade. Tighter financial conditions include a weaker stock market according to Bill Dudley. If the stock market repriced to its average ERP of 3.3 over the past ten years, that would imply the S&P500 around 15%, lower.

When a liberal-leaning magazine such as The Economist blames today’s inflation on the Democrats pushing through last year’s $1.9TN stimulus, you know it’s conventional wisdom. Larry Summers must be a thorn in the side of the White House, since he warned of such as the package was being debated and hasn’t let up since. This week’s Economist analyzes the Fed’s “historic mistake on inflation” and includes a special report on central banks. They blame the Fed’s modified interpretation of its mandate to allow higher inflation, along with institutional groupthink that assumed stable prices were hard-wired into the economy.

The Economist also notes that central banks have taken on a broader remit in recent years. In the US progressive Democrats wanted that to include policies to counter climate change. Fed candidate Sarah Bloom Raskin withdrew her nomination when Senate Republicans objected to her past comments pushing the Fed to withhold pandemic support from fossil fuel firms.

However, the Fed does now seek maximum employment that is “broad-based and inclusive”. Powell explained the shift thus: “This change reflects our appreciation for the benefits of a strong labor market, particularly for many low- and moderate-income communities,”

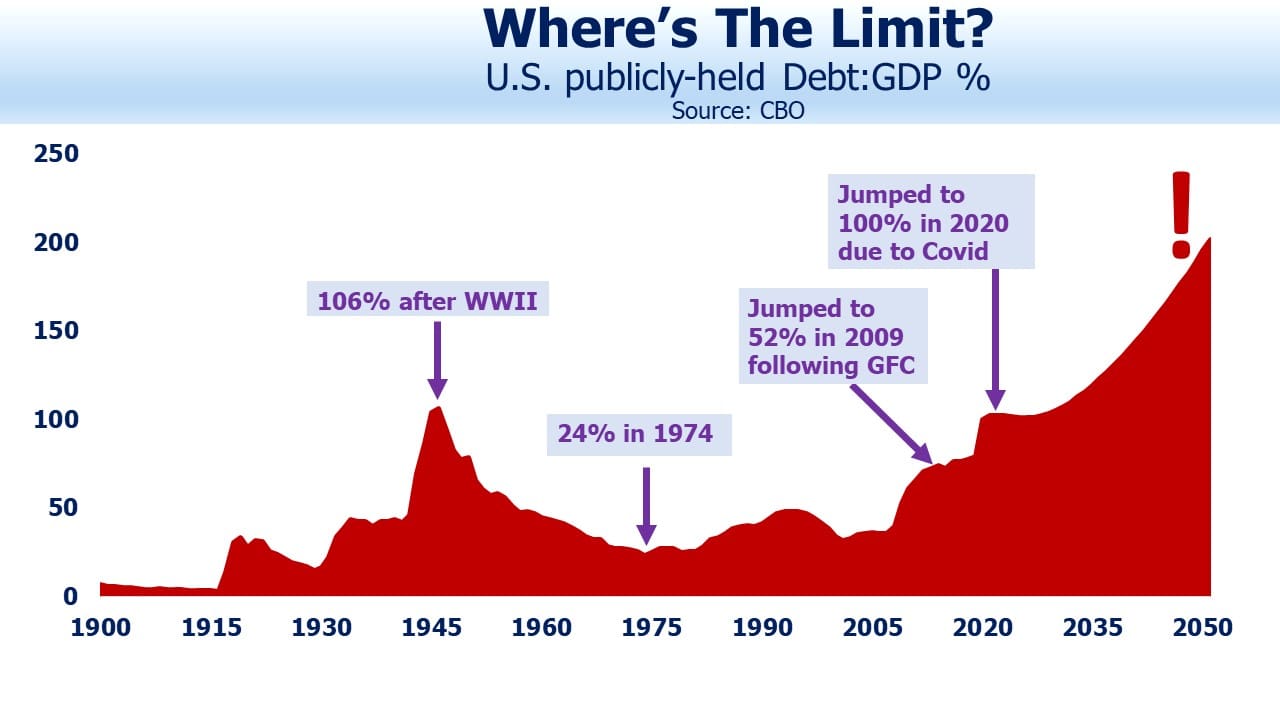
There is evidence that minority unemployment, which is always higher than for the general population, rises faster during a slowdown. This will be a consideration in the background when the FOMC is facing rising joblessness but has not yet conquered inflation. Debt:GDP is the most important reason America will learn to live with higher inflation, since it allows lower or negative real rates which makes it cheaper to finance. But the mix of unemployment will also play a role in FOMC thinking.

On Saturday I had the good fortune to play golf with Bill Dudley. He denied that he was captain of the Federal Reserve golf team, in spite of what I saw as evidence in support. We spent much time exchanging views on Fed policy and the outlook for rates. Dudley thinks the happy combination of declining inflation and a rate cycle peak of around 3%, as laid out in the most recent FOMC projection materials, will be hard to achieve. I think if Dudley was on the FOMC today they would have acted against inflation in a more timely fashion.

The Fed has committed the biggest inflation mistake in its history. The FOMC won’t concede such, but their hawkish shift shows it was obvious before The Economist made it official. They’re still a long way from creating tight financial conditions. Leave the bond market to those who tolerate returnless risk.

We have three funds that seek to profit from this environment:

Energy Mutual Fund Energy ETF Inflation Fund

Please see important Legal Disclosures.

The Continued Sorry Math Of Bonds

Sign up here for this Thursday’s webinar at 12 eastern. SL Advisors’ Midstream Energy and Inflation Update

Last week an investor asked us what he should do with his bond portfolio. We began publishing a monthly newsletter in January 2010 and over the years it evolved to the now twice-weekly blog. The poor outlook for bonds has been a regular topic almost from the beginning. Through descriptions such as “returnless risk” and “pigmy yields” we have sought to convince investors what a losing proposition they face in fixed income. The partners of SL Advisors have not personally held any bonds since the firm was founded in 2009.

In a blog post in October 2011 (see The Sorry Math of Bonds) we made the case for replacing a bond portfolio with a 20/80 barbell of stocks and cash. Back then the 2% dividend yield on the S&P500 was close to the yield on ten year treasuries. The logic of preferring stocks is that their dividends grow over time, and their tax treatment is better. These two features mean that the investment return on $100 in a ten year bond yielding 2% can be achieved with a lot less in stocks – we suggested $20 back then, with the rest sitting in treasury bills. It’s not complicated to build a model comparing the two – the most sensitive assumption is that dividend yields are unchanged at the end of the ten year investment horizon.

Other blog posts on the topic include A New Approach to Bonds, Stocks Are the Cheapest Since 2012 (see 3rd and 4th charts) and Stocks Are Still A Better Bet Than Bonds (see 4th chart).

Naturally, our response to this investor’s question was to dump bonds and create a bond-like portfolio of stocks and cash. We’ve been recommending this for over a decade.

The charts show how this approach has worked. Since November 2011, bonds (defined as the iShares Core U.S. Aggregate Bond ETF, AGG, which tracks the Bloomberg US Agg Total Return Index) have returned 3.0% p.a. This is considerably better than we would have predicted a decade ago and not something investors should expect over the next ten years. The S&P500 returned 16.2% p.a. over the same period. The 20/80 portfolio delivered 3.7% p.a., assuming the cash portion was invested at the Fed Funds effective rate. Cash didn’t always earn close to 0% over the past decade. Next year cash balances should once again start to receive a modest return.

The two portfolios tracked each other quite closely as well, although the stocks/cash mix was marginally less volatile. Its monthly returns had a standard deviation of 0.8%, versus 0.9% for bonds. The maximum drawdowns were also similar. Bonds suffered a 4.0% loss of value in 2013 during the “taper tantrum,” an experience that is behind the current FOMC’s measured (we would say very overdue) withdrawal of their bond buying program. The stocks/cash portfolio fell 3.9% from its previous high in March 2020 because of Covid. Bonds suffered two other drawdowns in excess of 3%, while the stocks/cash portfolio did not.

The 20/80 stocks/cash portfolio beat bonds with less risk over the past decade. Remember, past performance is no guarantee of future returns.

Although monthly returns had similar volatility, rolling two year returns varied more for bonds than their synthetic substitute. The point of a fixed income allocation lies not just in its lower risk profile but also its diversification. Clearly, a 20/80 stocks/cash portfolio will be correlated with stocks and provide no diversification, albeit with 80% less volatility.

Over the past three years the correlation between stocks and bonds (calculated using trailing two years’ monthly returns) has trended up, although it remains low. Diminutive bond yields have underpinned equities for years. A sharp drop in bond prices remains a major risk for stocks, even if it’s hard to predict what might cause that. In such circumstances, a conventional stock and bond portfolio would likely not enjoy much diversification.

In my 2013 book Bonds Are Not Forever; The Crisis Facing Fixed Income Investors I looked at the stocks/cash substitute for bonds in more detail (Pp 195-8).

The case for replacing fixed income with the stocks/cash barbell is stronger today than it was in 2011 when we first suggested it. US government bond yields are held down by $TNs of demand from return-insensitive buyers such as foreign central banks, and others with inflexible mandates such as pension funds. With real yields of -1% dragging down returns throughout fixed income, the only prospect buyers have of a decent return is if these trends continue. It’s a bit like owning gold — you’re hoping someone else takes you out at a sillier price than you paid.

The conventional belief that investors should retain a fixed income allocation is being undercut by negative real yields. The government’s response to Covid shows that massive fiscal stimulus will be deployed against a recession, and the Fed’s balance sheet will be used to monetize debt. This new paradigm makes inflation more likely than deflation following an economic downturn. It’s time to leave the bond market to those not in need of a return on their investment.

We have three funds that seek to profit from this environment:

Energy Mutual Fund Energy ETF Inflation Fund

Please see important Legal Disclosures.


Deciphering the FOMC’s Tea Leaves

Last week’s FOMC meeting for once gave the market something to ponder. The $120BN of monthly bond buying looks set to taper before the end of the year, and to be down to zero by next summer. Fed buying of mortgage-backed securities has been especially superfluous, as shown by the red-hot housing market.

The market interpreted a more hawkish message, and eurodollar futures yields rose to price in a slightly more aggressive pace of tightening. It’s true that median rate expectations of FOMC members edged up compared with June. But the range of forecasts remains very wide. This may be one of the reasons Fed chair Jay Powell continues to advise against too close a reading of the projection materials, even though we all pore over them with great care as soon as they’re released.

To use one example – the median FOMC member’s forecast for the Fed Funds rate at the end of 2023 rose, from 0.625% to 0.875%. A 0.25% increase, even over two years out, seems significant. But as the chart shows, views within the FOMC vary widely. One member doesn’t think they’ll have raised rates at all by then (down from five who held that view three months ago). There’s still a gaping 1.5% gap between the high and low forecast. Committee discussions about the outlook must be lively, at least within the constraints of what’s plausible when discussing monetary policy.

Most FOMC members continue to expect to raise rates faster than implied by eurodollar futures, which offers an opportunity for those able to participate. The spread between Dec ‘23 and Dec ‘25 futures remains too flat – it came in briefly on Wednesday along with the twos/fives yield curve following the release of the FOMC statement but widened again the next day.

Another interesting evolution concerned FOMC members’ “longer run” outlook for short term rates, the so called equilibrium rate. For years this has been declining, along with real rate or the premium markets demand over inflation. Chair Powell has discussed “R-star” in the past. R-star is the Fed’s assumed equilibrium real rate, or the margin over inflation they should target for neutral policy. R-star of 0.5% added to 2% inflation is how they’ve arrived at a 2.5% neutral rate, and it’s the reason today’s FOMC appears so dovish. A lower equilibrium rate means there’s less room to cut rates when needed, which makes it harder to achieve their inflation target. Hence the new policy adopted just over a year ago of allowing inflation to exceed their 2% target rather than acting pre-emptively to prevent it.

So it’s notable that FOMC members’ “longer run” forecast of short-term rates came down somewhat. Only 15 of them offered such a forecast, down from 17 in June and short of the 18 who provide annual rate forecasts through 2024. It’s unclear why an FOMC member would provide less than a complete set of forecasts, but the missing ones were probably more hawkish because all the three forecasts in June above 2.5% were gone last week.

At the same time, inflation forecasts have edged up slightly, with core Personal Consumption Expenditures inflation (the Fed’s preferred measure) expected to run at 2.2% in 2023, up 0.1% from June. Most notably, although 2.5% is their median long run neutral policy rate, only one FOMC member expects rates to be above that level even by 2024.

What conclusions should one draw from all this numerical insight into the Fed’s thinking? Their opinions vary widely, but they expect to raise rates faster than implied by the market. But they are optimistic — even though they’ve had to constantly revise their inflation forecasts higher, they overwhelmingly expect inflation to return to their 2% target without having to raise rates above the 2.5% neutral level.

Moreover, the tone of the FOMC is very dovish, at least to this observer of 40+ years. There are no hawks in the traditional sense. The notion that monetary policy can be used to moderate income inequality, as Jay Powell has suggested in the past, has not been suggested by his predecessors. It’s easy to imagine the dilemma such a view will pose when it comes time to tighten rates. There will be a healthy debate about whether lower income Americans are hurt more by inflation or higher rates, and the consideration of income inequality along with the level of employment will cloud the right course of action.

It’s also likely that Democrat administrations will apply a monetary policy litmus test when selecting future FOMC members, in the same way that Supreme Court candidates’ past rulings are examined for signs of reliable political bias. For example, Boston Fed president Eric Rosengren, who just announced his early retirement, is an outspoken critic of the Fed’s bond buying (see The Fed’s Balance Sheet Has One Way To Go). His replacement is likely to be more dovish.

The bottom line is that, while short term rates will inevitably rise, the Fed has shifted to care more about maximizing employment than protecting savers. Investors should position accordingly.

We have three funds that seek to profit from this environment:

Energy Mutual Fund Energy ETF Inflation Fund


A Pause On Spending?

Democrat Senator Joe Manchin from West Virginia holds more sway than most over White House legislative strategy, because he’s one of the few willing to break ranks with Democrat orthodoxy. In his WSJ Op-Ed last week, he argued for a “strategic pause” on Congressional spending. This means his support for the White House’s proposed $3.5TN budget isn’t assured. Manchin sensibly notes that we’re leaving ourselves little fiscal room to deal with future crises, such as a more virulent Covid mutation, terrorist attack or major international conflict. Manchin doesn’t mention Modern Monetary Theory, but it’s safe to assume he’s a skeptic.

Friday’s weak jobs report revealed how investors are regarding the balance of risks. Although it may add a modest delay to the onset of Fed tapering, ten-year yields rose as the yield curve steepened. The payroll data provided some support to FOMC doves, but also strengthens the argument in favor of further fiscal stimulus. Since spiraling indebtedness provokes no discernible economic costs, the threshold for more of the same is falling.

This is what provoked Bill Gross to refer to bonds as “investment garbage” in an interview last week. He’s right, but his warning that ten-year treasury yields could reach 2% in a year is unlikely to cause much concern. Yields have been too low for over a decade, and at 2% treasuries would still represent return-free risk. Japan ($1.3TN), China ($1TN) and our own US Federal Reserve ($5.7TN) are the three biggest in a long list of non-commercial buyers.

No return-seeking investor should own bonds, but avoiding fixed income with stocks and cash retains a link to interest rates, because low yields continue to show the Equity Risk Premium (ERP) still favors stocks. Factset earnings estimates continue to improve. Forecasts for FY 2021 profits have risen 25% since January. Year-over-year EPS growth for 2022 is 9%.

The ERP average over the past two decades is higher than over the past half century. Using more recent history, stocks are still cheap but not outrageously so. As long as earnings continue growing, the main risk will be interest rates. Even Bill Gross is looking for a <1% increase in yields, an acknowledgment that demand is permanently skewed by central banks and other buyers with inflexible mandates. A 2% ten year treasury yield might be a minor shock if reached quickly but would not move stocks into expensive territory.

The risk of foreign selling has gone, since it’s now clear the Fed would step in to offset a sharp rise in yields. In fact, it’s not a huge leap to consider the circumstances under which the Fed might feel additional bond support was necessary. If ten-year yields rose to, say, 3% the FOMC might assess a potential threat to economic growth and employment. Joe Manchin worries about excessive spending driving inflation, but he doesn’t warn of indebtedness driving interest rates punitively high. Perhaps he’s also concluded that the Fed stands ready, just as MMT advocates.

In spite of weaker than expected economic data over the past month, long term yields have drifted higher.  The yield curve is too flat, pricing in just over one tightening per year from 2023-25 versus the FOMC “blue dot” forecast of almost twice that rate. Eurodollar futures moved back towards the FOMC’s rate path but remain more sanguine about future rate hikes than even the FOMC doves.

Coincident with the steeper curve, inflation sensitive sectors such as gold and silver outperformed on Friday. Weak economic data make additional fiscal stimulus more likely.

Russia’s central bank warned that if global inflation isn’t constrained the global economy could, “deteriorate drastically and rapidly.” While not a thought leader, it illustrates that inflation is already a global concern.

Bond yields remain constrained between the threat of more spending and the promise of ongoing central bank support if needed. Earnings remain the key driver of returns, and the picture there is positive. Stocks remain the place to be.

To learn why you should worry about inflation, watch this brief video.


Why Inflation Isn’t What You Think

The Federal Reserve has long wrestled with stubbornly low inflation. A decade ago few would have expected this to be a problem, but Personal Consumer Expenditure (PCE) inflation, the Fed’s preferred measure, is coming in at 1.8% this year. Federal Open Market Committee (FOMC) members have been considering allowing inflation to overshoot their target of “around 2%”. As Eric Rosengren, president of the Federal Reserve Bank of Boston, noted, if you’re trying to average 2%, “you can’t have only observations that are below 2 per cent.”

One consequence is that, when inflation does eventually move above 2%, the FOMC may delay efforts to lower it so as to allow for some catch up.

Outside of the FOMC’s technical concern with achieving its desired 2% average, inflation generates few worries. Keeping up with the cost of living is a crucial objective of saving for retirement, yet few appreciate a shortcoming in traditional measures of inflation.

Inflation indices measure the cost of a representative basket of goods and services of constant utility. The basket rarely fits individuals, but it reflects society’s pattern of purchases and so is right on average. The catch is in the last phrase, of constant utility. Products and services generally improve, and because those improvements increase utility, statisticians typically adjust for the improvement, lowering inflation.

Consumer electronics is a good example. iphones get better and more expensive with every new release. But the inflation data place a value on those improvements and adjust down to calculate the price of an iphone with the same features. My niece took clear, well-lit photos on the weekend with her iphone 11. The phone costs more, but the photo quality means you’re getting more phone than before. Better photos mean more utility, although beyond the enjoyment of being flattered by the imagery, there’s little else to do with that extra utility.

The Bureau of Labor Statistics (BLS) publishes the Consumer Price Index (CPI). The Fed prefers the PCE because it dynamically adjusts for shifting consumption patterns, and is more representative of actual consumer behavior. But for decades we followed the CPI, and the point that follows applies to inflation indices generally.

The BLS publishes a list of items in their CPI subject to “hedonic quality adjustment”. It’s mostly clothing and consumer electronics. Mens’ suits are apparently improving in quality as well – or perhaps it’s now harder to buy a cheap suit. In any event, suits are apparently better value for money than in the past, which in inflation math is deflationary.

I wrote about this topic in Bonds Are Not Forever; The Crisis Facing Fixed Income Investors. In a subsequent blog I highlighted one of the most absurd hedonic quality adjustments – airline tickets (see Why Flying is Getting More Expensive). Even though economy flyers everywhere would agree that cramped seats and lousy food make commercial air travel an endurance, the BLS found that quality (which they defined simply as ease of cancellation) had improved, boosting value for money and thereby lowering the cost of airfares within the index.

What it means is that keeping up with inflation doesn’t mean keeping up with your neighbors. The statisticians are measuring prices, and their approach has some logic. But they’re just not measuring what most of us think they’re measuring. If inflation seems lower than the rate you experience personally, it’s probably because you accept quality improvements but don’t think of them as price reductions. iphones cost more, even if hedonic quality adjustments provide an offset. You’re still having to pay more cash, leaving less for something else. Inflation statistics reflect this less than you think.

Pension Funds Keep Interest Rates Low

The Equity Risk Premium reveals that stocks are cheap relative to bonds (see Stocks Offer Bond Investors an Opening).  A corollary of this insight that bonds are expensive is that you can replicate the return on $100 in ten year treasury notes with a combination of stocks and cash. It relies on a few assumptions, such as an unchanged dividend yield, known dividend growth rate and unchanged tax policy. Because it shows that as little as 13% in equities, with the rest in cash (i.e. a 13/87 barbell) can match the ten year note, it starkly highlights the expense of bonds.

Make Your Own Bond 13_87

Pension funds are large investors, including in fixed income. The OECD estimates that they hold over $8TN in bonds, equal to approximately 10% of the global investment grade bond market. About half is U.S. pension funds.

An interesting blog post by Colin Lloyd (see The Pension Fund Apocalypse)  estimates that the real return on this $8TN in debt is negative.

Pension Allocations OECD 12 Biggest Countries

A consequence is that U.S. pension funds earned a negative real return last year of -3.9%. The S&P500 was -4.4% (nominal), but fixed income didn’t help.

Pension Funds Real Returns

This unsurprising result has worsened with this year’s further drop in bond yields. Although the math of divesting from long term debt is compelling, pension funds face complex restrictions on their asset allocation. For example, U.S. pension funds maintain a 28.1% allocation fixed income, in the certain knowledge of a negative real return. They inexplicably raised their allocation, from 24.9% the prior year.

What should have happened by now is that discerning pension funds shift away from bonds, but so far there’s little evidence of this.

The demand for fixed income from investors such as pension funds is fairly inelastic. Colin Lloyd calculates that the nominal return on bonds over the past century is 4.3%. The regulatory framework assumes that negative real returns can’t persist indefinitely, and that mean reversion will bring higher yields. But the inability or unwillingness of pension funds to lower their exposure makes such a correction less likely.

More flexible investors, such as endowments and foundations, can be more discriminating. But the persistence of low/negative yields, with almost $17TN of sovereign debt now yielding less than zero, shows that demand remains strong.

Bond yields may rise from their recent new lows. But a return to the long run average real return of 2% would require ten year notes to yield 3.5-4%, double their current level. Continued negative real returns and unchanged fixed income allocations will make it harder for pension funds to be fully funded.

It doesn’t have to lead to a crisis, but it’s one reason to expect long term rates will remain low for the foreseeable future. Perversely, for funds that seek to match the cashflows of assets and liabilities, lower interest income can lead to greater bond investments to achieve a required level of cashflow. What’s needed is a relaxation of regulations to allow a more objective rejection of bonds when returns are inadequate.

Pension funds are one reason rates have stayed low.

SL Advisors is the sub-advisor to the Catalyst MLP & Infrastructure Fund.  To learn more about the Fund,  please click here.

SL Advisors is also the advisor to an ETF (USAIETF.com).

Bond Buyers Should Buy Pipeline Stocks

Yields on McDonalds’ Euro-denominated bonds recently joined European sovereign debt in negative territory. It’s a headline writers dream (juicy burgers, not yields…customers and investors pay to do business, etc).

$17TN in publicly traded debt now yields less than zero – 30% of the entire investment grade market. Debates rage about what this means. Bond investors are not accused of being analytically weak – something bad must be over the horizon. As mentioned before, we’re contemplating the idea that such a stubborn retention of fixed income investments reflects a degree of risk aversion towards stocks, for fear of a sharp fall. The searing memories of the financial crisis are within the careers of most market participants. Stocks are always vulnerable to a big sell off. But the preponderance of caution reflected in the scramble for low-risk yet yield-less bonds suggests speculative fever is not rampant. In this view, stocks are cheap.

The energy sector has provided unattractive risk/return of late. It’s why it’s so cheap. One of the reasons for poor sentiment could be climate change. 82% of the world’s energy comes from fossil fuels, and the average of serious 20-year forecasts sees this at around 80% in 2040. Reading articles on renewables can consume much of a day, every day, while those expecting the 82% share to stay roughly the same are a rare breed.

If equity valuations on midstream energy infrastructure stocks reflect a widespread belief that oil and gas pipelines will soon be as useful as a VHS recorder, bonds issued by these same companies should offer commensurately high yields.

But they don’t. A review of yields on the investment grade bonds of U.S. issuers in the American Energy Independence Index averages 3.7% (using the weights of the index). Although yields of any kind are hard to obtain nowadays, the 3.9% yield on 2054 bonds issued by Enterprise Products Partners (EPD) suggests a high expectation of being repaid in full. This in turn requires pipelines and related infrastructure to maintain their critical role in America’s energy supply for at least another four decades. EPD’s stock yields over 6%. Its distribution is growing and buybacks are likely. Try and conceive a scenario in which the holder of the 2054 bonds will, over any plausible investment horizon, do better than the equity investor.

Pipeline Stocks Dividends on Bond Yields

Kinder Morgan (KMI) has bonds maturing in 2098, in effect perpetual debt, yielding 5.1%. Although this is modestly higher than the stock’s 4.9% dividend yield, next year’s expected 25% hike will fix that. Although the 2098 bond issue is a tiny $26MM, they have $33BN outstanding, much falling due after 2040. The holders of KMI 2098 bonds no doubt congratulate themselves for doing better than investing in French energy giant Total (TOT), who recently issued perpetual Euro debt at 1.75% (see Blinded by the Bonds). But if they like KMI’s 80 year bonds, they’d have to prefer the equity.

The investment grade issuers in the table represent half of the American Energy Independence Index. Their long dated bonds yield 4.3% — profligate by today’s standards, but nonetheless too low to reflect anything other than confidence of full repayment over the decades ahead. The holders of these bonds must regard equity buyers as having abandoned all reason in allowing dividend yields to drift so high.

If fixed income buyers like midstream energy infrastructure, eventually equity buyers will find reason to follow.

We are invested in EPD and KMI.

SL Advisors is the sub-advisor to the Catalyst MLP & Infrastructure Fund.  To learn more about the Fund,  please click here.

SL Advisors is also the advisor to an ETF (USAIETF.com).

Stocks Offer Bond Investors an Opening

The Federal Open Market Committee probably feels pretty good about last week’s decision to cut rates. We noted the multiple macro issues confronting decision makers (see Fed Ponders Multiple Uncertainties). With Chinese trade negotiations moving away from a deal, diversification isn’t helping as all risk assets are lower.

Government bonds provide a useful counterweight at such times – U.S. ten year yields briefly dipped below 1.7%. Knowing when to sell is key to extracting value from the flight to safety.

We regularly note the Equity Risk Premium (ERP), the difference between the earnings yields on the S&P500 and ten year treasury yields. It’s been showing stocks are cheap – on days like Monday, when global stocks were routed on trade war fears, it’s easy to overlook the ERP.

Interest rates remain ruinously low. Last month, in Real Returns on Bonds Are Gone, we showed that profit growth would provide an even more powerful ERP-case for stocks.

Current fears are for a growth slowdown, although bottom-up earnings forecasts on Factset continue to project 11% higher earnings next year. The chart below reflects the impact of a 20% drop in earnings – a substantial decline. Even an outcome as dire as this would leave stocks substantially cheaper than ten years ago. During the financial crisis, earnings fell by 29% over three years, from 2006-09.

Getting the ERP back to its 50+ year average of 0.6 would require a 60% drop in earnings.

Over $12TN of sovereign debt has negative yields (see Still Fearing Another Financial Crisis). The continued inflexible allocation to fixed income of vast pools of capital reflects widespread fear of another financial crisis. In effect, a 60% drop in stocks with its consequent mean reversion of the ERP is regarded as plausible by a great many large institutional investors.

Over the near term the ERP has little to say on valuations. Trading dominates as much as ever. But over any realistic investment horizon – say a year or more – the math is striking. P/E ratios are historically high, as adherents of Cyclically Adjusted Price Earnings (CAPE) maintain. But bond yields are historically low, and there’s little point in considering either in isolation.

The pricing of financial assets reflects a healthy degree of caution, something easily overlooked when a downturn in trade negotiations hurts risk assets. Trillions of dollars is avoiding stocks in favor of the tyranny of low and negative interest rates. U.S. state and local defined benefit public pension funds hold $4.4TN in assets, $4.2TN less than projections show they need. This 48% funding shortfall isn’t going to be solved by bonds.

We think equities provide a substantial margin of safety compared with bonds for long term investors.

SL Advisors is the sub-advisor to the Catalyst MLP & Infrastructure Fund.  To learn more about the Fund,  please click here.

SL Advisors is also the advisor to an ETF (USAIETF.com).

Fed Ponders Multiple Uncertainties

If not today, then within a few weeks the Federal Reserve is likely to acquiesce to President Trump’s call for lower rates. Ten year U.S. treasury yields are low by most measures at 2.05%, but they’re the highest in the G7, and even higher than Greece’s. The President has criticized Fed policy as creating unnecessary headwinds to the economic boom his policies have created.

Trump is obviously talking his book. With the unemployment rate below 4% for a year and hourly earnings growing at 3.1%, the economy is not obviously in need of stimulus. Inflation continues to remain below the Fed’s 2% target. The Phillips Curve, which posits that you can have low unemployment, or low inflation, but not both, long ago ceased to explain the world.

There are an unusual number of macro uncertainties that the Fed must consider.

The ongoing trade dispute with China is hindering growth, and not just in China. Germany recently halved its forecast 2019 GDP growth forecast, to 0.5%. We think it’s likely the U.S. will close a deal with China in time for the economy to show a benefit heading into next year’s Presidential election.

Tensions with Iran seem to have eased recently, and crude oil has slipped by $5 as the possibility of a closing of the Straits of Hormuz has receded. Iran is likely to avoid direct confrontation with the U.S., and election calculations similarly suggest that Trump will avoid anything that could become a lengthy military engagement. The possibility of accidental confrontation remains, but this issue is for now lurking in the background.

Brexit continues to be an absorbing spectacle of self-destruction by a country enduring serial poor leadership. Although Conservative PM Boris Johnson claims that the UK is leaving the EU on October 31 with or without a deal, this seems unlikely. Parliament has voted against a hard Brexit, and as many as 30 Conservative party MPs, including former Chancellor of the Exchequer Philip Hammond, have vowed to ensure the country doesn’t leave the EU without a deal. Moreover, the PM doesn’t have a mandate for a hard Brexit, since the referendum offered a simple choice and none of the senior Brexit campaigners advocated it.

PM Johnson endured booing crowds on a recent visit to Scotland, where voters chose Remain three years ago. A rocky visit to Northern Ireland looms, whose population is also facing the prospect of being dragged unwillingly out of the EU by the English majority. Brexit is now the defining political issue in Britain. Ask where someone lives (i.e. urban vs rural) for a good guess at where they stand.

Assessing the precise economic impact of a hard Brexit is tricky. There’s plenty of historical data on countries joining trading blocs; far less of countries leaving, because as The Economist dryly notes, “…this rarely happens.” But the downside risk to the UK is substantial, and the impact might ripple across the world. Fed chair Jay Powell has cited Brexit as another potential threat to economic growth.

It’s quite possible that the October 31 deadline could pass with the UK still in the EU. Parliament is likely to prevent a hard Brexit, and the EU won’t simply eject the UK, much as many may wish to. A general election might resolve the issue, and if parties opposed to a hard Brexit (Labor and Lib-Dem) are victorious, a second referendum could reverse the first. Britain isn’t yet out of the EU, and there are several more scenes to play out.

Finally, one more risk that’s coming over the horizon is the 2020 election. It looks like Trump’s to lose, but with over fifteen months to go a lot can happen. At some point, it’s likely Trump’s re-election will look in doubt – either because the Democrats abandon their idealism and pragmatically opt for an electable candidate, or because a new presidential scandal erupts that sticks. Stocks are likely to react poorly, and a nasty presidential election that reflects badly on all concerned is probably in store.

With all these risks to consider, who can blame the Fed for taking out a little bit of insurance by lowering rates.

SL Advisors is the sub-advisor to the Catalyst MLP & Infrastructure Fund. To learn more about the Fund, please click here.

SL Advisors is also the advisor to an ETF (USAIETF.com).

image_pdfimage_print