Pipeline Cash Flows Will Still Double This Year
One of the few pleasant surprises of recent weeks is that business for the major pipelines remains solid. Now that 1Q earnings season is complete, we have revised guidance from all the companies in the broad-based American Energy Independence Index.
Caution was evident throughout on earnings calls, as one company after another described the impact of collapsing transportation demand and the high degree of uncertainty around forecasts. Some of the figures were stunning — Magellan Midstream reported a 20% drop in demand for refined products (mostly gasoline) in April, and a 76% drop in jet fuel, although they did note an improvement in the latter part of the month.
As we entered 2020, the expectation for rapidly growing Free Cash Flow (FCF) underpinned a positive outlook for the sector (see The Coming Pipeline Cash Gusher from April last year). We provided a current look two months ago (see Updating the Coming Pipeline Cash Gusher), but with minimal new guidance.
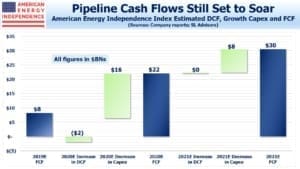
With new guidance provided on earnings calls, EBITDA and Distributable Cash Flow (DCF) have generally been revised down by 10-15%, a much smaller drop than many feared in March when the sector plunged. So our 2020 DCF forecast is now $51BN, versus $60BN a year ago. There is exposure to volumes and prices, but long term “take or pay” contracts provide solid support at times like this.
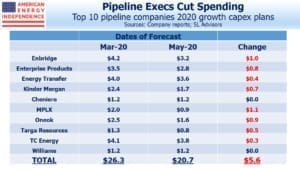
Spending on growth projects is being cut at roughly the same pace. Every dollar not spent boosts FCF. Investors regard this as welcome acknowledgment of reality – energy management teams have often been too ready to reinvest back in their business, similar to their upstream customers.
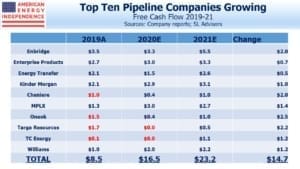
The top ten midstream energy infrastructure companies have shaved over $5BN from this year’s growth plans. Since there’s rough alignment between the drop in DCF and reduced growth capex, FCF still looks likely to double this year versus last. There can’t be many sectors that can be expected to generate such a result.
In turn, this is supporting dividends which are, for the most part, still being paid (see Pipeline Payouts Holding Up).
The story isn’t as positive for MLPs, which have been much more active in slashing payouts. The MLP-dedicated Alerian MLP ETF (AMLP) lowered its dividend again recently, reflecting what its components are doing. Compared with the midstream energy infrastructure sector, MLPs have more liquids/less natural gas exposure, more risky gathering and processing, and are more leveraged (see More Solid Pipeline Results). Only two of the ten biggest pipeline companies are MLPs, and size tends to bring diversification of flows as well as stability.
Even after incorporating the impact of Coronavirus, FCF is still expected to double year-on-year. If it happens, it’ll represent a stunning turnaround for a much maligned sector.
It’s still too uncertain to extend that forecast out to 2021. Few companies would offer any type of confident guidance. In our first piece on the topic in April 2019, we were originally looking for FCF to double again next year. That would push the sector’s FCF yield above 11%.
This is why the rebound from the lows of late March has so much momentum.
Important Disclosures
The information provided is for informational purposes only and investors should determine for themselves whether a particular service, security or product is suitable for their investment needs. The information contained herein is not complete, may not be current, is subject to change, and is subject to, and qualified in its entirety by, the more complete disclosures, risk factors and other terms that are contained in the disclosure, prospectus, and offering. Certain information herein has been obtained from third party sources and, although believed to be reliable, has not been independently verified and its accuracy or completeness cannot be guaranteed. No representation is made with respect to the accuracy, completeness or timeliness of this information. Nothing provided on this site constitutes tax advice. Individuals should seek the advice of their own tax advisor for specific information regarding tax consequences of investments. Investments in securities entail risk and are not suitable for all investors. This site is not a recommendation nor an offer to sell (or solicitation of an offer to buy) securities in the United States or in any other jurisdiction.
References to indexes and benchmarks are hypothetical illustrations of aggregate returns and do not reflect the performance of any actual investment. Investors cannot invest in an index and do not reflect the deduction of the advisor’s fees or other trading expenses. There can be no assurance that current investments will be profitable. Actual realized returns will depend on, among other factors, the value of assets and market conditions at the time of disposition, any related transaction costs, and the timing of the purchase. Indexes and benchmarks may not directly correlate or only partially relate to portfolios managed by SL Advisors as they have different underlying investments and may use different strategies or have different objectives than portfolios managed by SL Advisors (e.g. The Alerian index is a group MLP securities in the oil and gas industries. Portfolios may not include the same investments that are included in the Alerian Index. The S & P Index does not directly relate to investment strategies managed by SL Advisers.)
This site may contain forward-looking statements relating to the objectives, opportunities, and the future performance of the U.S. market generally. Forward-looking statements may be identified by the use of such words as; “believe,” “expect,” “anticipate,” “should,” “planned,” “estimated,” “potential” and other similar terms. Examples of forward-looking statements include, but are not limited to, estimates with respect to financial condition, results of operations, and success or lack of success of any particular investment strategy. All are subject to various factors, including, but not limited to general and local economic conditions, changing levels of competition within certain industries and markets, changes in interest rates, changes in legislation or regulation, and other economic, competitive, governmental, regulatory and technological factors affecting a portfolio’s operations that could cause actual results to differ materially from projected results. Such statements are forward-looking in nature and involves a number of known and unknown risks, uncertainties and other factors, and accordingly, actual results may differ materially from those reflected or contemplated in such forward-looking statements. Prospective investors are cautioned not to place undue reliance on any forward-looking statements or examples. None of SL Advisors LLC or any of its affiliates or principals nor any other individual or entity assumes any obligation to update any forward-looking statements as a result of new information, subsequent events or any other circumstances. All statements made herein speak only as of the date that they were made. r
Certain hyperlinks or referenced websites on the Site, if any, are for your convenience and forward you to third parties’ websites, which generally are recognized by their top level domain name. Any descriptions of, references to, or links to other products, publications or services does not constitute an endorsement, authorization, sponsorship by or affiliation with SL Advisors LLC with respect to any linked site or its sponsor, unless expressly stated by SL Advisors LLC. Any such information, products or sites have not necessarily been reviewed by SL Advisors LLC and are provided or maintained by third parties over whom SL Advisors LLC exercise no control. SL Advisors LLC expressly disclaim any responsibility for the content, the accuracy of the information, and/or quality of products or services provided by or advertised on these third-party sites.
All investment strategies have the potential for profit or loss. Different types of investments involve varying degrees of risk, and there can be no assurance that any specific investment will be suitable or profitable for a client’s investment portfolio.
Past performance of the American Energy Independence Index is not indicative of future returns.


3 out of the top 10 are MLPs not 2. EPD, ET, and MPLX