Investors Continue To Rotate Into Energy
The pipeline sector continued on its tear last week. The catalyst was Pfizer’s vaccine announcement a month ago, but cheap valuations have drawn increasing attention as prices have risen. The buybacks announced by several companies added further support.
For many months, we’ve argued that the biggest problem with the sector was negative sentiment. Since peaking in 2014, midstream energy infrastructure has lagged the S&P500 significantly. The industry began to acknowledge investor criticism of over-investment back in 2018. That’s when growth capex peaked. Since then, the path to growing free cash flow has been clear – but sentiment is often the last piece to fall in place.
Rising stock prices are starting to do that. This is persuading investors that what appears cheap perhaps really is. We are seeing it in our own business, where inflows have returned and investors are increasingly prepared to commit capital. The energy sector ETF XLE is on track for a record year of AUM growth.
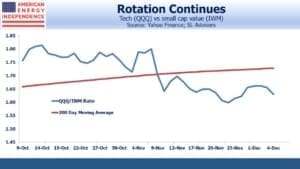
Energy is part of the broader shift from technology to value, including small cap. The widely-watched QQQ/IWM ratio solidly crossed its 200-day moving average to the downside last month, and has continued its new trend.
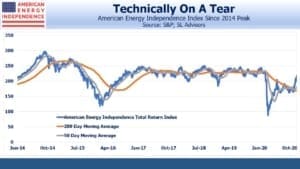
Since the beginning of October, the American Energy Independence Index has rallied 32%. At –8% YTD, it’s not inconceivable that it could claw back its remaining losses for the year. At the end of March, it had lost more than half its value over the prior three months.
So it’s worth pausing to examine valuation.
The components of the AEITR still yield 7.5% — still sufficiently high to suggest healthy skepticism regarding sustainability. Yet all companies except for Energy Transfer paid quarterly dividends at least as high as before. We calculate that payouts are now covered almost 2X by Distributable Cash Flow (DCF).
Free Cash Flow (FCF) should come in at $23BN for the year, up from $8BN in 2019. We entered 2020 expecting FCF to double, and by May reaffirmed that forecast (see Pipeline Cash Flows Will Still Double This Year).
The increase is fully driven by reduced growth capex. We see it rising to $44BN next year, an 11% FCF yield which is more than 2X that of the S&P500.
One of the reasons we like our prospects with incoming President Biden is that pipeline spending plans are likely to remain constrained. New projects are almost impossible nowadays. Environmental extremists have figured out how to use the court system to introduce unpredictable legal delays into any project. We are not unhappy with this (see Pipeline Opponents Help Free Cash Flow).
Long term capital commitments to fossil fuels face significant uncertainty with respect to public policy. While this will disappoint executives who love to build, investors like us will find much to like. Less building means less execution risk as well as more cash for buybacks, dividend hikes and debt reduction. How ironic that a Democrat president is likely to create an improved environment for investors – such was the exuberance unleashed by Trump’s pro-energy, deregulatory push.
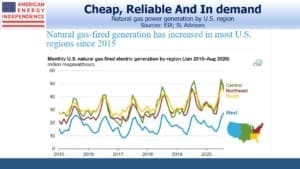
Meanwhile, the U.S. Energy Information Administration reported that natural gas fired power generation increased in most of the U.S. over the past five years. Natural gas is going to see demand growth for years to come, especially from developing countries intent on raising living standards. Don’t be distracted by all the media attention to renewables. What counts is what’s actually going on.
We are invested in all the components of the American Energy Independence Index via the ETF that seeks to track its performance.
Important Disclosures
The information provided is for informational purposes only and investors should determine for themselves whether a particular service, security or product is suitable for their investment needs. The information contained herein is not complete, may not be current, is subject to change, and is subject to, and qualified in its entirety by, the more complete disclosures, risk factors and other terms that are contained in the disclosure, prospectus, and offering. Certain information herein has been obtained from third party sources and, although believed to be reliable, has not been independently verified and its accuracy or completeness cannot be guaranteed. No representation is made with respect to the accuracy, completeness or timeliness of this information. Nothing provided on this site constitutes tax advice. Individuals should seek the advice of their own tax advisor for specific information regarding tax consequences of investments. Investments in securities entail risk and are not suitable for all investors. This site is not a recommendation nor an offer to sell (or solicitation of an offer to buy) securities in the United States or in any other jurisdiction.
References to indexes and benchmarks are hypothetical illustrations of aggregate returns and do not reflect the performance of any actual investment. Investors cannot invest in an index and do not reflect the deduction of the advisor’s fees or other trading expenses. There can be no assurance that current investments will be profitable. Actual realized returns will depend on, among other factors, the value of assets and market conditions at the time of disposition, any related transaction costs, and the timing of the purchase. Indexes and benchmarks may not directly correlate or only partially relate to portfolios managed by SL Advisors as they have different underlying investments and may use different strategies or have different objectives than portfolios managed by SL Advisors (e.g. The Alerian index is a group MLP securities in the oil and gas industries. Portfolios may not include the same investments that are included in the Alerian Index. The S & P Index does not directly relate to investment strategies managed by SL Advisers.)
This site may contain forward-looking statements relating to the objectives, opportunities, and the future performance of the U.S. market generally. Forward-looking statements may be identified by the use of such words as; “believe,” “expect,” “anticipate,” “should,” “planned,” “estimated,” “potential” and other similar terms. Examples of forward-looking statements include, but are not limited to, estimates with respect to financial condition, results of operations, and success or lack of success of any particular investment strategy. All are subject to various factors, including, but not limited to general and local economic conditions, changing levels of competition within certain industries and markets, changes in interest rates, changes in legislation or regulation, and other economic, competitive, governmental, regulatory and technological factors affecting a portfolio’s operations that could cause actual results to differ materially from projected results. Such statements are forward-looking in nature and involves a number of known and unknown risks, uncertainties and other factors, and accordingly, actual results may differ materially from those reflected or contemplated in such forward-looking statements. Prospective investors are cautioned not to place undue reliance on any forward-looking statements or examples. None of SL Advisors LLC or any of its affiliates or principals nor any other individual or entity assumes any obligation to update any forward-looking statements as a result of new information, subsequent events or any other circumstances. All statements made herein speak only as of the date that they were made. r
Certain hyperlinks or referenced websites on the Site, if any, are for your convenience and forward you to third parties’ websites, which generally are recognized by their top level domain name. Any descriptions of, references to, or links to other products, publications or services does not constitute an endorsement, authorization, sponsorship by or affiliation with SL Advisors LLC with respect to any linked site or its sponsor, unless expressly stated by SL Advisors LLC. Any such information, products or sites have not necessarily been reviewed by SL Advisors LLC and are provided or maintained by third parties over whom SL Advisors LLC exercise no control. SL Advisors LLC expressly disclaim any responsibility for the content, the accuracy of the information, and/or quality of products or services provided by or advertised on these third-party sites.
All investment strategies have the potential for profit or loss. Different types of investments involve varying degrees of risk, and there can be no assurance that any specific investment will be suitable or profitable for a client’s investment portfolio.
Past performance of the American Energy Independence Index is not indicative of future returns.


Well said.
Agreed. Well said. SL here does a good job of showing us that the light at the end of the tunnel is gradually growing brighter.