Lose Money Fast with Levered ETFs

A few years ago Vanguard invited me to their campus to give a presentation on my just-published book, The Hedge Fund Mirage. Vanguard’s business model is the antithesis of the hedge fund industry, and they were curious to hear from that rare breed, a hedge fund critic. The company’s frugal culture runs deep. As I joked during my presentation, the only German car in the parking lot was mine. Lunch was in the “galley” (cafeteria), where my host reached into his pocket to buy my sandwich and fruit cup. This is a company whose products are usually appropriate ways to access a desired asset class.

So it was in character for Vanguard to recently ban leveraged and inverse ETFs from their brokerage platform. Such products have long been criticized because their only plausible use is for extremely brief holding periods of a few days or less. Because of their daily rebalancing, over time compounding drives their value to zero. To visualize this, imagine if you owned a security which rebalanced its risk daily so as to maintain constant market exposure. A 10% down move followed by a 10% up move would leave you down 1%. Time and volatility work against the holder, except for those able to successfully predict the daily fluctuations and time their trades accordingly. Only those seeking profits in a hurry, or trying to temporarily hedge more risk than they’d like, find them attractive. Neither resembles a long-term investor.

Vanguard’s philosophy prevents creating leveraged or inverse ETFs of their own, but now they’ve taken a logical further step to increase the distance between their clients and long term value-destroyers. They correctly noted that such products are, “generally incompatible with a buy-and-hold strategy.”

This is a popular area, with soaring volumes in recent years. It’s another example of the excessive focus on short term market direction. Consumers of financial news want to know where the market’s going today, and media outlets duly respond. But prospectuses routinely warn that leveraged ETFs will probably decline to zero over time, which means the average holder will lose money. On this basis, one might think the SEC would find banning them easily defensible. So far, while individual commissioners have voiced concern, they haven’t moved further. Finance is not short of regulation, and a philosophy that allows consumers to decide appropriateness for themselves allows innovation, and is more right than wrong. However, it works best when the products financial companies offer to their least sophisticated, retail clients are designed with good intentions. Hedge funds and other sophisticated investors can be expected to properly understand how to use leveraged and inverse ETFs – like prescription medication, their availability should be carefully controlled.

We’ve been critics of these products for years (see Are Leveraged ETFs a Legitimate Investment? from 2014 as well as The Folly of Leveraged ETFs and recently FANG Goes Bang).

Leveraged ETF AMJL vs AMZX

In May 2016 Credit Suisse issued a 2X Leveraged ETN linked to the Alerian index. Since then it’s down 55%, while the index is down 12% (including distributions).  Losses are only limited to two times the index over very short periods. This type of long term result is common. It’s unrelated to the index and invariably worse, which Credit Suisse, and Alerian (who allowed their index to be licensed) would have known at the outset. Either name attached to an investment should give the buyer pause. It’s why these products shouldn’t be offered to retail investors.

Energy infrastructure remains one of the most attractively valued sectors around. The American Energy Independence Index yields 6.75%, and we expect dividends to grow 6-7% this year. This is attractive enough for the long-term investor, and isn’t available as a leveraged product.

On Wednesday, January 16th at 1pm Eastern we’ll be hosting a conference call with clients. If you’re interested in joining, please contact your Catalyst wholesaler, or send an e-mail to SL@SL-Advisors.com.

SL Advisors is the sub-advisor to the Catalyst MLP & Infrastructure Fund.  To learn more about the Fund,  please click here.

SL Advisors is also the advisor to an ETF (USAIETF.com).

Are Computers Exploiting MLP Investors?

Energy infrastructure roared higher during the first six trading days of January. After four days, the sector had recovered December’s losses. Two days later, it had almost recouped all of 2018. It was a complete reversal of last month, when slumping equity markets dragged pipeline stocks lower.

It’s looking increasingly likely to us that automated trading strategies relying on complex algorithms (“algos”) are at least part of the reason.

Last year MLPs had already been laboring under the weight of serial distribution cuts. For example, AMLP’s payout is down by 34% since 2014. Incidentally, this must be the worst performing passive ETF in history. Since inception in 2010, it has returned 4% compared to its index of 25%. Its tax-impaired structure is part of the reason (see Uncle Sam Helps You Short AMLP).

For the first nine months of last year, crude oil and energy infrastructure moved independently of one another. Investors who painfully recall the 2014-16 energy sector collapse complained that rising crude prices didn’t help, but as the chart shows, they rallied together in the Spring but parted company in late Summer as the oil market started to anticipate the re-imposition of sanctions on Iran. Crude and pipeline stocks are intermittently correlated, because their economic relationship is weak. Crude sometimes drives sentiment, which can quickly change.

Energy Infrastructure Sometimes In Step with Crude Oil

However, when crude dropped sharply following the Administration’s waivers allowing most Iranian exports to continue, energy infrastructure followed. Pipeline company management teams routinely show very limited cash flow sensitivity to commodity prices, and 3Q18 earnings reported in October/November were largely at or ahead of expectations. Nonetheless, an algorithm incorporating the 2014-16 history would expect MLPs to follow crude when it drops sharply, and would act accordingly. Trading systems bet on falling MLPs following crude, and sold.

In late December crude reversed, and trading systems at a minimum are closing out short pipeline positions if not going the other way. Hence the blistering early January recovery. The fundamentals were good in December, and remained so in January. Any change was imperceptible.

This is conjecture. It’s impossible to obtain hard data to support or refute this theory of market activity. So consider our perspective as a money manager in the energy infrastructure sector, in daily contact with clients and potential investors discussing the outlook. In December, callers were frustrated. The apparent disconnect between fundamentals and stock prices was confusing, troubling. What were they overlooking? What were we missing? Many held, but some didn’t. Frustrated at losses they couldn’t explain, having lost faith with repeated bullish analysis, the sector saw more outflows than inflows. Potential buyers noted compelling values, but usually were dissuaded by continued sector weakness. Unable to comprehend the inability of good financial performance to boost prices, many opted to wait. Tax loss selling towards the end of the year exacerbated.

The turn of the calendar coincided with a modest bounce in crude oil, as reports surfaced that the Saudis were sharply reducing crude exports to the U.S. Current prices are creating for them a substantial fiscal gap.

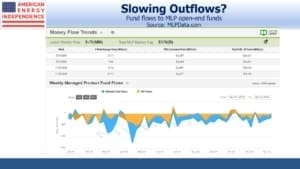
Conversations with clients and prospects have completely turned. Now callers want to know if there will be a pullback. Is the rally for real? Flows have also reversed. One day last week inflows to one of our funds outweighed outflows by 100:1. In December there were no buyers. In early January there are no sellers.

I was prompted to consider events in this light by a recent article in the Financial Times (Volatility: how ‘algos’ changed the rhythm of the market). Philosophically, I’m inclined to believe that automated trading simply does what humans do, just better and more cheaply. However, there is a less benign feature in that algos are also exploiting the inefficiences of humans. Michael Lewis showed this in Flash Boys by examining how high frequency trading systems will see market orders placed and race to snatch the best price before the limit order is executed. This happens in fractions of a second. But humans can also be outwitted over longer periods. December saw the biggest ever monthly outflows from mutual funds, capping an unusual year in which almost every market was down.

There was some bad news. The trade dispute with China is slowing growth there, and S&P500 earnings forecasts are being revised lower. The government is shut down. Fed chairman Powell sounded more hawkish before walking back his comments (see Bond Market Looks Past Fed). But these developments scarcely seem to justify record mutual fund outflows. There have been far worse environments for stocks.

Hedge fund veteran Stanley Druckenmiller said, “These ‘algos’ have taken all the rhythm out of the market, and have become extremely confusing to me.” Philip Jabre closed his eponymous hedge fund, complaining, “…the market itself is becoming more difficult to anticipate as traditional participants are imperceptibly replaced by computerized models.”

The Financial Times quoted a senior JPMorgan strategist as saying that, “…we just have to accept that equity markets are almost fully automated.” JPMorgan estimates that only 10% of trading is generated by humans.

The Wall Street Journal reported that trend-following trading systems shifted “…from bullish to bearish to a degree not seen in a decade, according to an analysis of algorithms that buy or sell based on asset-price momentum.”

The WSJ also blamed volatility in commodity markets on computerized trading, citing a report that “…Goldman Sachs attributed the recent volatility to algorithmic traders exerting more influence in the oil market.”

The growth in algorithmic trading seems to be coinciding with a drop in discretionary trading by humans, which probably reflects that computers are beating humans in certain areas.

On one level, algos are designed to exploit human frailties by anticipating them. Perhaps they even cause them. It seems many people had little reason to sell in December beyond fear of losing money. Successful algos by definition attract capital, increasing their ability to move markets and hunt for more inefficiencies. Humans, at least those who adjust their positions too frequently, are becoming prey. One result could have been systematic shorting of pipeline stocks in response to crude’s sharp drop, because it worked in 2014-15. Sector weakness certainly couldn’t be traced back to recent earnings reports. Investors who sold during this time because they tired of losing money added to the downward pressure, reinforcing the trend. This would also have provided confirmation to the algorithms that the signal worked.

Since computerized trading isn’t going away, survival for the rest of us lies in being less sensitive to market moves. Examining fundamentals and staying with a carefully considered strategy that doesn’t rely on the market for constant confirmation of its correctness is the human response to algos.

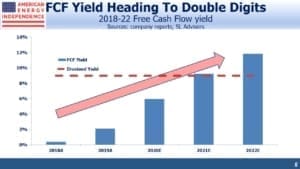
Energy infrastructure remains attractively valued. Free cash flow yields before growth capex (i.e. Distributable Cash Flow) are over 11%. We estimate dividends will grow on the broadly based American Energy Independence Index this year by mid to high single digits. The long term outlook for the sector remains very good.

We are short AMLP.

SL Advisors is the sub-advisor to the Catalyst MLP & Infrastructure Fund.  To learn more about the Fund,  please click here.

SL Advisors is also the advisor to an ETF (USAIETF.com).

2018 Lessons From The Pipeline Sector

Blog pageviews and comments help us gauge how relevant our topics are. Writing is more enjoyable when readers engage. This blog gets reposted across many websites, including Seeking Alpha and Forbes.com. The feedback from subscribers often leads to a useful dialog and informs later choice of topics. Below are the themes that resonated in 2018.

The name Rich Kinder strikes a raw nerve with many. Kinder Morgan: Still Paying For Broken Promises revealed the depth of feeling among many investors. This is because Kinder Morgan (KMI) began the trend towards “simplification”, which came to mean distribution cuts and an adverse tax outcome. To get a sense of the betrayal felt by some, peruse the comments on the blog post on Seeking Alpha where readers can let rip in a mostly un-moderated forum. It becomes clear that cutting payouts has severely damaged appetite for the sector, something we realized through this type of feedback.

KMI Promises Made Promises Kept

A similar post examined how Energy Transfer (ET) had lowered payouts for certain classes of investor, (see Energy Transfer: Cutting Your Payout Not Mine) and drew an even bigger response (272 comments). ET CEO Kelcy Warren is a controversial figure. Our post showed that while original Energy Transfer Equity investors had avoided distribution cuts, holders of Energy Transfer Partners, Sunoco Logistics and Regency Partners hadn’t fared so well.

ETEs Distributions Climb While its Affiliate MLPs Decline

Kelcy Warren inspired our most colorful graphic in August, when he said, “A monkey could make money in this business right now.” (see Running Pipelines Is Easy). ET’s stock has lost a quarter of its value since then, even though their financial performance has justified his comments.

Last year was a testing one for those convinced the Shale Revolution should generate investment profits. In Valuing MLPs Privately; Enterprise Products Partners we laid out how a private equity investor might value the biggest publicly traded MLP. It wasn’t controversial, but many readers communicated their appreciation at this type of analysis.

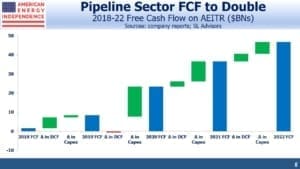
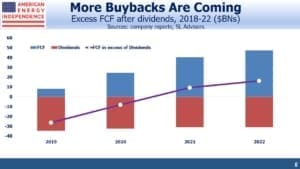
The problem for the sector has always been balancing high cash distributions with financing growth projects. We think current valuations focus too much on Free Cash Flow (FCF) without giving credit to Distributable Cash Flow (DCF). FCF is after growth capex, while DCF is before. We illustrated this with a short video (see Valuing Pipelines Like Real Estate).

Early in the year we wrote several blog posts highlighting the tax drag faced by most MLP-dedicated funds. Because they pay Federal corporate taxes on investment profits, 2018’s bear market didn’t expose their flawed structure the way a bull market will. We won’t repeat the argument here, but it’s laid out in MLP Funds Made for Uncle Sam.

A related topic we covered several times was the conundrum facing MLP-only funds, given that many big MLPs have converted to regular corporations. MLP-only funds can no longer claim to provide broad sector exposure, since they omit most of the biggest North American pipeline companies. But the funds themselves can’t easily broaden their holdings beyond MLPs, which creates some uncertainty for their investors. We explained why in Are MLPs Going Away? and The Alerian Problem.

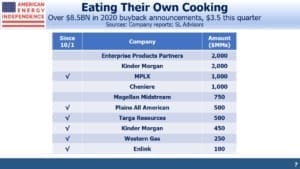
We returned to the tension between using cash for growth versus distributions in Buybacks: Why Pipeline Companies Should Invest in Themselves. The industry continues to reinvest more cash in new infrastructure than is justified by stock prices. In many cases, share repurchases offer a better and more certain return than a new pipeline. Trade journals are full of breathless commentary on the need for more export facilities, more pipelines, more everything. It’s not pleasant reading for an investor, but this is the world inhabited by industry executives. More mention of IRR would be welcome. Pipeline investors are hoping that the Wells Fargo chart showing lower capex in the future will, finally, be accurate.

Midstream Industry Forecasts Peak in CAPEX

Fortunately, there are signs of better financial discipline. Leverage continues to drop and dividend coverage is improving, which will support a 6-8% increase in dividends on the American Energy Independence Index in 2019. As the year unfolds, we expect investors to cheer a long overdue improvement in returns.

We are invested in ET and KMI.

SL Advisors is the sub-advisor to the Catalyst MLP & Infrastructure Fund.  To learn more about the Fund,  please click here.

SL Advisors is also the advisor to an ETF (USAIETF.com).

Income Investors Should Return to Pipelines in 2019

MLPs have become more attractively priced compared with other income-oriented sectors. One way to see this is to compare the trailing four quarter yield. REITs and utilities have remained within a fairly narrow range, while MLPs rose sharply during the 2014-15 oil collapse. After a partial recovery, weakness over the past year or so has caused MLP yields to drift higher again.

MLP Yields on the Rise


For many years prior to the 2014 sector peak, MLP yields were around 2% above utilities. Currently, they’re around 5% wider. This ought to attract crossover buying from income-seeking investors, switching their utility exposure for MLPs, but so far there’s limited evidence of this happening. Although the yield advantage over REITs isn’t quite as dramatic, the same relative value switch exists there too.


The broad energy sector has remained out of favor. MLPs used to track utilities and REITs fairly closely until 2014 when they followed energy lower. However, even compared with energy, midstream infrastructure remains historically cheap. Research from Credit Suisse shows that on an Enterprise Value/EBITDA basis, pipelines are the cheapest vs the S&P energy sector they’ve been since 2010.

Midstream Cheap vs Historical Valuation

The Shale Revolution has challenged the MLP model in ways that few anticipated. Increasing U.S. output of crude oil, natural gas liquids and natural gas is creating substantial benefits for the U.S. Improved terms of trade, greater geopolitical flexibility and reduced CO2 emissions underpin America’s greater willingness to buck the global consensus. However, investors are still waiting for the financial benefits. This is partly because the capital investments required have demanded more cash. E&P companies had to fund investments in new production, which drew criticism that they were over-spending on growth. Similarly, MLPs pursued many opportunities to add infrastructure for transportation, processing and storage in support of new production. All this left less cash to be returned to investors through buybacks and dividends. It remains the biggest impediment to improved returns.


Unlike MLPs, both utilities and REITs have both been increasing dividends. Even the energy sector has raised payouts, although this was achieved in part through less spent on stock buybacks, which has led their investor base to insist on improved financial discipline. MLPs have both increased cash flows and lowered distributions.  Oil & gas executives seem unable to turn down a growth project.

By contrast with the income sectors with which MLPs used to compete, they have been lowering dividends. This makes yield comparisons less reliable, and likely explains why there’s been little evidence of shifts away from lower-yielding, traditional income sectors.

It’s why the biggest pipeline companies have dropped the MLP structure in favor of becoming corporations, so as to access the broadest possible set of investors. However, that hasn’t always worked out either, as the history of prior distribution cuts continues to weigh on sentiment. Williams Companies (WMB) is an example of a corporation that combined with its MLP, Williams Partners (WPZ). WMB CEO Alan Armstrong claims to be puzzled by persistent stock weakness. Meanwhile, legacy WPZ investors well recall the multiple distribution cuts they endured along the way (see Pipeline Dividends Are Heading Up).

In our experience, one of the issues that makes current investors nervous and gives new ones pause is that they don’t understand the continued weakness when volumes are up and management teams bullish. In December most sectors were down sharply, and global growth concerns depressed the energy sector along with most others. But for most of 2018 and certainly the second half, the disconnect between strong operating performance and poor security returns has perplexed many.

We’ve sought to explain this, and regular readers will know we’ve concluded that reduced distributions are the most important factor. The investor base was originally drawn for stable income, which in recent years MLPs have failed to provide. The Shale Revolution, perversely, has so far been a lousy investment theme even while it’s been terrific for America.  The charts in this blog post present a narrative now familiar to many.

Next year we expect rising dividends for the companies in the American Energy Independence Index to draw increasingly favorable attention to the sector. Although the MLP model no longer suits most of the biggest operators in the industry, midstream energy infrastructure offers compelling value. The best way to participate is by investing in the biggest companies, which are mostly corporations but do include a few MLPs. When the sector begins its recovery, it’ll start from far below fair value.

We are invested in WMB.

SL Advisors is the sub-advisor to the Catalyst MLP & Infrastructure Fund.  To learn more about the Fund,  please click here.

SL Advisors is also the advisor to an ETF (USAIETF.com).

Pipeline Dividends Are Heading Up

For investors who seek despondent sellers, look no further than energy infrastructure in late 2018. The Alerian MLP Index made its all-time high way back in August 2014. It currently sits 43% lower (including dividends). Barring a strong recovery in the last days of December, returns for three of the past four years are negative. Not coincidentally, MLP distributions are down for their fourth straight year. The Alerian MLP ETF (AMLP) has cut payouts by 34%, with its most recent one last month. Investors don’t want dividend cuts, they want dividend hikes – and in 2019 they will see them.

The shift of MLP Distributable Cash Flow (DCF) from distributions to funding growth projects has been well documented (see Will MLP Distribution Cuts Pay Off?). Growth capex (i.e. where that money went) dipped in 2016 but has been robust since then. Valuations continue to be more reflective of Free Cash Flow (FCF), which is after capex, whereas we think DCF (before capex) is more relevant (see Valuing Pipelines Like Real Estate). But investors are skeptical that cash formerly paid out is being well spent, and resentful of the dozens of cuts. Rising payouts should help.

Pipeline company earnings calls are full of positive reports with optimistic guidance. Business has rarely been this good. In August, Energy Transfer (ET) CEO Kelcy Warren memorably said, “A monkey could make money in this business right now.” (see Running Pipelines is Easy). Business conditions have only improved since then. In November, ET reported another strong quarter, beating Street estimates of EBITDA by 11%. Yet ET’s stock slumped, and is down 33% from its late July “business is easy” level, even though that description seems accurate.

No other metric explains sector performance as well as the path of dividends (or distributions for MLPs).

WMB Quarterly Distributions

It’s rare for an industry to cut dividends when profits are growing, but that’s exactly what this sector has done. Falling dividends are so often associated with poor operating performance that investors reasonably equate the two – especially yield investors. Pipeline management teams consistently report on terrific business conditions and lament their stock’s low valuation. Part of the reason is that management teams too often invest in new projects rather than buying back stock. Buybacks with DCF yields of 14% and higher must surely be more compelling (and less risky) than all but the most attractive new investments. It’s no wonder investors question their judgement.  Williams Companies (WMB) CEO Alan Armstrong recently said, “I don’t recall a time in my years in executive management when the business has been this healthy but the equity markets so poorly reflecting that.”

While business is booming and valuations are very attractive, Alan Armstrong and others still fail to appreciate (or at least don’t acknowledge) the crushing effect dividend cuts have had on investor appetite for their stocks. No other explanation fits the facts as well. Some blamed crude oil for the 2014-16 collapse, but MLPs only modestly participated in the subsequent crude rally. Recently we read an analysis that attributed stock weakness to rising leverage, but leverage peaked in 2016 at around 5.5X Debt/EBITDA and is comfortably heading lower. We estimate that our portfolio companies’ will exit next year at 4.1X, comfortably within the range that prevailed before the 2014 MLP market peak.

EBITDA vs Leverage

For almost a decade, Williams Partners (WPZ) investors were trained to expect gently rising distributions that came with a tax deferral and a K-1. This happy arrangement was abandoned when Shale Revolution growth opportunities presented themselves. The first cut came when WPZ combined with Access Midstream (ACMP), formerly Chesapeake’s midstream business before it was spun out. WPZ adopted the lower, ACMP payout which resulted in an effective cut for legacy WPZ holders. Two years later, partly due to concerns about leverage, WPZ imposed a second outright cut. The final one came when WPZ was folded into Williams Companies (WMB), in a “simplification”. WMB’s lower payout was applied to WPZ holders, along with a tax bill on recaptured income.

Long-time WPZ investors have endured a 53% cut in their payouts, which are back to the levels of 2006. Having been taught to focus on distributions and ignore market gyrations, they must find Alan Armstrong’s upbeat comments incongruous if not insulting.

Nonetheless, Alan Armstrong is right that business is good. It’s just that he and his peers have so mistreated their investors that his enthusiasm is less infectious than he might like.

A useful perspective on valuations is to compare pipeline companies’ current EV/EBITDA premium to the energy sector versus its long term average. Even by the unloved standards of the energy sector, midstream infrastructure is historically undervalued.

Midstream Stocks Undervalued

The American Energy Independence Index (AEITR) includes North America’s biggest pipeline companies, and is 20% weighted to MLPs. Dividends paid by corporations have been more reliable than MLPs; 2018 dividends on the index are up 7%, following a 3% increase last year. By contrast, dividends on the Alerian MLP and Infrastructure Index, as represented by its index fund AMLP, are down 6% following a 16% drop in 2017. Since MLP payouts are a bigger portion of their available cash flow, they had farther to fall. But the limited investor base (largely U.S. individual investors) has inhibited their flexibility in managing cash.

As a result, many large MLPs have converted to corporations, so an MLP-only view of energy infrastructure (as with the Alerian MLP Index for example), fails to fully represent the sector. Moreover, MLP investors invest for income, which has made them an unreliable source of capital when their income is being cut.

In 2019 we expect AEITR dividends to grow high single digits. MLP distributions should also begin growing for the first time since 2014, although not by as much. Corporations generally offer faster, more reliable growth.

We wish all of our readers a Happy Christmas and holiday season. Enjoy the time with family, and we’ll all look forward to a rebound in 2019.

We are invested in ET and WMB. We are short AMLP.

SL Advisors is the sub-advisor to the Catalyst MLP & Infrastructure Fund.  To learn more about the Fund,  please click here.

SL Advisors is also the advisor to an ETF (USAIETF.com).


Buybacks: Why Pipeline Companies Should Invest in Themselves

Weakness in the pipeline sector over the past couple of years has caused soul-searching and changes to corporate structure. Incentive Distribution Rights (IDRs), which syphon off a portion of an MLP’s Distributable Cash Flow (DCF) to the General Partner (GP) running it, have largely gone. Many of the biggest MLPs have abandoned the structure entirely, leaving its narrow set of income-seeking investors to become corporations open to global institutions.

The debate among investors, management and Wall Street about how to unlock value received some useful ideas recently from Wells Fargo. In a presentation titled The Midstream Conundrum…And Ideas For How To Fix It, they make a persuasive case that stock buybacks offer a more attractive use of investment capital than new projects.

This would be a significant shift for MLPs. As recently as five years ago, they paid out 90% or more of their DCF to unitholders and GP (if they had one). The Shale Revolution was only beginning to demand substantial new infrastructure, so they had little else to do with their cash. New projects were funded by borrowing and by issuing equity through secondary offerings.

Shale plays were in regions, such as the Bakken in North Dakota and the Marcellus in Pennsylvania/Ohio, inadequately serviced by pipelines. This broke the model, because the amounts of investment capital required grew substantially. The capital markets loop of paying generous distributions while simultaneously retrieving much of the cash through new debt and equity was no longer sustainable. Dozens of distribution cuts and lower leverage followed, leading to projects being internally financed. This is the new gold standard for the sector – reliance on external capital to fund growth is out.

Wells Fargo takes this logic a step further, asking why excess cash always needs to be reinvested back in the business rather than returned to investors via buybacks. In spite of professed financial discipline, midstream management teams invariably find new things to build, all expected to be accretive (i.e. return more than their cost of capital). Pipeline companies are not alone – the entire energy sector has been dragged by investors to prioritize cash returns over growth. But MLPs rarely buy back stock. Free of a corporate tax liability, MLP distributions aren’t subject to the double taxation of corporate dividends, so raising payouts is a simple way to return cash.

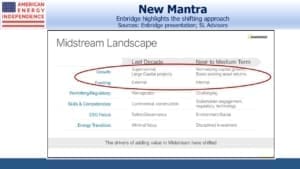
The Midstream Story over the past several years has largely been about financing growth projects. Investor payouts were sacrificed, but rarely did a company admit that its internal cost of capital was too high to justify a new initiative. Wells Fargo is challenging management teams to regard buying back their own stock as a more attractive use of capital than building or acquiring new assets. This is capital management 101 for most industries, but unfamiliar terrain for pipeline stocks. Growth is embedded in the culture. The original justification for the GP/MLP structure with IDRs was to incent management to grow the business. CEOs in other industries find the motivation without such complexity.

In October, virtually every 3Q18 earnings call included an optimistic outlook from management, usually coupled with disbelief at the continued undervaluation of their stock. Attractive valuations mean a high internal cost of capital. Valued by DCF, or Free Cash Flow (FCF) before growth capex, midstream yields are in some cases higher than many companies’ stated Return on Invested Capital (ROIC) targets. Moreover, historic ROIC for the industry has often turned out lower than promised, although it has been improving.

Energy Transfer’s (ET) 16% DCF yield almost certainly offers a higher return than all but their best projects, and suggests they should be repurchasing stock. SemGroup’s (SEMG) DCF is 20%, twice the industry’s historic ROIC.

Growth caused the past four  years’ upheaval, and today’s low valuations are the result. Capital discipline has been less present than CEOs often claim, which is why they’ve apparently responded coolly to Wells Fargo’s buyback recommendation.

DCF yields of 10-14%  or more (as with ET’s 16%) are dramatically higher than FCF yields of 3%, because DCF measures cash generated before funding for growth projects while FCF is after.  FCF yields are set to rise sharply over the next few years, but this crucially relies on new investment coming down. The industry has a habit of showing that peak spending on new projects is imminent, only to push that back another year. 3Q earnings calls saw 2019 estimated capex creep up by almost 20%.

Midstream Industry Forecasts Peak in CAPEX

2018 is the fourth year of distribution cuts for MLPs, as reflected in the Alerian MLP ETF (AMLP). Corporations have fared better, and next year we expect dividends on the American Energy Independence Index to grow by 8-9%. If midstream companies are as financially disciplined as they claim, they’ll follow the advice from Wells Fargo in evaluating stock buybacks alongside new investments under consideration. It would complete their metamorphosis into more conventional companies.


We are invested in ET and SEMG.

We are short AMLP.

SL Advisors is the sub-advisor to the Catalyst MLP & Infrastructure Fund.  To learn more about the Fund,  please click here.

SL Advisors is also the advisor to an ETF (USAIETF.com).

Environmental Activists Raise Values on Existing Pipelines

Canada’s struggles to get its crude oil to market have been a source of immense frustration if you’re an Albertan oil producer, or a huge success if you’re an anti-fossil fuels activist. Last week, Alberta’s premier Rachel Notley imposed almost a 9% cut in production in order to raise prices. Shortage of available infrastructure had opened up a price discount as wide as $50 per barrel between the bitumen-based Western Canadian Sedimentary Basin, and the WTI benchmark. Unusually, it led to Canadian producers asking the government to intervene.

The heavy, viscous crude from Canada’s oil-sands is reviled by activists because its extraction is particularly disruptive to the local environment, as well as requiring substantial energy inputs to heat it. The Obama Administration repeatedly held up the Keystone XL expansion because of its view that this type of crude should remain in the ground. Alberta has been frustrated at every turn in obtaining cost-effective transport for its output. Earlier this year, Kinder Morgan (KMI) gave up on their Trans Mountain Expansion, intended to increase pipeline capacity west to British Columbia’s Pacific coast. Navigating inter-provincial politics threatened to derail the project, and KMI managed to unload it on the Canadian Federal government not long before an adverse court ruling added further delays (see Canada’s Failing Energy Strategy).

Canada has unique challenges, revealing the weak hand their Federal government has in dealing with its sometimes unruly provinces. But pipeline construction has been hampered in the U.S. too. Energy Transfer’s (ET) Dakota Access Pipeline (DAPL) was delayed by Obama because of concerns over its proximity to land held sacred by some native American tribes (others were supportive, generally depending on the likelihood of financial gain through the use of their land). Shortly after his inauguration Trump allowed DAPL to move forward. But ET has at times run afoul of regulators during construction, drawing hundreds of violations during the construction of two natural gas pipelines. The industry needs ET to do better.

Shortages of infrastructure in west Texas have led to flaring of natural gas as well as impeding the growth of crude production. The completion of new pipelines by late 2019 should help. The Energy Information Administration expects Permian output to grow by 600 thousand barrels per day next year, to 3.9 Million Barrels per Day (MMB/D). The new pipeline takeaway capacity could enable it to reach 5 MMB/D by 2020, bringing U.S. output close to 13 MMB/D.

New England suffers from too little investment in natural gas infrastructure, with the result that during cold winter months they import liquefied natural gas from Trinidad and Tobago (see An Expensive, Greenish Strategy).

In many parts of the country (apart from Texas and Louisiana), energy infrastructure is becoming steadily harder to build. The losers clearly include consumers, such as those in the north east who have to pay more for electricity. In Canada, clearly oil producers suffer from the steep discount on their production. But less growth in infrastructure increases the value of what currently exists. Because Permian crude can’t all get to its desired destination (usually Cushing, OK or Houston for refining/export) by pipeline, the price differential has at times exceeded $15 per barrel. Regional differentials can support pipeline profits, since when they exceed pipeline tariffs it reflects high demand. Plains All American (PAGP) has been able to charge higher prices on parts of its crude oil pipeline network in Texas for just this reason.

New pipelines enjoy network effects. Connecting a new pipeline to an existing network adds value by increasing destination choices for shippers. This has always represented a hurdle for new entrants to surmount. But the increasing role of judicial challenges by environmental activists serves to further entrench existing operators. The pipeline business is one in which companies needn’t worry too much about a disruptive new upstart taking market share. As a result, today’s big energy infrastructure companies are highly likely to be dominant for many years to come. If new pipelines are harder to build, existing pipelines must be correspondingly more valuable. An unintended consequence of pipeline opposition is to develop a pipeline oligopoly.

Last week Enterprise Products Partners (EPD) gave a presentation at a Wells Fargo conference which emphasized corporate (rather than MLP) measures of performance. By referencing more familiar terms, such as Cash Flow From Operations, rather than the MLP-oriented Distributable Cash Flow, they hope to draw more generalist investors to consider valuations, even while EPD has no plans to convert from an MLP to a corporation. We think it’s a good move – we recently highlighted EPD’s value using discounted cash flows (see Valuing MLPs Privately — Enterprise Products Partners). We also compared pipelines with buildings (see Valuing Pipelines Like Real Estate). A consistent theme from management teams is the disconnect between the strong fundamentals of their businesses and weak stock prices.
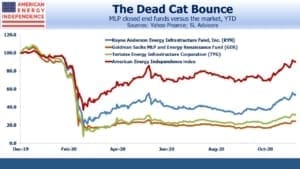
Retail sentiment remains poor. Our friend John Cole Scott of Closed End Fund Advisors notes that discounts to NAV on MLP closed end funds are at 8%, more than twice the three year average and 10% wider than the best levels of last spring.

In the Britcom Fawlty Towers, the manic hotel manager Basil Fawlty (played by Monty Python’s John Cleese) is told during one crisis, “…to remember there’s always somebody worse off than yourself.” To which he replies, “Well I’d like to meet him, I could do with a laugh.” (see here at the 1:25 mark).

In that vein, pipeline investors who nowadays believe they’re in the world’s least loved sector should spare a thought for energy services, which have recently exceeded the lows of the 2008-09 financial crisis.

For energy infrastructure investors, we think rising dividends will finally put to rest the concern over serial cuts in payouts.  The American Energy Independence Index contains North America’s biggest pipeline companies, which are mostly corporations but include a few MLPs. It yields 6.25%, and we expect 7-8% dividend growth next year.

We are invested in EPD, ET, KMI and PAGP

SL Advisors is the sub-advisor to the Catalyst MLP & Infrastructure Fund.  To learn more about the Fund,  please click here.

SL Advisors is also the advisor to an ETF (USAIETF.com).

MLPs Lose That Christmas Spirit

Around this time of the year we typically write about MLP seasonals. That’s because the “January effect” has been an enduring pattern of investor activity, far more pronounced than in the broader equity market. Prices would reliably dip in November before firming in December and shooting higher in January. This was due to the combination of income-seeking individual investors with K-1s. Because of the additional tax preparation costs, if you’re planning to sell an MLP in January, you might as well act in December and avoid one more K-1. Similarly, a December purchase delayed until January also avoids a K-1.

MLPs Exhibit Seasonal Pattern

Quite possibly, the natural inclination to take stock of life, including investments, around the holiday season resulted in a decision to allocate cash to MLPs. Two years ago, in Give Your Loved One an MLP This Holiday Season, we noted the historic pattern and why purchasing MLPs in early December had worked so consistently.

Although the year-end pattern was most pronounced, there’s also an intra-quarter one. MLP investors love their income. Distributions tend to be declared in the first month of the quarter, payable a few weeks later. Sellers tend to hang on long enough to be a holder of record for the quarter, creating the Jan/Apr/Jul/Oct cycle of positive months.

Much has changed over the past five years. MLPs can no longer be relied upon for steady income. The Alerian MLP ETF (AMLP) recently cut its distribution again, resulting in a 34% cumulative reduction since 2014. Not only did some MLPs with high yields cut their dividends outright to fund growth projects and reduce leverage, but many were purchased by their much lower yielding parent companies, providing “backdoor” distribution cuts to MLP. The consequent betrayal of income-seeking investors has had many casualties, including still-depressed sentiment oblivious to attractive valuations.

Another change has been the breakdown of the seasonal pattern. Having been mistreated, income-seeking investors no longer act so predictably. Over the past five years the January effect has completely gone. So has the quarterly pattern – years ago, when the sector was stable and fairly unexciting, holding your investment a few more weeks so as to get that extra distribution wasn’t inordinately risky. MLP investors have learned to appreciate risk differently, and it’s clear that the calendar bears very little on the timing of today’s buyers and sellers. What’s striking about the past five years is both the randomness of the monthly returns, as well as that the average month is -0.3%. From 1996-2013 it was +1%.

MLP Seasonal Pattern Has Gone

The loss of the seasonal pattern is further evidence that the traditional investor, with her predictable habits developed over years of happy results, has left. It’s why the sector is cheap, because the former buyers have fallen out of love. Thus spurned, large MLPs have converted to corporations in search of new suitors, such that less than half of U.S. midstream infrastructure now retains the MLP format. Many believe the MLP model is irretrievably broken.

Eventually, and possibly quite soon, rising dividends will draw in a new set of buyers. They’ll buy corporations that were formerly MLPs, as well as some of the remaining MLPs. They’ll rely on discounted cash flow analysis (see Valuing MLPs Privately — Enterprise Products Partners). They’ll look beyond the betrayals (see Kinder Morgan: Still Paying for Broken Promises). They’ll find a sector with 11% free cash flow yields before financing new projects, and dividend yields of 6%+ growing at 10% (our 2019 forecast for the American Energy Independence Index).

We are long EPD and KMI. We are short AMLP.

SL Advisors is the sub-advisor to the Catalyst MLP & Infrastructure Fund.  To learn more about the Fund,  please click here.

SL Advisors is also the advisor to an ETF (USAIETF.com).

Energy Transfer: Cutting Your Payout, Not Mine

Too few writers covering energy infrastructure admit to the many distribution cuts inflicted on MLP holders. Instead, they identify numerous other problems whose resolution will draw in buyers. Incentive Distribution Rights (IDRs), the payments made by MLPs to their General Partners (GP), have drawn scorn for the past couple of years. Eliminating them is fashionable and now virtually complete, with only a handful of holdouts. Other solutions include self-funding growth projects. Common practice was for MLPs to pay out most of their cash and raise equity for new projects. It worked until the new projects became big. The Shale Revolution was responsible for that. Selling non-core assets is another piece of advice – it’s rarely controversial. Few companies admit that any assets are non-core, until selling them.

All this free advice is directed both publicly and privately to help draw in new investors and lift stock prices. What’s rarely mentioned are the widespread and substantial cuts in distributions that have alienated the income-seeking MLP investor base. Alerian has a chart showing “AMZ Normalized Distributions Paid”, which shows a cumulative 25% cut 2015-17, if you do the math. Dividends on AMLP are down 34% from their high in 2014, although you won’t find this on their website. Promises have been broken, and the buyers know this.

One reason others don’t dwell too much on this issue is that many distribution cuts have been via mergers and simplifications. When a lower yielding GP acquires its MLP, the MLP investors are subjected to a “backdoor” distribution cut through owning a new security with a lower yield than the one they gave up.

ETEs Distributions Climb While its Affiliate MLPs Decline

Energy Transfer has excelled at imposing such “stealth distribution cuts”. Over the past four years they’ve rolled four publicly traded entities into one. In each case, the lower-yielding entity acquired the higher-yielding one, resulting in a lower distribution for investors in the acquiree.

What’s striking is to overlay the normalized distribution history of the four entities: Energy Transfer Equity (ETE), Energy Transfer Partners (ETP), Sunoco Logistics (SXL) and Regency Partners (RGP). ETE is the surviving entity, now renamed Energy Transfer (ET).

ETE investors have seen a five-fold increase in distributions since 2006, a 13% compounded annual growth rate. They’ve increased distributions every year.  That shouldn’t be surprising, because ETE was always the vehicle of choice for CEO Kelcy Warren and the management team. SXL holders had a good run – in 2016 they folded in higher-yielding ETP but retained the ETP name, which gave them a 14% distribution growth rate to that point. But then they were “Kelcy’d”, as ETP adopted ETE’s lower payout in a subsequent combination, leading to a 31% effective cut. Original investors in ETP and RGP did worse.

ET’s price peaked in 2015 (it was ETE back then), when Kelcy embarked on his ultimately unsuccessful attempt to buy Williams Companies (WMB). It’s a measure of how far sentiment has fallen, in that ETE’s yield briefly dipped below 3% in May 2015. Since then, its distribution has risen from $1.02 to $1.22. They dodged the WMB deal, have reduced leverage, completed the Dakota Access Pipeline and expect to cover their distribution by 1.7-1.9X next year. Nonetheless, today ET yields 8.5%, with an estimated 2019 Distributable Cash Flow yield of 15.9%. No wonder Kelcy Warren is back in buying the stock.

It’s true that ET’s management has earned a reputation for self-dealing. During the protracted WMB merger negotiations , ETE issued very attractive convertible preferred securities to the senior executives, but didn’t make them available to other ETE investors (see Will Energy Transfer Act with Integrity?). Although they won the resulting class action lawsuit, it’s clear that if management can get away with something that benefits them but not shareholders, they will. Even so, the current valuation seems excessively pessimistic.

Kinder Morgan (KMI) and Plains All American (PAGP) drew unwelcome attention for each delivering two distribution cuts to their investors. KMI’s first cut was through combining with their MLP in the technique later used by ETE. They followed this up with a second, unambiguous cut in response to rating agency concerns over leverage.  PAGP’s management administered two direct cuts, stunning investors both times. Oneok (OKE), Targa (TRGP), Semgroup (SEMG), and Enlink (ENLC) all folded in their respective MLPs, delivering backdoor distribution cuts to their MLP holders but maintaining their dividends at the GP level.  But many others avoided cutting their dividends at all.  Antero Midstream (AMGP), Tallgrass (TGE) and Western Gas (WGP) all rolled up their MLPs with no change in payouts.

None of the Canadian midstream companies cut their dividends, reflecting their more conservative approach. This highlights that the distribution cuts were due to the flawed MLP practice of paying out virtually all available cash flow, relying on tapping the capital markets for growth projects. There were a few exceptions, but in general MLP distribution cuts were not due to deteriorating fundamentals in the midstream sector.

MLPs are still cutting payouts. Distributions on AMLP, which is MLP-only and tracks the Alerian MLP Infrastructure Index, are down 6.9% this year. By contrast, distributions on the American Energy Independence Index, which includes the biggest North American pipeline corporations and MLPs and is therefore more representative of the overall sector, are up 6.6%.

We are invested in AMGP, ENLC, ET, KMI, OKE, PAGP, SEMG, TGE, TRGP, WGP and WMB. We are short AMLP.

SL Advisors is the sub-advisor to the Catalyst MLP & Infrastructure Fund.  To learn more about the Fund,  please click here.

SL Advisors is also the advisor to an ETF (USAIETF.com).

Oil and Gas Take Center Stage

If pipeline stocks moved with natural gas rather than crude oil, their long-suffering investors could look back on a good week. On Tuesday crude was down $5 per barrel for the week, before recovering $2 by Friday. It’s tumbled $20 since early October, bringing Brent Jan ’19 to $66. By contrast, the Jan ’19 natural gas contract stormed out of its $2.90 to $3.50 per Thousand Cubic Feet (MCF) range that has constrained it all year, almost reaching $5 on Wednesday. Rarely have oil and gas been so disconnected.

Crude Oil Prices Suffer Heavy Losses

The energy sector moves to the rhythm of crude. It’s is a global commodity, relatively easy to transport, which allows regional price discrepancies to be arbitraged away. Oil can move by ship, pipeline, rail or truck. Transportation costs vary from a few dollars per barrel for pipeline tariffs or waterborne vessel to $20 or more by truck. Although Canada’s dysfunctional approach to oil pipelines has led to deeply depressed prices, in most cases transport costs are a portion of the cost of a barrel.

By contrast, natural gas (specifically methane, which is used by power plants and for residential heating and cooking) generally only moves through pipelines or on specially designed LNG tankers in near-liquid form. Long-distance truck transportation isn’t common because liquefying methane to 1/600th of its gaseous volume requires thick-walled steel tanks. Methane moved as Compressed Natural Gas (CNG) is only 1% of its normal volume (i.e. requires 6X more storage volume than LNG) which generally renders long-haul truck transport uneconomic. LNG shipping rates from the U.S. to Asia are $5 or more per MCF, more than the commodity itself. The 10-15,000 mile sea journey is worth it because prices in Asia are $8-15 per MCF, compared with normally around $3 per MCF in the U.S.

Natural Gas Transport

The result is that natural gas prices vary by region far more than crude oil.

There are price discrepancies within the U.S. too. The benchmark for U.S. natural gas futures is at the Henry Hub, located in Erath, LA. This is where buyers of $5 per MCF January natural gas can expect to take delivery. By contrast, 700 miles west in the West Texas Permian basin, natural gas is flared because there isn’t the infrastructure to capture it. Gas is flared because it’s worthless. Mexican demand is coming, but construction south of the border is running more slowly than expected.

The price dislocation in U.S. natural gas highlights the ongoing need for additional pipeline and storage infrastructure. Price differences in excess of the cost of pipeline transport translate into pipeline demand. Although the spike in Jan ’19 natural gas futures reflects a temporary supply shortage that can’t be alleviated by a new pipeline given multi-year construction times, such events are generally good for  midstream energy infrastructure businesses.

The oil price dislocation was at least partly due to hedging of option exposure by Wall Street banks that had sold put options to producers, such as Mexico. It has very little to do with midstream infrastructure. Having fretted for months over U.S.-imposed sanctions on Iran, the market was surprised by waivers that are softening the blow for Iran’s oil customers. It’s likely to create a reaction (see Crude’s Drop Makes Higher Prices Likely).

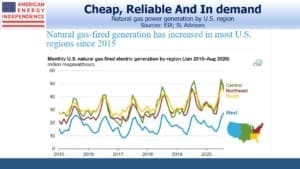
Long term forecasts of natural gas demand are less varied than for crude oil, and are driven by Asian consumption at the expense of coal for electricity production.  Crude oil demand forecasts vary more, generally because of differing expectations for electric vehicle sales. Although both are growing, a bet on natural gas looks the safer of the two.

Nonetheless, crude oil moves the energy sector and U.S. pipeline stocks tag along. On Tuesday when crude oil was -6.6%, the S&P Energy ETF (XLE) and Williams Companies (WMB) both slid 2.3%. Jan ’19 natural gas was +9.1%. WMB derives virtually all its value from transporting and processing natural gas and natural gas liquids. Its inclusion in XLE probably causes it to move with the sector more than its business would suggest.

3Q18 earnings for pipeline companies have been largely equal to or better than expectations. The fundamentals remain strong – investors continue to ask when sector performance will reflect this. Although the recently declared dividend on the Alerian MLP ETF (AMLP) is 34% below its 2014 level, we expect corporations will start increasing dividends, with the American Energy Independence Index likely to experience 10% growth in 2019.

We are long WMB and short AMLP.

SL Advisors is the sub-advisor to the Catalyst MLP & Infrastructure Fund.  To learn more about the Fund,  please click here.

SL Advisors is also the advisor to an ETF (USAIETF.com).

image_pdfimage_print