Kinder Morgan’s Slick Numeracy
A Chief Financial Officer needs to know her way around a financial statement. Presenting operating performance in the best possible light is a highly valuable skill. We watched Kinder Morgan’s (KMI) Analyst Day last week via webcast, and my admiration is split between (1) KMI President and former CFO Kim Dang’s deft maneuvering among numbers, and (2) my detail-oriented partner Henry Hoffman for spotting the sleight of hand.
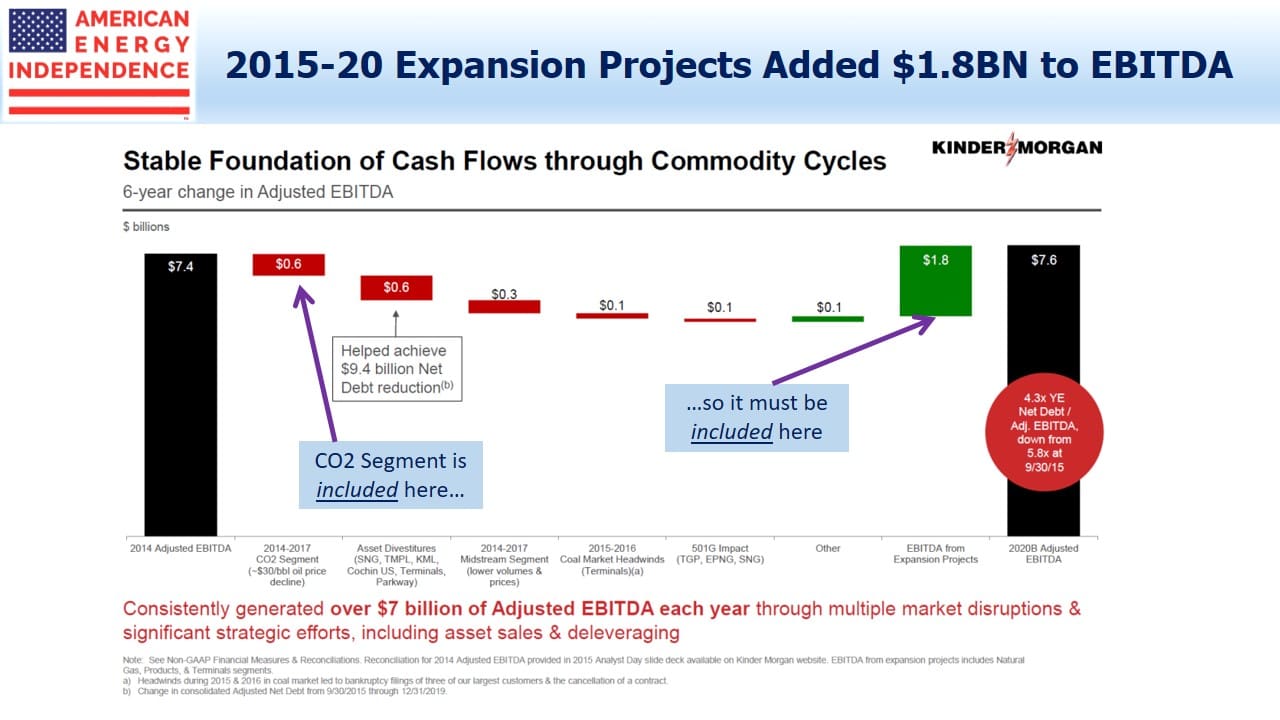
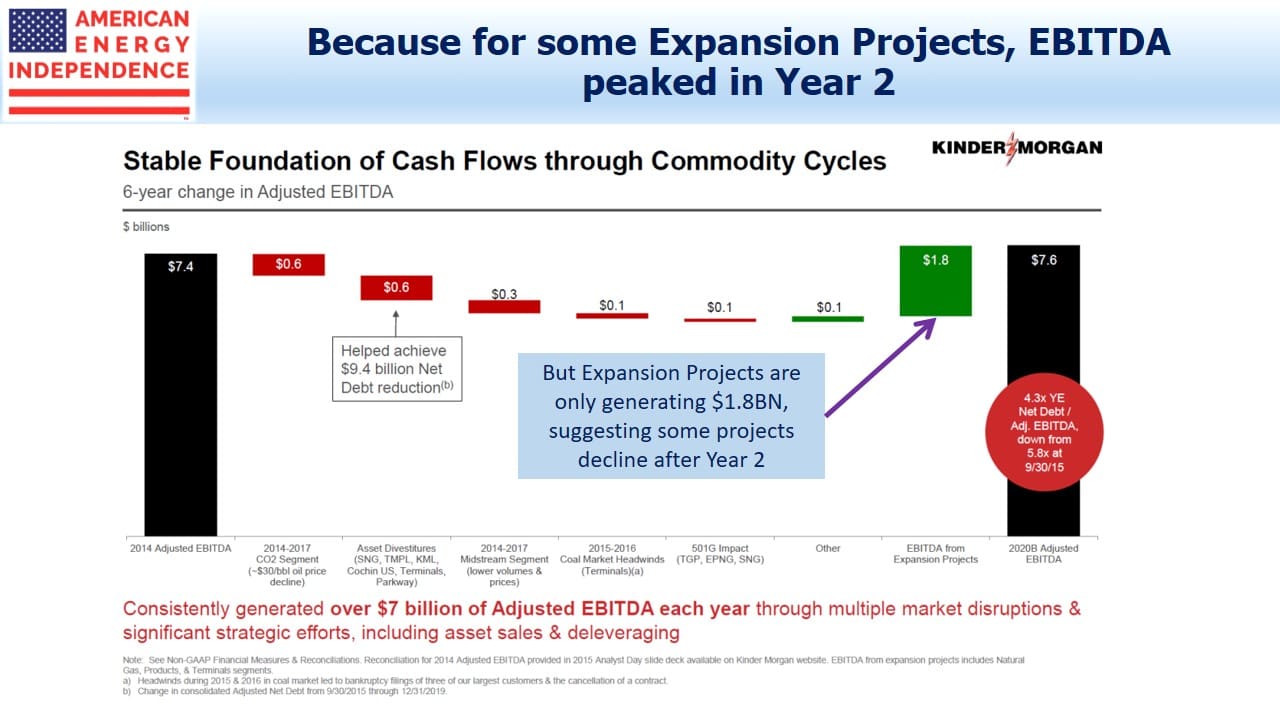
The story begins where KMI uses a “bridge” chart to show how EBITDA changed from 2014 to 2020. Dang introduced the slide as answering a common investor question: if you’re doing so well, why isn’t EBITDA growing more?
The chart includes the much criticized CO2 segment, which sells CO2 for Enhanced Oil Recovery (EOR) as well as being used by KMI itself for that purpose. CO2 contributed a $0.6BN decline to EBITDA from 2014-20. Since its decline is shown on the chart, it must also be part of the $1.8BN EBITDA increase from Expansion Projects, because the $7.6BN 2020 Adjusted EBITDA is for all of KMI.
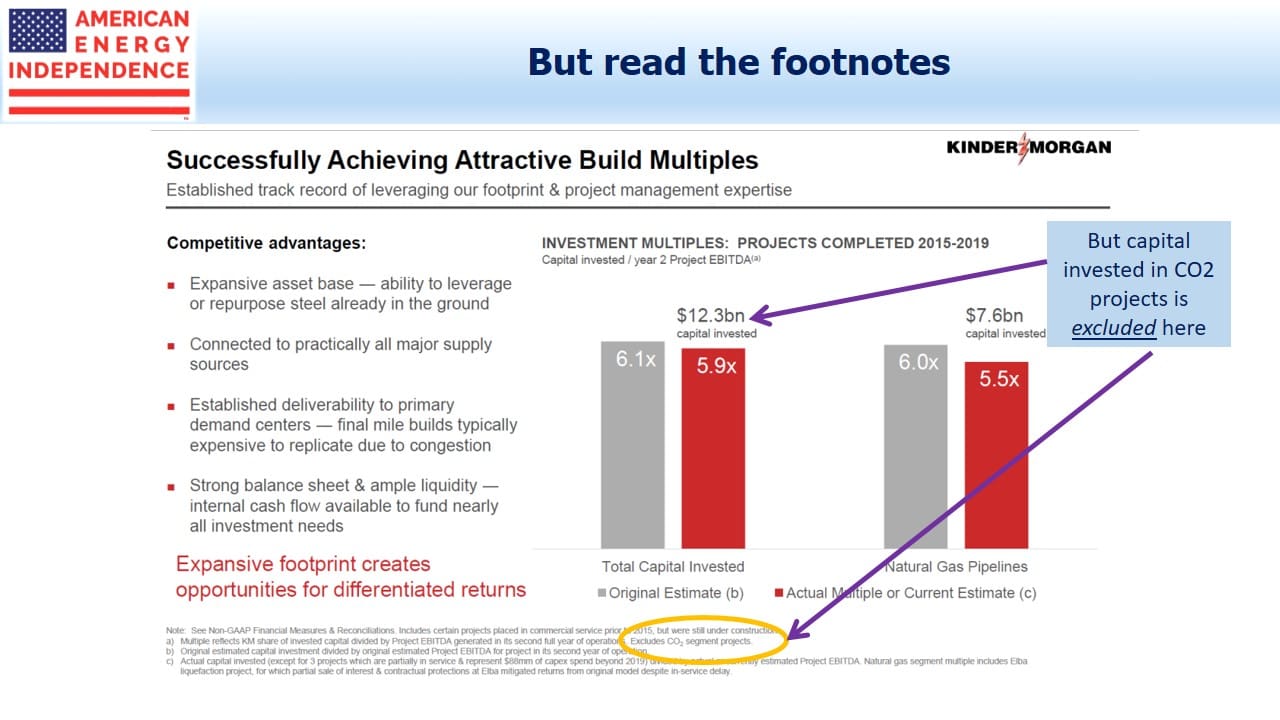
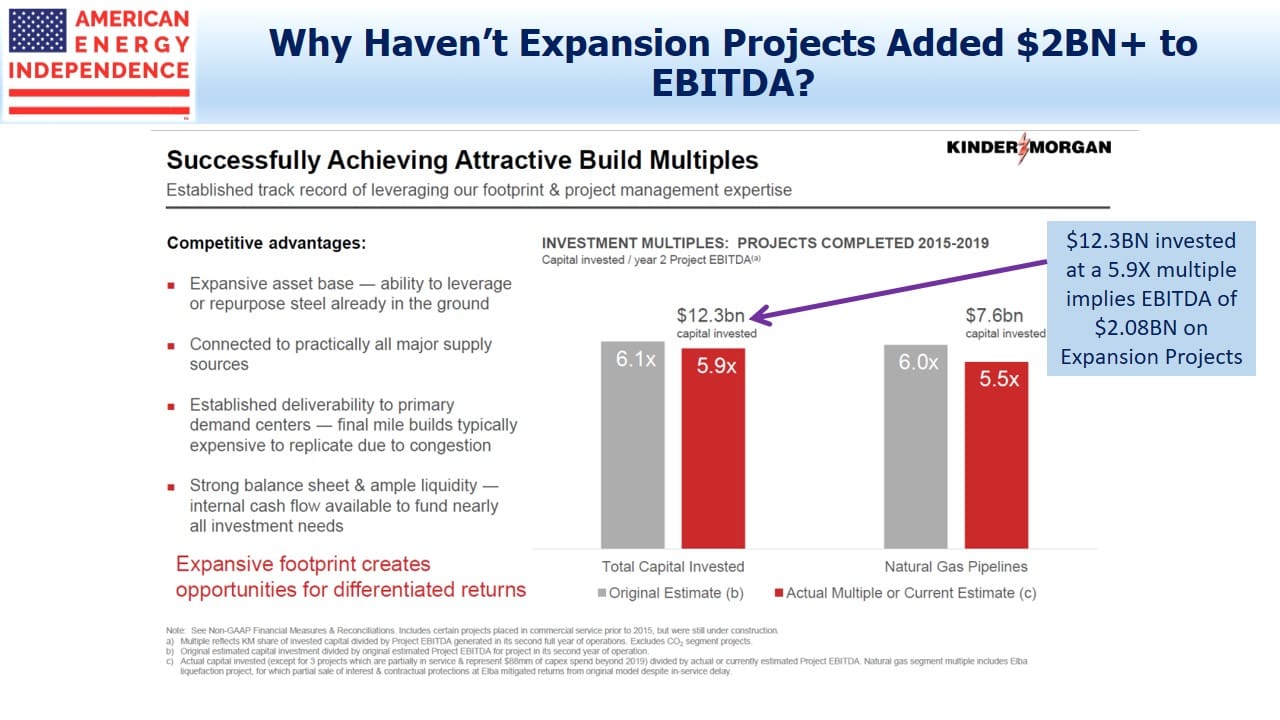
Another slide shows an attractive EBITDA multiple on capital invested, of 5.9X. In other words, $100 invested will return its capital invested over 5.9 years. The reciprocal of 5.9X is the return, a juicy 16.95% in this case and well over KMI’s assumed cost of capital. The 5.9X multiple implies these projects are generating $2.08BN in EBITDA.
But the small print notes that on this slide, CO2 segment Expansion Projects are excluded.
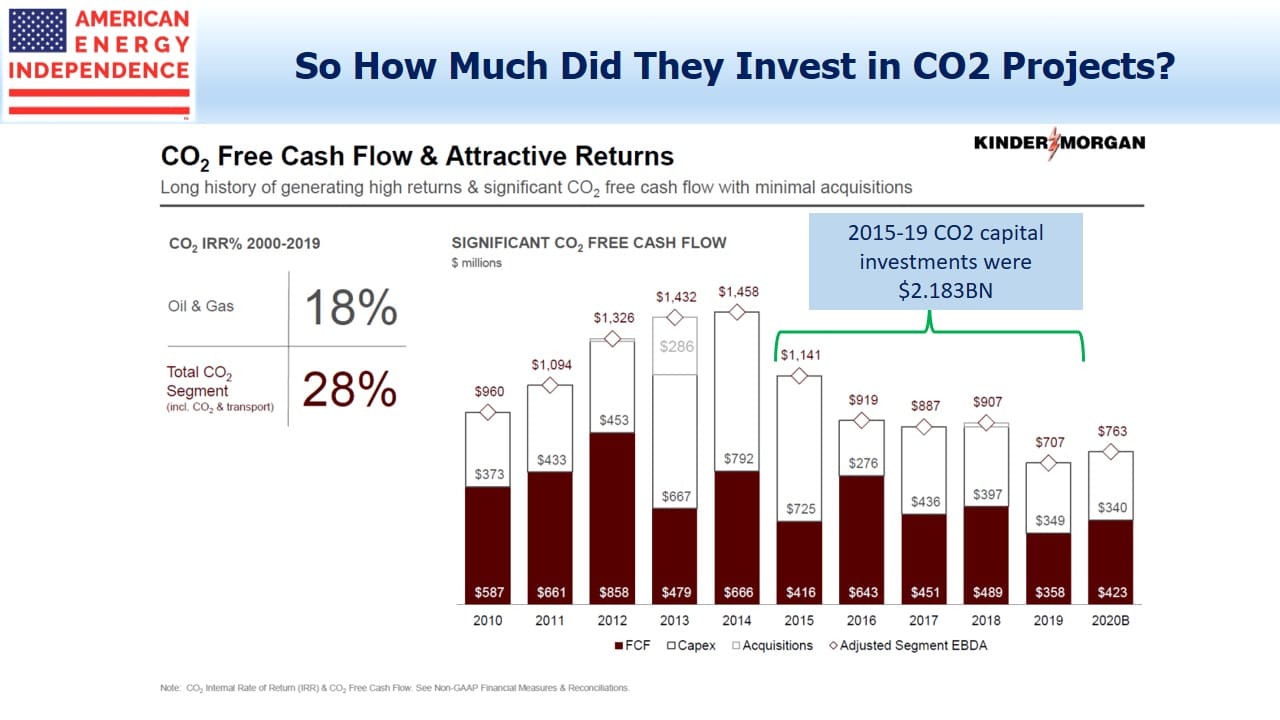
To find out what KMI invested in CO2 projects 2015-19, we turn to another slide, which shows annual figures. Adding up the Capex for 2015-19 gives $2.18BN.
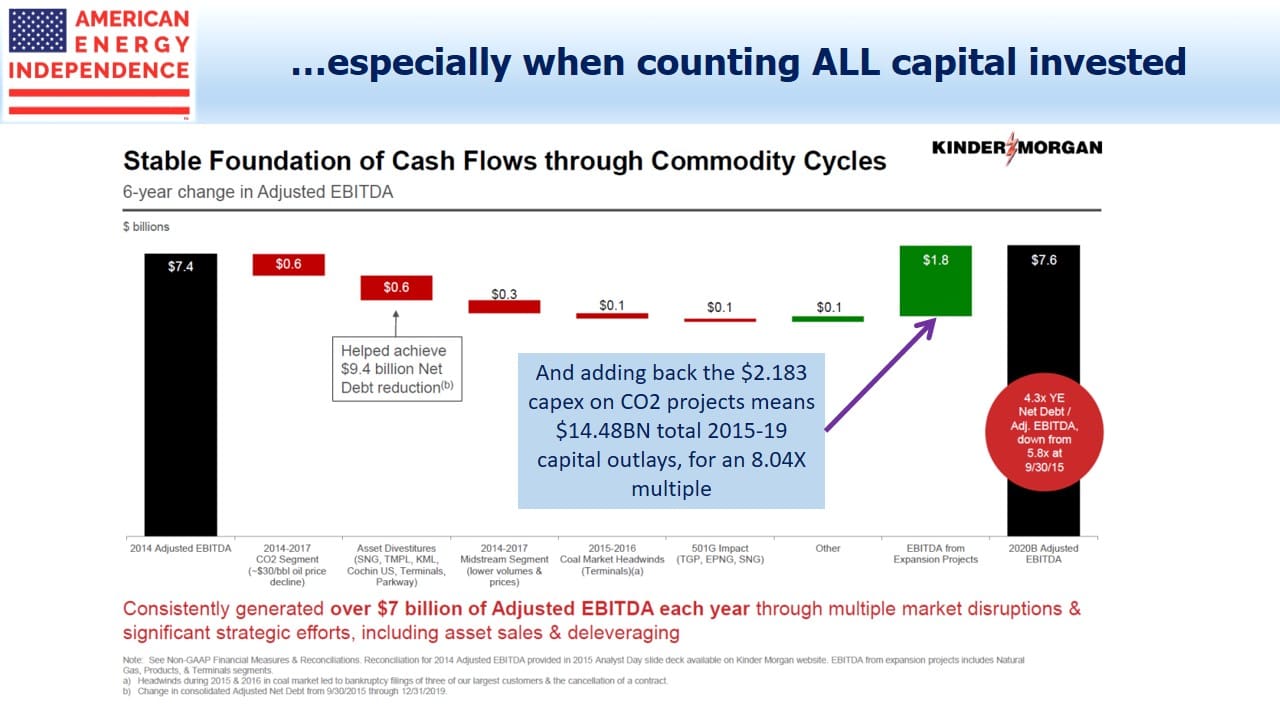
So KMI’s total capex over the period covered was not $12.3BN but $14.48BN, once you add back CO2.
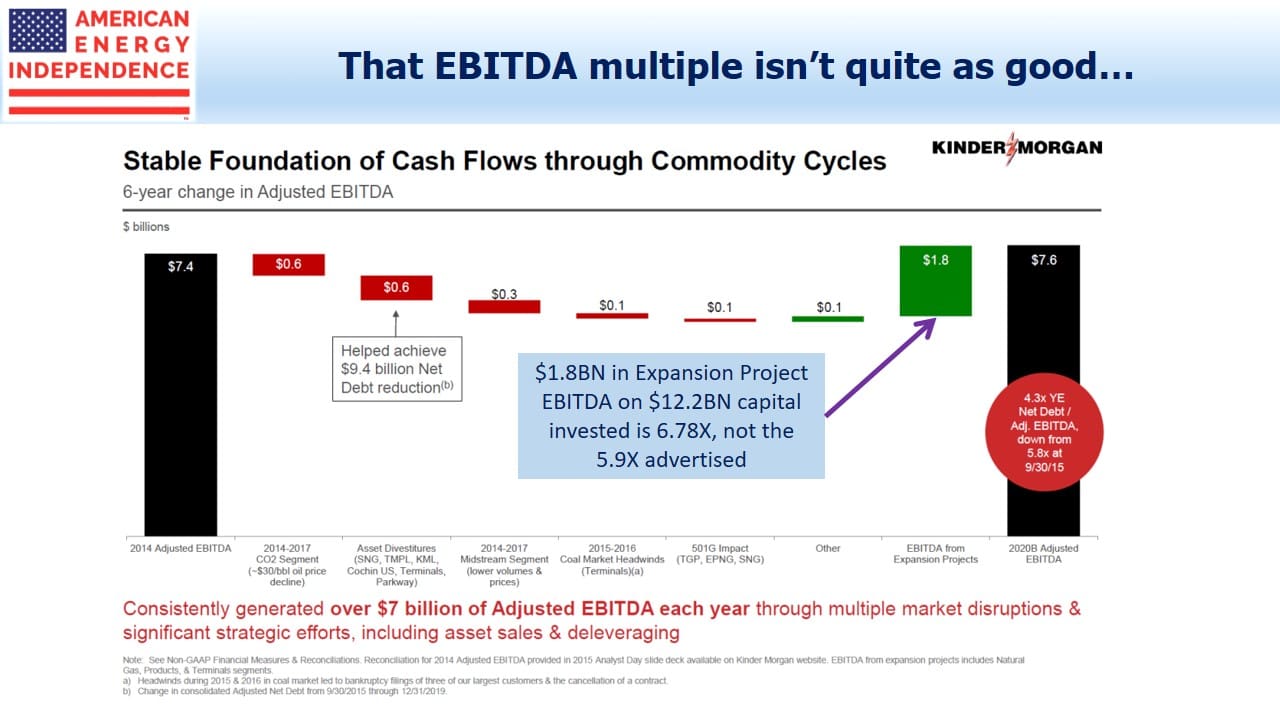
This makes the EBITDA multiple on new investments a little less stellar. The $1.8BN in EBITDA from Expansion Projects that required $12.3BN in investment equates to a 6.78X multiple. But since we know the $1.8BN EBITDA is from all Expansion Projects, including the CO2 business, it’s appropriate to add back the $2.18BN invested in CO2 Expansion Projects to get the true total.
That means the $1.8BN in “growth” EBITDA was earned on $14.48BN in capex, or a multiple of 8.04X. That’s 12.44% rather than the 16.95% calculated earlier. It’s pre-tax, and excludes interest expense as well as depreciation.
KMI uses more than one EBITDA definition through these slides, so you have to follow carefully. When calculating the EBITDA multiple, they like the “Year 2 Project EBITDA”, with its implied $2.08BN in EBITDA. The EBITDA bridge chart simply shows 2020 EBITDA of $1.8BN from all new projects initiated since 2015. Why are they different, and what does it mean?
Investment outlays have been falling since 2015, which means that the projects funded since then are, on average, past the two year mark. 2020 capex is almost a third lower than it was in 2015.
Since the $2.08BN “Year 2 Project EBITDA” is above the $1.8BN 2020 EBITDA from Expansion Projects in the bridge chart, and we know the average project is more than two years old, it means that EBITDA from new projects is declining. Using the “Year 2 Project EBITDA” flatters the results. Management teams persist in using EBITDA multiples, which are easily manipulated, rather than NPV and IRR. It’s as if they don’t think their investors will understand them – or maybe they’ve concluded that EBITDA multiples are easier to obfuscate.
Following this is admittedly a complicated exercise, but it illustrates the agile numeracy required of today’s energy sector CFO, and of the investors interested in properly understanding their business. KMI is certainly not alone in using financial complexity to their benefit. In this case, we think it’s driven by their continued retention of the CO2 business, which they should sell. Apart from that, KMI has some great assets.
We are invested in KMI
Important Disclosures
The information provided is for informational purposes only and investors should determine for themselves whether a particular service, security or product is suitable for their investment needs. The information contained herein is not complete, may not be current, is subject to change, and is subject to, and qualified in its entirety by, the more complete disclosures, risk factors and other terms that are contained in the disclosure, prospectus, and offering. Certain information herein has been obtained from third party sources and, although believed to be reliable, has not been independently verified and its accuracy or completeness cannot be guaranteed. No representation is made with respect to the accuracy, completeness or timeliness of this information. Nothing provided on this site constitutes tax advice. Individuals should seek the advice of their own tax advisor for specific information regarding tax consequences of investments. Investments in securities entail risk and are not suitable for all investors. This site is not a recommendation nor an offer to sell (or solicitation of an offer to buy) securities in the United States or in any other jurisdiction.
References to indexes and benchmarks are hypothetical illustrations of aggregate returns and do not reflect the performance of any actual investment. Investors cannot invest in an index and do not reflect the deduction of the advisor’s fees or other trading expenses. There can be no assurance that current investments will be profitable. Actual realized returns will depend on, among other factors, the value of assets and market conditions at the time of disposition, any related transaction costs, and the timing of the purchase. Indexes and benchmarks may not directly correlate or only partially relate to portfolios managed by SL Advisors as they have different underlying investments and may use different strategies or have different objectives than portfolios managed by SL Advisors (e.g. The Alerian index is a group MLP securities in the oil and gas industries. Portfolios may not include the same investments that are included in the Alerian Index. The S & P Index does not directly relate to investment strategies managed by SL Advisers.)
This site may contain forward-looking statements relating to the objectives, opportunities, and the future performance of the U.S. market generally. Forward-looking statements may be identified by the use of such words as; “believe,” “expect,” “anticipate,” “should,” “planned,” “estimated,” “potential” and other similar terms. Examples of forward-looking statements include, but are not limited to, estimates with respect to financial condition, results of operations, and success or lack of success of any particular investment strategy. All are subject to various factors, including, but not limited to general and local economic conditions, changing levels of competition within certain industries and markets, changes in interest rates, changes in legislation or regulation, and other economic, competitive, governmental, regulatory and technological factors affecting a portfolio’s operations that could cause actual results to differ materially from projected results. Such statements are forward-looking in nature and involves a number of known and unknown risks, uncertainties and other factors, and accordingly, actual results may differ materially from those reflected or contemplated in such forward-looking statements. Prospective investors are cautioned not to place undue reliance on any forward-looking statements or examples. None of SL Advisors LLC or any of its affiliates or principals nor any other individual or entity assumes any obligation to update any forward-looking statements as a result of new information, subsequent events or any other circumstances. All statements made herein speak only as of the date that they were made. r
Certain hyperlinks or referenced websites on the Site, if any, are for your convenience and forward you to third parties’ websites, which generally are recognized by their top level domain name. Any descriptions of, references to, or links to other products, publications or services does not constitute an endorsement, authorization, sponsorship by or affiliation with SL Advisors LLC with respect to any linked site or its sponsor, unless expressly stated by SL Advisors LLC. Any such information, products or sites have not necessarily been reviewed by SL Advisors LLC and are provided or maintained by third parties over whom SL Advisors LLC exercise no control. SL Advisors LLC expressly disclaim any responsibility for the content, the accuracy of the information, and/or quality of products or services provided by or advertised on these third-party sites.
All investment strategies have the potential for profit or loss. Different types of investments involve varying degrees of risk, and there can be no assurance that any specific investment will be suitable or profitable for a client’s investment portfolio.
Past performance of the American Energy Independence Index is not indicative of future returns.


Very interesting. Are they telling investors one story and the SEC something different? Thank you.
Appreciate that SL Advisors shares publicly its buy side dissection method for analyzing reported earnings, cap expenditure, and cash flow statements of KMI and other energy businesses that are within their core expertise and held in advised funds and accounts.
Independently of the blog opinion, SL can remain invested in advised account, or not. Likewise, a company doesn’t have to agree or follow SL opinion on whether it should sell a division or change its governance. All good and fair.
Why invest in a company so adept at deception?