Kinder Morgan Responds to our Recent Criticism
To their credit, Kinder Morgan (KMI) responded to our recent blog (see Kinder Morgan’s Slick Numeracy). We exchanged several emails, although they declined our invitation to write a rebuttal which we promised to publish unedited. The company stands by their presentation, but did concede that some slides might have been more clearly labeled.
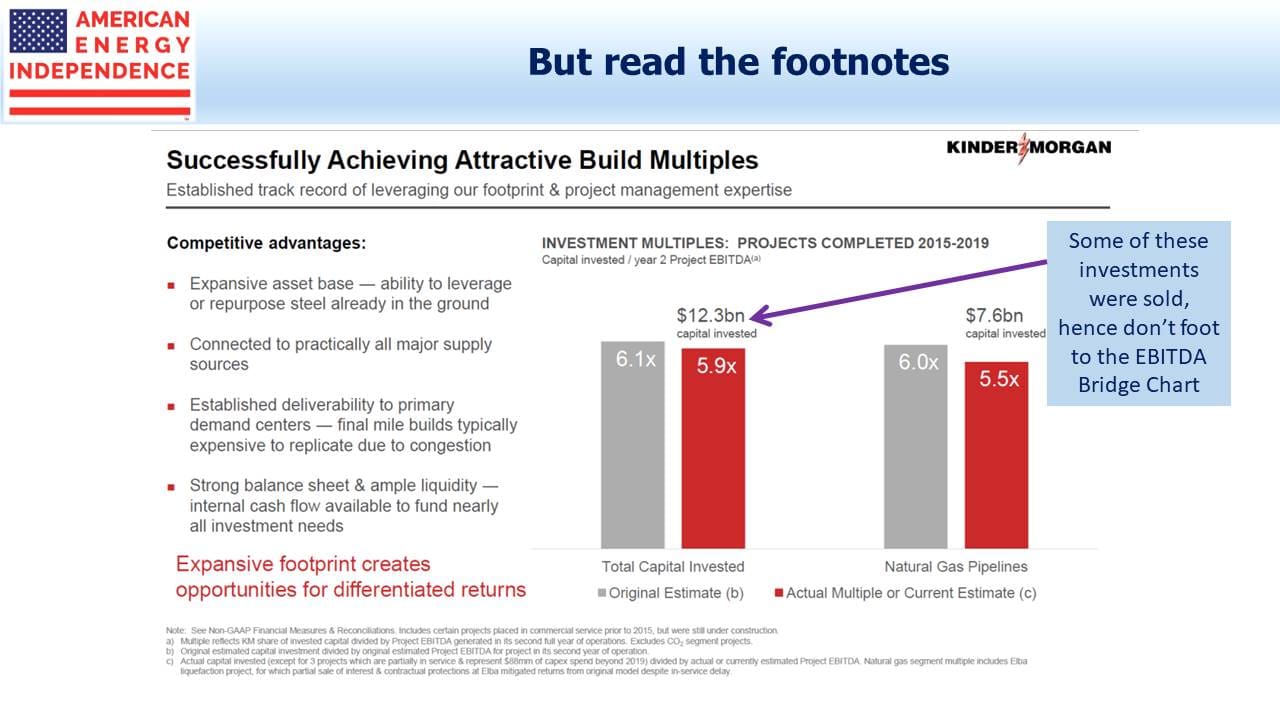
We had noted in our blog that the 5.9X EBITDA multiple on $12.3BN invested didn’t foot to the $1.8BN EBITDA from growth projects in the Bridge Chart. KMI explained this was because some investments they made had been sold in the meantime.
They believe that attractive returns on more recent investments have been masked by headwinds in their existing business. The EBITDA Bridge Chart blames the 2014-17 energy downturn for $0.6BN in reduced EBITDA from their CO2 business, which is net of new investment (i.e. CO2 growth projects are included in this figure). The $0.3BN drop in the Midstream segment was from lower volumes and tariffs in their pipelines.
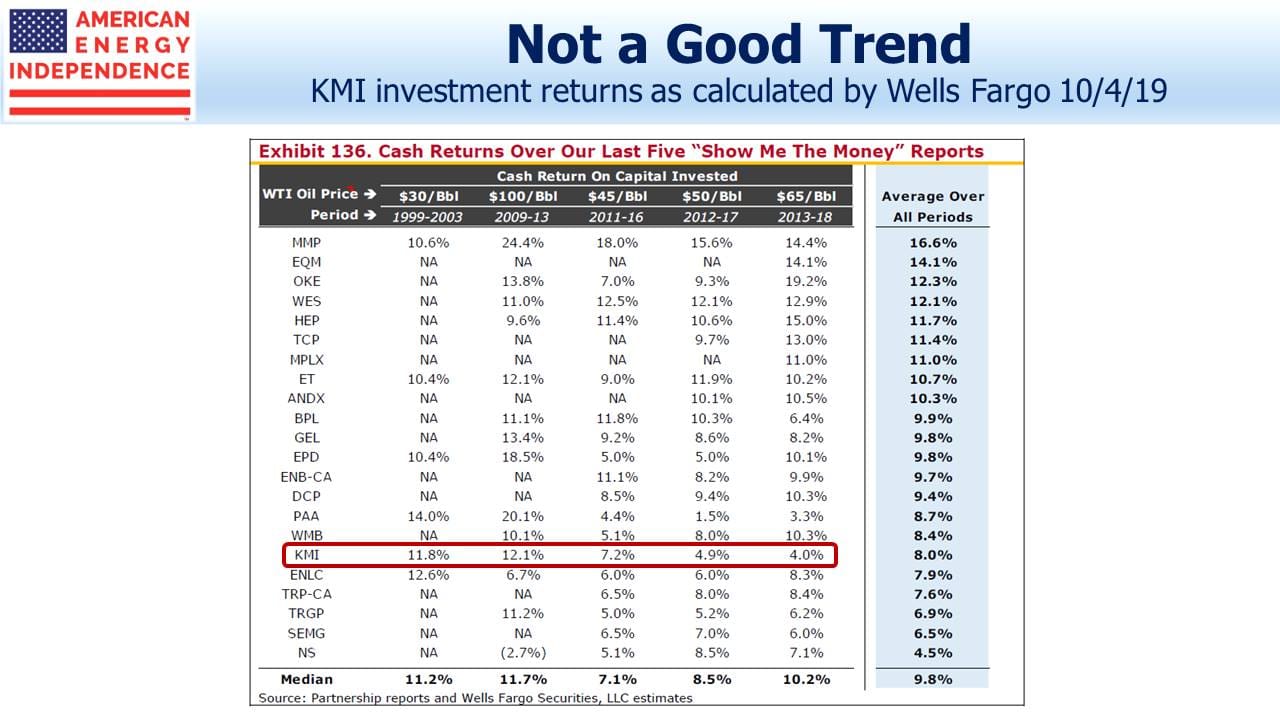
KMI’s return on invested capital has drawn questions from others. A January 6 research report from Morgan Stanley placed KMI’s 2017-18 Return on Invested Capital (ROIC) at 4.5%, worst out of 12 peers. In October, Wells Fargo calculated a 2013-18 cash return on investment of 4%, 2nd worst in the group and declining.
In response, KMI referred us to a slide showing ROIC by segment. They say they have discussed the Wells piece with the firm, and make a distinction between recently invested capital and returns on legacy assets.
The ROIC slide incorporates some complexity. The footnote reminds that pre-2014 returns are from Kinder Morgan Partners (KMP) and El Paso (EPB), which is where KMI’s operating assets were held before being rolled up into the parent. Those were the days of Incentive Distribution Rights (IDRs), when KMP and EPB both paid a share of their returns back to their controlling general partner, KMI.
Once the IDRs went away, returns might have been expected to jump. That they didn’t suggests that the chart treats IDRs as a cost of capital and not as an expense to KMP and EPB, which they most assuredly were. So we think the returns are on the assets, not on what KMP and EPB unitholders earned on those assets.
KMI believes they are making a genuine effort to present their case, and in providing so much detail they create opportunities for investors like us to look for inconsistencies. But we think that EBITDA multiples aren’t a good way to do it. The declining ROIC chart is hard to reconcile with higher recent returns. It also highlights the volatility of the CO2 business, which they evidently believe can get back to the returns it generated a decade ago. The fact that they haven’t yet received a sufficiently attractive offer for this segment means few share their optimism.
The company uses IRR in allocating capital. They say new projects require unlevered pre-tax returns of 15-20%, but their ROIC chart shows returns sliding towards 10%. At some point the high return investments of recent years must lift their overall ROIC. EBITDA multiples can flatter – a project with declining EBITDA (like a CO2 investment) might look superficially attractive based on Year 2 returns but ultimately not cover the cost of capital. The company is adamant they’re not allocating this way. So why not show expected IRRs on new investments?
We appreciate KMI’s effort to reach out – “slick numeracy” probably didn’t gain us any additional friends there. Along with countless other long-time investors, we’re frustrated that KMI remains well below the highs of 2014. Their stable, fee-generating assets ought to draw a higher valuation.
Important Disclosures
The information provided is for informational purposes only and investors should determine for themselves whether a particular service, security or product is suitable for their investment needs. The information contained herein is not complete, may not be current, is subject to change, and is subject to, and qualified in its entirety by, the more complete disclosures, risk factors and other terms that are contained in the disclosure, prospectus, and offering. Certain information herein has been obtained from third party sources and, although believed to be reliable, has not been independently verified and its accuracy or completeness cannot be guaranteed. No representation is made with respect to the accuracy, completeness or timeliness of this information. Nothing provided on this site constitutes tax advice. Individuals should seek the advice of their own tax advisor for specific information regarding tax consequences of investments. Investments in securities entail risk and are not suitable for all investors. This site is not a recommendation nor an offer to sell (or solicitation of an offer to buy) securities in the United States or in any other jurisdiction.
References to indexes and benchmarks are hypothetical illustrations of aggregate returns and do not reflect the performance of any actual investment. Investors cannot invest in an index and do not reflect the deduction of the advisor’s fees or other trading expenses. There can be no assurance that current investments will be profitable. Actual realized returns will depend on, among other factors, the value of assets and market conditions at the time of disposition, any related transaction costs, and the timing of the purchase. Indexes and benchmarks may not directly correlate or only partially relate to portfolios managed by SL Advisors as they have different underlying investments and may use different strategies or have different objectives than portfolios managed by SL Advisors (e.g. The Alerian index is a group MLP securities in the oil and gas industries. Portfolios may not include the same investments that are included in the Alerian Index. The S & P Index does not directly relate to investment strategies managed by SL Advisers.)
This site may contain forward-looking statements relating to the objectives, opportunities, and the future performance of the U.S. market generally. Forward-looking statements may be identified by the use of such words as; “believe,” “expect,” “anticipate,” “should,” “planned,” “estimated,” “potential” and other similar terms. Examples of forward-looking statements include, but are not limited to, estimates with respect to financial condition, results of operations, and success or lack of success of any particular investment strategy. All are subject to various factors, including, but not limited to general and local economic conditions, changing levels of competition within certain industries and markets, changes in interest rates, changes in legislation or regulation, and other economic, competitive, governmental, regulatory and technological factors affecting a portfolio’s operations that could cause actual results to differ materially from projected results. Such statements are forward-looking in nature and involves a number of known and unknown risks, uncertainties and other factors, and accordingly, actual results may differ materially from those reflected or contemplated in such forward-looking statements. Prospective investors are cautioned not to place undue reliance on any forward-looking statements or examples. None of SL Advisors LLC or any of its affiliates or principals nor any other individual or entity assumes any obligation to update any forward-looking statements as a result of new information, subsequent events or any other circumstances. All statements made herein speak only as of the date that they were made. r
Certain hyperlinks or referenced websites on the Site, if any, are for your convenience and forward you to third parties’ websites, which generally are recognized by their top level domain name. Any descriptions of, references to, or links to other products, publications or services does not constitute an endorsement, authorization, sponsorship by or affiliation with SL Advisors LLC with respect to any linked site or its sponsor, unless expressly stated by SL Advisors LLC. Any such information, products or sites have not necessarily been reviewed by SL Advisors LLC and are provided or maintained by third parties over whom SL Advisors LLC exercise no control. SL Advisors LLC expressly disclaim any responsibility for the content, the accuracy of the information, and/or quality of products or services provided by or advertised on these third-party sites.
All investment strategies have the potential for profit or loss. Different types of investments involve varying degrees of risk, and there can be no assurance that any specific investment will be suitable or profitable for a client’s investment portfolio.
Past performance of the American Energy Independence Index is not indicative of future returns.


Leave a Reply
Want to join the discussion?Feel free to contribute!