Gulf Tensions Back in Play

Just over three months ago, Saudi Arabian oil facilities were put out of action by a drone and missile strike. Oil prices jumped. It seemed indisputable than Iran was behind the attack – the sophistication was beyond that believed available to the Yemeni Houthi rebels who claimed responsibility. Saudi retaliation appeared inevitable, as half their oil production was taken offline.

Crude jumped, but the Saudis chose to ignore Iran’s provocation. Prices soon fell back as the market resumed its sanguine view of supply disruption.

So is it different this time? The assassination of Iran’s top military leader, General Qassem Soleimani, looks like a sharp escalation of tensions. Secretary of State Mike Pompeo justified it as preventing “an imminent” attack on U.S. citizens. Reportedly, both Presidents Bush Jr and Obama declined opportunities to kill Soleimani in the past, because they feared it would lead to war. Iran has so far pursued asymmetry, avoiding a hopeless direct military confrontation in favor of indirect responses under cover of plausible deniability. Will that strategy change?

The Shale Revolution affords the U.S. far more foreign policy flexibility, now that OPEC can’t cause lines of cars at gas stations. Substantially higher domestic production of hydrocarbons made America a net exporter of crude oil and petroleum products late last year. Qassem Soleimani might be alive today if not for fracking.

Near term bets on crude oil or the energy sector will turn on how events play out, and it’s easy to have misplaced conviction with so many possible scenarios. Exxon Mobil (XOM) operates in 38 countries. Some of their infrastructure, which includes three JVs in Saudi Arabia, may be vulnerable, Geopolitical risk comes with complexity.

This is not the case for U.S. midstream energy infrastructure. For this sector, “international” is limited to Canada and in some cases Mexico. Pipelines are hard to damage because they’re underground, and while aboveground facilities are certainly more vulnerable, America is not an easy place for terrorist operations.

The sector is cheap enough that an investor can awaiting a re-pricing catalyst, which could be conflict in the Middle East or simply the market’s ultimate recognition of improving fundamentals.

Although S&P500 valuations are historically high, at over 18X 2020 earnings, the five biggest North American midstream infrastructure names trade at almost a 20% discount. All five of these companies are in the American Energy Independence Index.

S&P Energy, having sunk to 4% of the S&P500, is at close to its cheapest relative multiple in a decade.

There’s no need to correctly forecast disruptive geopolitical events or react quickly to them. Pipeline stocks are cheap enough to provide holders with multiple potential ways to make money.

We are invested in all the names listed above.

Looking Back on 2019

Our twice-weekly blog saw a 30% increase in pageviews during 2019, along with a healthy jump in subscribers. It’s reposted across several other websites, and we believe it’s the most widely read blog on midstream energy infrastructure.

The interest level shown by readers, as well as questions asked by investors, both influence our choice of topics. Reviewing the past year’s stats provides a useful perspective on what pipeline investors are thinking about.

Our most read blog post of the year was When Will MLPs Recover? It was published on November 13th. It didn’t catch the low, which came in early December, but the recent rally has lifted prices nicely above their mid-November level. Coming on the heels of a weak October, always-fragile sentiment plunged to utter resignation among some. MLPs lagged midstream energy infrastructure by a wide margin in 2019, with the Alerian MLP Index up 9% compared with the American Energy Independence Index which is up 23%. It’s a consequence of the narrow investor base for MLPs.

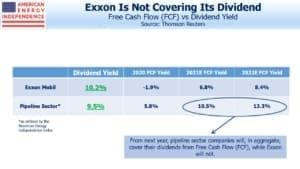
The Coming Pipeline Cash Gusher was #2, offering our most eloquent response to the question about sector recovery. Free Cash Flow (FCF) has not historically been a metric used by MLPs. Two of the best performers in 2019, TC Energy (TRP) and Enbridge (ENB), do generate healthy FCF. Their capital allocation reflects values inspired by Canadian Presbyterian parsimony. Their strong 2019 returns suggest that as other pipeline companies increase FCF, their stock prices will also rise. We’ll be updating this analysis following 4Q19 earnings when companies provide updated 2020 growth capex guidance.

American Energy Independence is Imminent was #3, celebrating the many positives for the U.S. that increased domestic energy production is bringing.

AMLP’s Tax Bondage was #4. This was originally published in January 2018, and is our most read blog over the past two years. Explaining the disastrous tax drag to investors in AMLP invariably draws gratitude from the newly informed.

Why Energy Transfer Can’t Get Respect came in at #5. Too few writers are willing to be critical of the sector they follow. Your investment team is heavily invested in many of the companies we cover. When they do things we disagree with, I am incensed. We sell out if we conclude there’s no hope of management making sound decisions and acting with integrity. But it’s foolish to ignore valuation, and position sizing needn’t be binary (i.e. invested or not invested), it can be scaled to reflect all the relevant factors. Publicly criticizing a CEO to several thousand readers can provide the same satisfaction as impulsively dumping the stock, and often makes for better investment returns.

Our biggest single day of pageviews came on October 9th, driven by Energy Transfer’s Weak Governance Costs Them.

In addition to our blog, we do a weekly podcast which is about six months old. It is steadily gaining listeners. Like our blog, it covers the sector but also takes a political view on issues like climate change that have big implications for our business. A recent episode, The Coming Rally in MLPs, was our most popular podcast. A couple of my personal favorites are Celebrity Climate Change Shaming and Greta’s Grandstanding. The most vocal climate extremists are often those least capable of critical analysis. The climate change debate has too few pragmatists seeking practical solutions. The middle ground, where we sit, is wide open.

We also do a quarterly webinar and periodic videos. Stop Flaring is our most popular video.

Finally, Twitter is an under-utilized resource that surprisingly few financial advisors use. I follow energy journalists and publications, and generally limit my tweets to energy (although occasionally that self-restraint lapses). If you want to know which stories we’re following today, check out @SimonLack.

We enjoy the engagement and feedback on all the material we produce. American Energy Independence is a fantastic story for this great country. There’s a bright future ahead.

We are invested in Enbridge , Energy Transfer and TC Energy

Searching for Christmas

Our blog has a Search function that allows users to quickly find what they’re looking for. One of our most often read blog posts is MLP Funds Made for Uncle Sam, which is easily found by entering “Sam” in the search box.

SL Advisors is a secular organization, but searching for the word “Christmas” generates a surprising number of results.

Some relate to the seasonal pattern in which November weakness in MLPs is followed by a rally into January. Why MLPs Make a Great Christmas Present, MLPs Lose That Christmas Spirit and MLPs Weak in November, As Usual all reference Christmas in the text.

In Stocks Are the Cheapest Since 2012 a year ago we welcomed Christmas as a respite from relentless selling. Stocks, including midstream energy infrastructure, duly rallied with our American Energy Independence Index gaining 20% since then.

Investor frustration with the sector was high at times during 2019, and few probably expected the year’s returns to finish where they are. Energy infrastructure has joined the festive season in recent weeks.

Although New Jersey is not having a white Christmas, it’s still too cold for golf. This remains one of our favorite cartoons.

We wish all of our readers a Merry Christmas, Happy Holidays, and much joyful time with family and friends.

Tallgrass Investors Catch a Break

Yesterday Blackstone (BX) surprised Tallgrass Equity (TGE) investors by sweetening their offer for the shares they don’t own to match the price they originally paid in March. It marks a victory for Limited Partners in TGE, which retained its partnership structure even though it’s taxed at a corporation so as to avoid issuing K-1s.

The sideletter that provided a floor on the price management received for their LP units was unfair, and caused us to criticize it in September (see Blackstone and Tallgrass Further Discredit the MLP Model) when BX announced their offer to acquire the remainder of the shares. Most sell-side analysts were embarrassingly silent in standing up for their investors, conflicted as they are by the desire to win banking mandates from the protagonists. RW Baird’s Ethan Bellamy is a standout exception, unafraid to raise awkward questions during earnings calls, which renders his research opinions more credible. Other sell-side analysts should take note.

TGE CEO David Dehaemers claimed not to understand (see Tallgrass Responds to Critics, Missing the Point) and with nobody else publicly taking his side, he brought forward his retirement. This ended a disappointing episode in an otherwise successful career.

Although the degree of sweetening from BX was a surprise, once they’d invested in TGE it always made sense for them to acquire the rest. Having a public equity position in a private equity portfolio adds unwelcome valuation realism. Private equity funds are reporting far better investment returns than public markets (see Private Equity, Private Valuations), even though they occasionally commit some howlers (see Leverage Wipes Out Investor’s Bet on Enlink). GIP’s 44% partial ownership of Enlink (ENLC) can hardly be their desired position – they’ll either buy the rest or exit, realizing a substantial loss. Information on GIP’s intentions has been sparse. PE investments rarely lose value as quickly as this one, and explaining it has been an unwelcome distraction for GIP’s overworked investor relations people.

TGE’s pending disappearance as a public company also represents another step in the shrinking universe available to Alerian’s MLP indices. TGE was a 4.7% weight in the Alerian MLP and Infrastructure Index (AMZI), followed by the tax-burdened ETF AMLP (see MLP Funds Made for Uncle Sam). TGE is far less than 4.7% of North American midstream energy infrastructure, as shown by its 2.4% weight in the American Energy Independence Index. Because AMZI is limited to partnerships, the TGE proceeds will have to be reallocated across a subset of the pipeline sector, further increasing AMLP’s concentration and rendering it even less representative (see AMLP’s Shrinking Investor Base).

News on our American Energy Independence ETF (USAI)

Last week shareholders of the American Energy Independence Fund (USAI) approved its reorganization into the Pacer American Energy Independence Fund. Today, Pacer took over from SL Advisors as the fund’s advisor.
We expect that this will allow Pacer Advisors to leverage its resources for and focus its marketing and distribution efforts on growing USAI’s AUM.
Please click here for more information.

Private Equity, Private Valuations

Last week Cowen held a two day energy conference. Presenting companies included upstream and service providers, so although there were no midstream energy infrastructure companies present it provided useful background for current operating conditions.

Baker Hughes (BKR) is one of three large diversified services companies supporting the sector, along with Schlumberger and Halliburton. BKR CFO Brian Worrell provided an upbeat outlook following their recent spinout from GE. They cleverly describe themselves as a “fullstream” company (i.e., covering upstream to downstream). Listening to Worrell, it’d be hard to remember how negative investor sentiment is within energy. Consensus estimates for BKR’s 2019-21 EBITDA growth rate are 15%.

Worrell provided some interesting background on a partnership they have with AI firm C3. Predictive Asset Maintenance, one of their offerings, analyzes operating data from customer equipment to anticipate breakdowns, allowing repairs to be done pre-emptively. BKR is C3’s exclusive partner in the energy sector. They have 200 customers.

Another interesting theme was the influence of Private Equity (PE) investors. Independence Contract Drilling (ICD) is a micro-cap drilling company clearly wrestling with the downturn in shale-related rig demand. One participant asked if they’d considered a sale or merger. President and CEO Anthony Gallegos noted a recent negotiation with a competing privately owned firm which foundered when the PE backer insisted their drilling rigs were worth $18MM each while ICD’s stock price placed an implicit value of only $6MM for its similar equipment.

There’s plenty of evidence that PE firms assess more value in publicly traded energy sector equities than the public markets themselves. PE investments in midstream energy infrastructure have slowed down in recent months, although it’s still been an active year. But there are questions about valuation.

Energy-focused PE funds saw their highest inflows in 2014, when the sector peaked. This isn’t surprising, since fund flows invariably follow performance. But what’s odd is that fund returns since then are well ahead of the S&P600 Energy Index.

Although PE funds deploy capital over several years and likely made investments through the 2016 low, the recovery since then has been modest. It suggests that valuations are not rigorous – PE firms have a great deal of latitude in making estimates. Fees and the ability to raise subsequent funds both benefit from higher valuations.

PE energy funds continue to raise capital, supported in part by the returns they show on prior funds. The illiquidity of private investments is supposed to generate a modest return premium, but research from Cobalt GP reveals that so far these funds are claiming to beat public markets by 15-30%. Total Value to Paid In (TVPI) suggests these fund managers have chosen well, and is the basis for their IRRs. But Distributions to Paid In (DPI) are well under 1.0X even for funds that are five years old, showing that the IRRs rely heavily on the valuations of current holdings. As cash distributions increase, the time of reckoning will arrive when investors will learn how accurate these interim IRRs have been.

On a different topic, the magazine cover contrary indicator theory posits that when a topic or person becomes mainstream, interest soon peaks. Credit friend Barry Knapp, CEO and founder of Ironsides Macroeconomics, for being first to predict that high school dropout Greta Thunberg’s selection as Time’s Person of the Year likely marks a peak in interest in climate change.

Enlink’s Growth Plans Need Better Justification

Energy investors would still like to see less spending on growth projects than company executives are pursuing. Whenever a CEO announces new spending, there’s a palpable lack of enthusiasm. Given valuations, many companies could easily justify buying back stock as a higher return use of capital than building new infrastructure. The message is getting through, but not quickly enough in the opinion of many.

Part of the problem is the way companies present their growth plans. A recent investor presentation from Enlink (ENLC) illustrates the problem. Their 2020 Growth Capital Expenditures (“capex”) are listed as $275-375MM. The collapse in ENLC’s stock price this year has driven their dividend yield up to 25%, a lofty level they plan to maintain. Since stock repurchased would therefore generate a 25% return as they claim DCF coverage >1X, it’s hard to believe they carried out a rigorous analysis on where they plan to invest cash that clearly won’t be used to buy back stock. Theoretically, their capex plans will yield a higher return that their stock, the implausibility of which casts further doubt on their capital allocation.

However, the problem with the presentation is the focus on EBITDA multiples to illustrate the attractiveness of their capital program. Over two thirds of their projects will generate an adjusted EBITDA multiple of <4X. In other words, $100 invested will generate better than $25 of EBITDA.

By coincidence, ENLC’s projects offer a return similar to their dividend yield, perhaps justifying them as a better use of scarce funds rather than buybacks. But over half the projects are for natural gas well connects, gathering and compression. These are not long distance transportation pipelines, but narrow lines running to individual wells. Their volumes will begin strongly and deplete as output from the wells they’re servicing depletes.

The point is that projects should be evaluated on an NPV basis, taking account of all the future cashflows. An EBITDA multiple is a shorthand way of comparing projects, and only makes sense when that EBITDA is stable or growing. ENLC’s CFO presumably doesn’t assess projects that way.

The types of project ENLC is planning have declining EBITDA. Including them in their presentation the way ENLC does creates a misleading impression of highly attractive investments. When we asked ENLC about the absence of any decline assumption in their own capex guidance, they referred us to Devon Energy’s (DVN) comments on the issue. DVN is the big customer whose production ENLC’s capex are intended to service. DVN has forecast production declines rates from “high 20% to high 30%”. DVN isn’t claiming that production will be stable. So why is ENLC using the first year’s cash flow to justify the capex in its presentation?

ENLC must know that presenting an investment based on the first year’s cashflow doesn’t fairly present the longer term outlook. They should either model the EBITDA over several years to show the decline rate they expect, or present the NPV analysis that they’ve presumably done internally before committing capital. A cynic might believe ENLC is doing projects with a negative NPV because the first year’s EBITDA flatters their leverage ratio, temporarily boosting EBITDA and thereby lowering Debt:EBITDA.

Energy companies are being criticized for poor capital allocation – a more transparent and rigorous explanation of spending would help ease investor concerns.

ENLC has plenty of room for improvement in this area. We hope they do. We are invested in ENLC and believe it’s cheap. The market is not giving energy management teams the benefit of the doubt and their stock would benefit from our suggested improvements in their presentation.

Williams Companies Promotes the Little Blue Flame

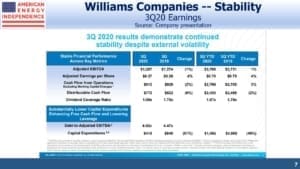
Last Thursday Williams Companies (WMB) held their investor day in New York. WMB owns and operates an extensive natural gas network, and is a top ten U.S. midstream energy infrastructure company. Like most big pipeline companies, it’s omitted from the Alerian MLP indices because it’s not an MLP. CEO Alan Armstrong conceded that the company had in recent years become too closely identified with the oil business and fracking. He said they need to refocus attention on the little blue flame in every kitchen’s stovetop, emphasizing a cleaner, more positive message.

Their presentation opened with some useful slides on the long term, global outlook for natural gas. Although most investors in this sector follow crude oil prices because they drive sentiment among energy investors, our investments are more focused on natural gas because it’s the cleanest burning fossil fuel and we believe has a clearer growth path over the next several decades.

The Shale Revolution has produced an abundance of natural gas in America, which means that it’s not only cleaner than other fossil fuels but also the cheapest form of residential heating. So far, the benefits of this abundance have flowed to the consumers of cheap energy and not the producers, as energy investors know well. Figuring out how to better monetize America’s energy renaissance consumes management teams and investors.

Substantial press coverage is focused on climate change and the opportunity of renewables to impede global warming. Solar and wind remain fringe sources of overall energy, a statement often regarded as incendiary by climate extremists but easily supported in the above chart. Electricity is 20% of global end-use energy consumption, with solar and wind providing 2% and 5% respectively. So at 7% of power generation, which is itself 20% of global energy use, they’re 1.4% of the total. Natural gas substitution for coal has been far more effective in lowering emissions, and attracts thoughtful advocates for cleaner energy.

An estimated 17,300 children younger than 15 die every day because of insufficient access to energy, according to UNICEF (the United Nations Children’s Fund). The moral high ground is solidly occupied by those engaged in providing more energy to poor countries, including investors in WMB. Climate extremists impede this progress, and offer no solutions. Their warped, Malthusian philosophy cares little for today’s human suffering.

Global energy consumption is going to continue increasing, because it drives higher living standards which are desired by at least half the world’s population. Non-OECD countries are forecast to increase their energy demand by half over the next twenty five years. Any serious impact on emissions will turn on the form in which this increased energy is delivered. China is the world’s biggest polluter and consumes half the world’s coal. If natural gas replaced all the world’s coal, it would lower CO2 emissions by 17%, an enormous change. The world isn’t about to make such a bold move, but because natural gas is expected to fulfill 45% of global demand growth through 2040, its gain in market share is contributing to a cleaner planet.

Finally, we show a slide on valuation. Valuation metrics such as Enterprise Value/EBITDA and yield have become less attractive for REITs and utilities in recent years, while they’ve moved in the opposite direction for midstream energy infrastructure. Investors know this well, but the macro outlook for natural gas must surely mean that a company such as WMB, positioned as well as anyone to profit, is cheap and should be substantially higher.

We are invested in WMB.

MLPs Weak in November, As Usual

The Alerian MLP Index now has almost a 24 year history. Investors whose experience pre-dates the 2014 high will fondly recall many strong years. Since 1996 the compounded annual return is 11.3% including distributions, even though the AMZX remains 44% off its August 2014 high.

MLPs are a shrinking part of the midstream energy infrastructure sector, and the AMZX omits many of North America’s biggest pipeline companies, because they’re corporations not MLPs. Flows in MLPs and related funds are still dominated by retail investors, which is why the January effect has historically been more impactful than is generally the case for the S&P500.

The human tendency to take stock of one’s portfolio around year’s end is exacerbated by the impact of K-1s. Sell an MLP in December rather than January, and you’ll avoid a K-1 for that one month of the new year. Similarly, a purchase delayed from December to January avoids a K-1 for the last month of the prior year. Both these effects tend to lift prices in January versus December.

Tax loss selling is another feature that tends to weigh later in the year. U.S. equities are owned in large part by institutions that are often tax exempt, so tax planning has a more muted effect on the broader market.

Consequently, MLPs exhibit the seasonal pattern shown in the chart above. It may be some comfort for investors to be reminded that November is historically the best time to make investments in the sector. You’ll also note a smaller pattern around quarterly distributions, which generally fall in the middle of the quarter. Investors tend to avoid selling when a new distribution is imminent, so returns in the first month of the quarter are usually above average. It ought to make no difference at all – stock prices adjust for dividends paid when they go ex-dividend. Nonetheless, the pattern further suggests that sales made in the first month of the quarter will on average draw a higher price.

January stands out as a very strong month, returning three times the monthly average.

In recent years familiar patterns have been less reliable, including the tendency for MLPs to outperform the equity market (yes, they used to do that). The seasonals of the past five years reveal a very different pattern. As the sector has slumped, a clear trend has emerged of investors selling during the fourth quarter. The first half of the year has remained stronger than the second half, although oddly April has been better than January. Perhaps planned January purchases have been delayed because of prior weakness.

So far, October and November are continuing the pattern of 4Q weakness seen in recent years. We know anecdotally that tax loss selling has been a factor for some investors. It still looks to us as if a bounce in the early part of the new year remains likely. Sentiment is certainly consistent with current prices providing a near term low.

MLP seasonals remain interesting because of what they tell us about past retail investor behavior. Nonetheless, the MLP sector remains too small with too few well managed companies to justify a significant allocation. The American Energy Independence Index is 80% corporations with just a handful of MLPs. It’s +13% YTD compared with -5% for AMZX, starkly illustrating the preference investors have for pipeline corporations over MLPs, and the steady exit of retail investors from MLP-dominated products. Note that you cannot invest directly in an index.

We manage an ETF which seeks to track the American Energy Independence Index.

SL Advisors is the sub-advisor to the Catalyst MLP & Infrastructure Fund. To learn more about the Fund, please click here.

Tallgrass Endgame Approaches

Most sell-side analysts are constrained in providing critical analysis of the companies they cover, because their firms are usually trying to do investment banking business with them. In spite of all the regulations intended to create a separation between research and banking, typically less than 10% of analyst ratings are a sell (see Why Wall Street analysts almost never put ‘sell’ ratings on stocks they cover).

Blackstone (BX) and Tallgrass (TGE) recent showed how a publicly traded partnership can promote management’s interests at the expense of other investors (see Blackstone and Tallgrass Further Discredit the MLP Model). Few were openly critical, because it conflicts with their business model. R. W. Baird’s Ethan Bellamy is one of the few whose integrity isn’t for sale. Morningstar’s Stephen Ellis spoke plainly because his company doesn’t offer banking services. Others obliquely referred to the controversial sideletter. To recap, BX acquired 44% of TGE earlier this year. If BX agreed to buy the rest of TGE within a year, a sideletter guaranteed TGE management a fixed price for their LP units, thus breaking the alignment of interests between owners and management. As TGE sank during the summer, the odds of BX seeking the rest rose. A weak stock price for TGE made the sideletter more valuable. It looked like a put option.

On Monday, David Dehaemers announced his imminent retirement from Tallgrass, where he did much right as founder and CEO. The eastbound Rockies Express natural gas had seemingly little future with new Marcellus natural gas competing for midwest customers. He oversaw a partial flow reversal, cleverly adapting to new patters of supply. The sideletter and his tone-deaf defense of it were a disappointing departure from his normal straight talk. It caused us to ask of other pipeline companies organized as partnerships how we might get comfortable that they wouldn’t also “do a Tallgrass”. It caused us to ask ourselves, and to question publicly, why we as asset managers should invest in companies whose ethical standards fall so far below those imposed on us by regulation and good practice.

There are some well-run companies in this sector. The three big Canadians (Enbridge (ENB), Pembina (PBA) and TC Energy (TRP)) are shining examples of investor-oriented, prudent management. Most U.S. pipeline companies would be better investments if they were run like Canada’s (see Canadian Pipelines Lead The Way). Enterprise Products Partners (EPD) and Magellan Midstream (MMP) are among the better run American companies. Crestwood (CEQP) in recent years has been well led by Bob Phillips.

It’s likely the investor outcry over the TGE sideletter hastened Dehaemers’ retirement, although he had indicated he was likely to leave by the end of this year. On TGE’s most recent earnings call, he blamed selling institutions for weakening TGE such that BX was induced to offer to buy the rest of TGE at below their original purchase price. It was as if he blamed the selling for embarrassing him by drawing attention to the sideletter, although this document was working as designed in protecting him from TGE’s downside.

It’s unclear what this tells us about the likelihood of TGE accepting BX’s proposal. TGE trades 7% below BX’s $19.50 offer, which was made three months ago. We helped highlight the unfair sideletter’s bias towards management. If ultimately BX buys the rest of TGE at a fair price without the special provisions for management, that will be a win for plain speaking. Not that long ago, David Dehaemers would have agreed.

We have only a minor investment in TGE

image_pdfimage_print