Private Equity, Private Valuations
/0 Comments/in Midstream Energy Infrastructure, Uncategorized/by Jaclyn RodriguezLast week Cowen held a two day energy conference. Presenting companies included upstream and service providers, so although there were no midstream energy infrastructure companies present it provided useful background for current operating conditions.
Baker Hughes (BKR) is one of three large diversified services companies supporting the sector, along with Schlumberger and Halliburton. BKR CFO Brian Worrell provided an upbeat outlook following their recent spinout from GE. They cleverly describe themselves as a “fullstream” company (i.e., covering upstream to downstream). Listening to Worrell, it’d be hard to remember how negative investor sentiment is within energy. Consensus estimates for BKR’s 2019-21 EBITDA growth rate are 15%.
Worrell provided some interesting background on a partnership they have with AI firm C3. Predictive Asset Maintenance, one of their offerings, analyzes operating data from customer equipment to anticipate breakdowns, allowing repairs to be done pre-emptively. BKR is C3’s exclusive partner in the energy sector. They have 200 customers.
Another interesting theme was the influence of Private Equity (PE) investors. Independence Contract Drilling (ICD) is a micro-cap drilling company clearly wrestling with the downturn in shale-related rig demand. One participant asked if they’d considered a sale or merger. President and CEO Anthony Gallegos noted a recent negotiation with a competing privately owned firm which foundered when the PE backer insisted their drilling rigs were worth $18MM each while ICD’s stock price placed an implicit value of only $6MM for its similar equipment.
There’s plenty of evidence that PE firms assess more value in publicly traded energy sector equities than the public markets themselves. PE investments in midstream energy infrastructure have slowed down in recent months, although it’s still been an active year. But there are questions about valuation.
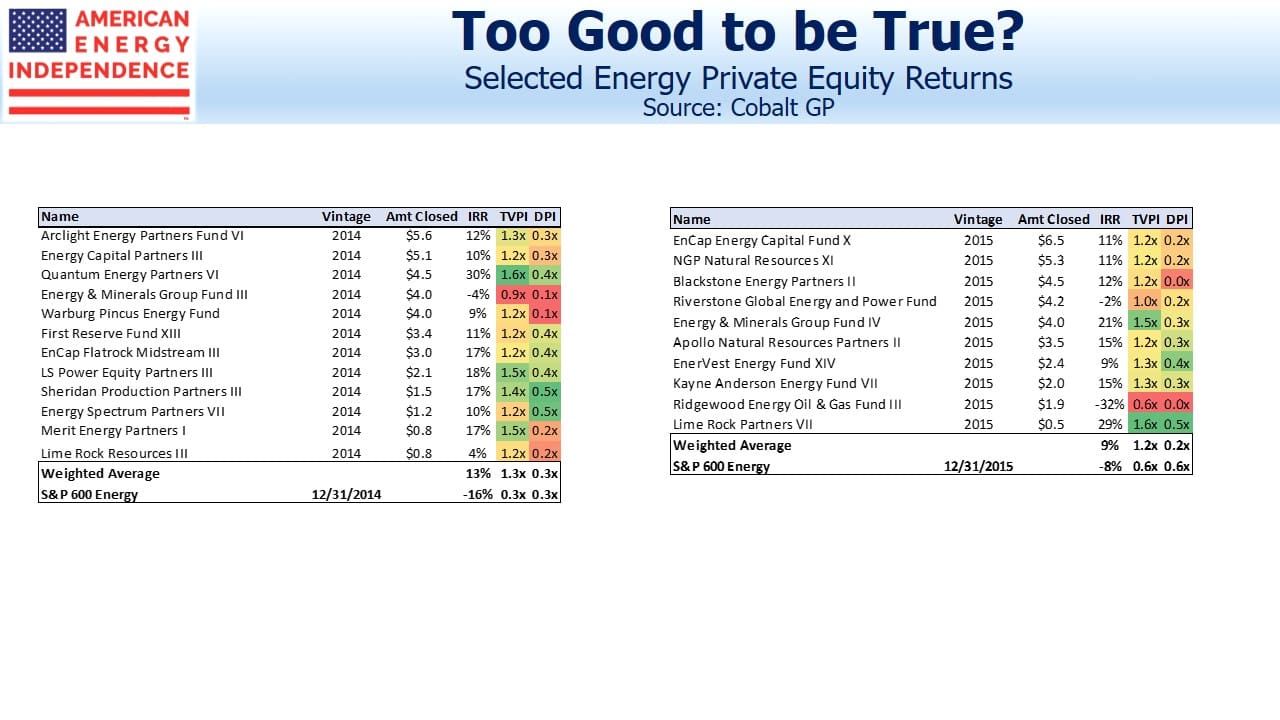
Energy-focused PE funds saw their highest inflows in 2014, when the sector peaked. This isn’t surprising, since fund flows invariably follow performance. But what’s odd is that fund returns since then are well ahead of the S&P600 Energy Index.
Although PE funds deploy capital over several years and likely made investments through the 2016 low, the recovery since then has been modest. It suggests that valuations are not rigorous – PE firms have a great deal of latitude in making estimates. Fees and the ability to raise subsequent funds both benefit from higher valuations.
PE energy funds continue to raise capital, supported in part by the returns they show on prior funds. The illiquidity of private investments is supposed to generate a modest return premium, but research from Cobalt GP reveals that so far these funds are claiming to beat public markets by 15-30%. Total Value to Paid In (TVPI) suggests these fund managers have chosen well, and is the basis for their IRRs. But Distributions to Paid In (DPI) are well under 1.0X even for funds that are five years old, showing that the IRRs rely heavily on the valuations of current holdings. As cash distributions increase, the time of reckoning will arrive when investors will learn how accurate these interim IRRs have been.
On a different topic, the magazine cover contrary indicator theory posits that when a topic or person becomes mainstream, interest soon peaks. Credit friend Barry Knapp, CEO and founder of Ironsides Macroeconomics, for being first to predict that high school dropout Greta Thunberg’s selection as Time’s Person of the Year likely marks a peak in interest in climate change.
Enlink’s Growth Plans Need Better Justification
/3 Comments/in Midstream Energy Infrastructure/by Jaclyn RodriguezEnergy investors would still like to see less spending on growth projects than company executives are pursuing. Whenever a CEO announces new spending, there’s a palpable lack of enthusiasm. Given valuations, many companies could easily justify buying back stock as a higher return use of capital than building new infrastructure. The message is getting through, but not quickly enough in the opinion of many.
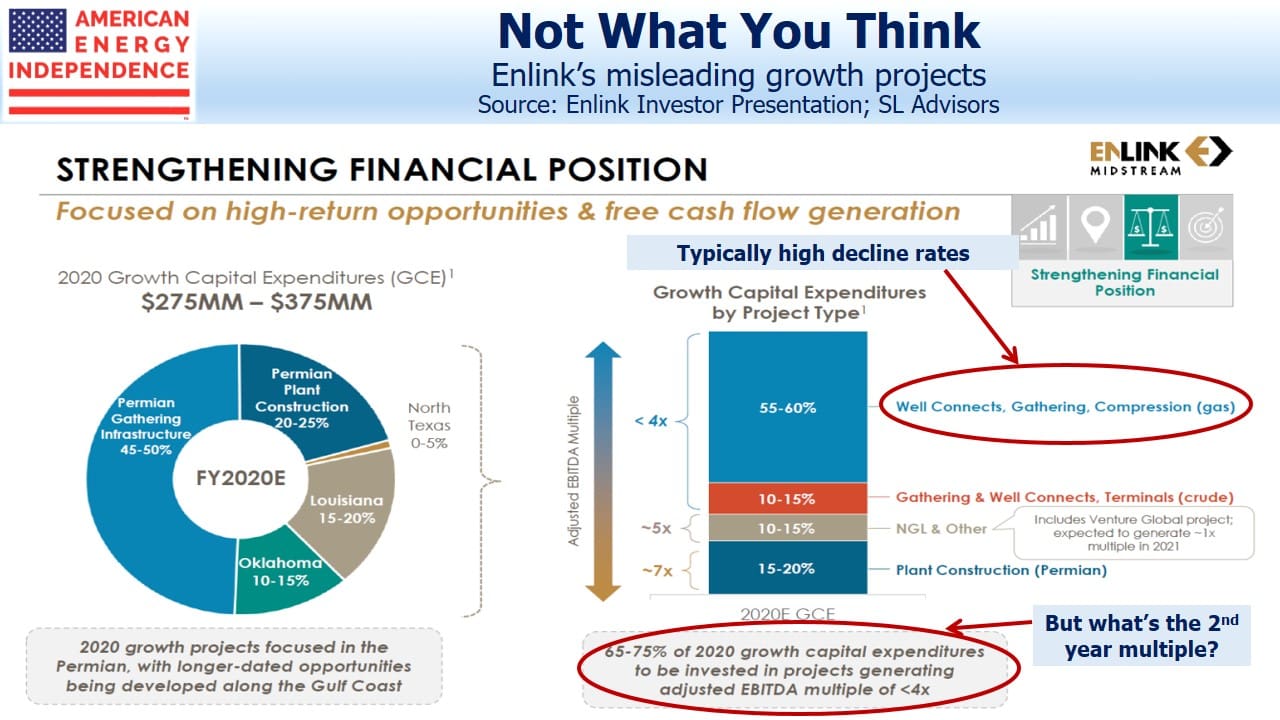
Part of the problem is the way companies present their growth plans. A recent investor presentation from Enlink (ENLC) illustrates the problem. Their 2020 Growth Capital Expenditures (“capex”) are listed as $275-375MM. The collapse in ENLC’s stock price this year has driven their dividend yield up to 25%, a lofty level they plan to maintain. Since stock repurchased would therefore generate a 25% return as they claim DCF coverage >1X, it’s hard to believe they carried out a rigorous analysis on where they plan to invest cash that clearly won’t be used to buy back stock. Theoretically, their capex plans will yield a higher return that their stock, the implausibility of which casts further doubt on their capital allocation.
However, the problem with the presentation is the focus on EBITDA multiples to illustrate the attractiveness of their capital program. Over two thirds of their projects will generate an adjusted EBITDA multiple of <4X. In other words, $100 invested will generate better than $25 of EBITDA.
By coincidence, ENLC’s projects offer a return similar to their dividend yield, perhaps justifying them as a better use of scarce funds rather than buybacks. But over half the projects are for natural gas well connects, gathering and compression. These are not long distance transportation pipelines, but narrow lines running to individual wells. Their volumes will begin strongly and deplete as output from the wells they’re servicing depletes.
The point is that projects should be evaluated on an NPV basis, taking account of all the future cashflows. An EBITDA multiple is a shorthand way of comparing projects, and only makes sense when that EBITDA is stable or growing. ENLC’s CFO presumably doesn’t assess projects that way.
The types of project ENLC is planning have declining EBITDA. Including them in their presentation the way ENLC does creates a misleading impression of highly attractive investments. When we asked ENLC about the absence of any decline assumption in their own capex guidance, they referred us to Devon Energy’s (DVN) comments on the issue. DVN is the big customer whose production ENLC’s capex are intended to service. DVN has forecast production declines rates from “high 20% to high 30%”. DVN isn’t claiming that production will be stable. So why is ENLC using the first year’s cash flow to justify the capex in its presentation?
ENLC must know that presenting an investment based on the first year’s cashflow doesn’t fairly present the longer term outlook. They should either model the EBITDA over several years to show the decline rate they expect, or present the NPV analysis that they’ve presumably done internally before committing capital. A cynic might believe ENLC is doing projects with a negative NPV because the first year’s EBITDA flatters their leverage ratio, temporarily boosting EBITDA and thereby lowering Debt:EBITDA.
Energy companies are being criticized for poor capital allocation – a more transparent and rigorous explanation of spending would help ease investor concerns.
ENLC has plenty of room for improvement in this area. We hope they do. We are invested in ENLC and believe it’s cheap. The market is not giving energy management teams the benefit of the doubt and their stock would benefit from our suggested improvements in their presentation.
Williams Companies Promotes the Little Blue Flame
/8 Comments/in Midstream Energy Infrastructure/by Jaclyn RodriguezLast Thursday Williams Companies (WMB) held their investor day in New York. WMB owns and operates an extensive natural gas network, and is a top ten U.S. midstream energy infrastructure company. Like most big pipeline companies, it’s omitted from the Alerian MLP indices because it’s not an MLP. CEO Alan Armstrong conceded that the company had in recent years become too closely identified with the oil business and fracking. He said they need to refocus attention on the little blue flame in every kitchen’s stovetop, emphasizing a cleaner, more positive message.
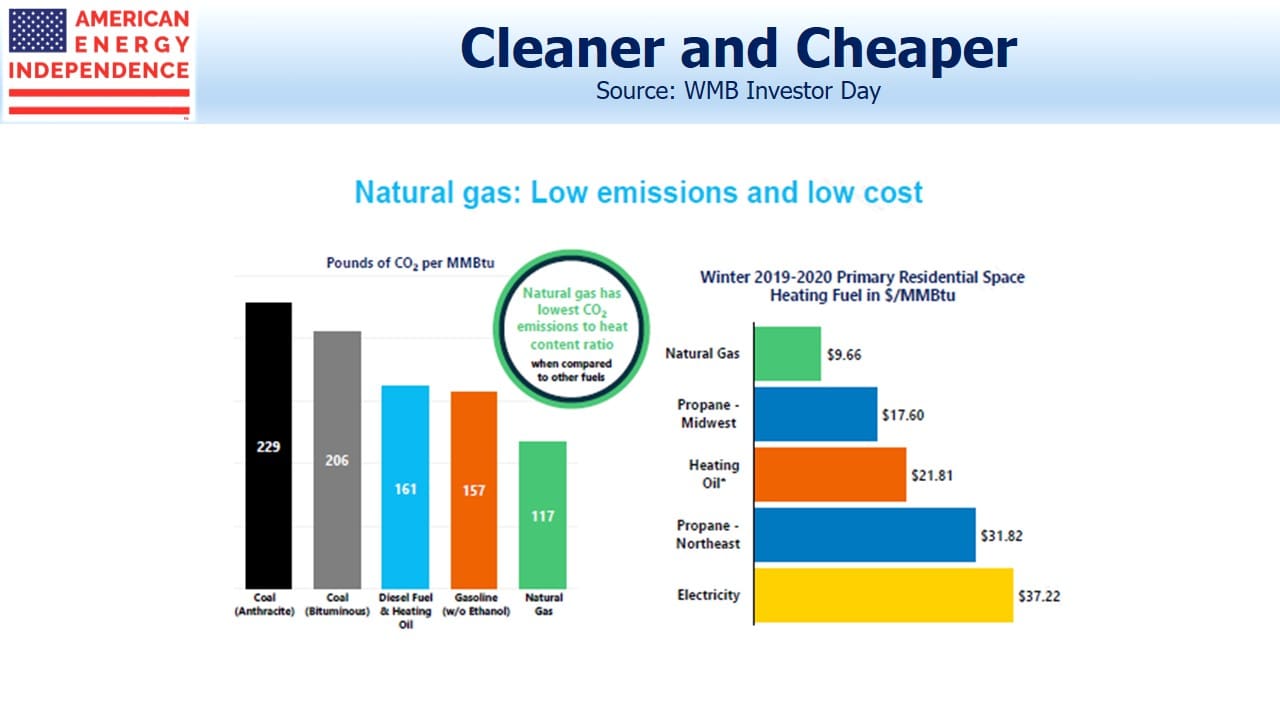
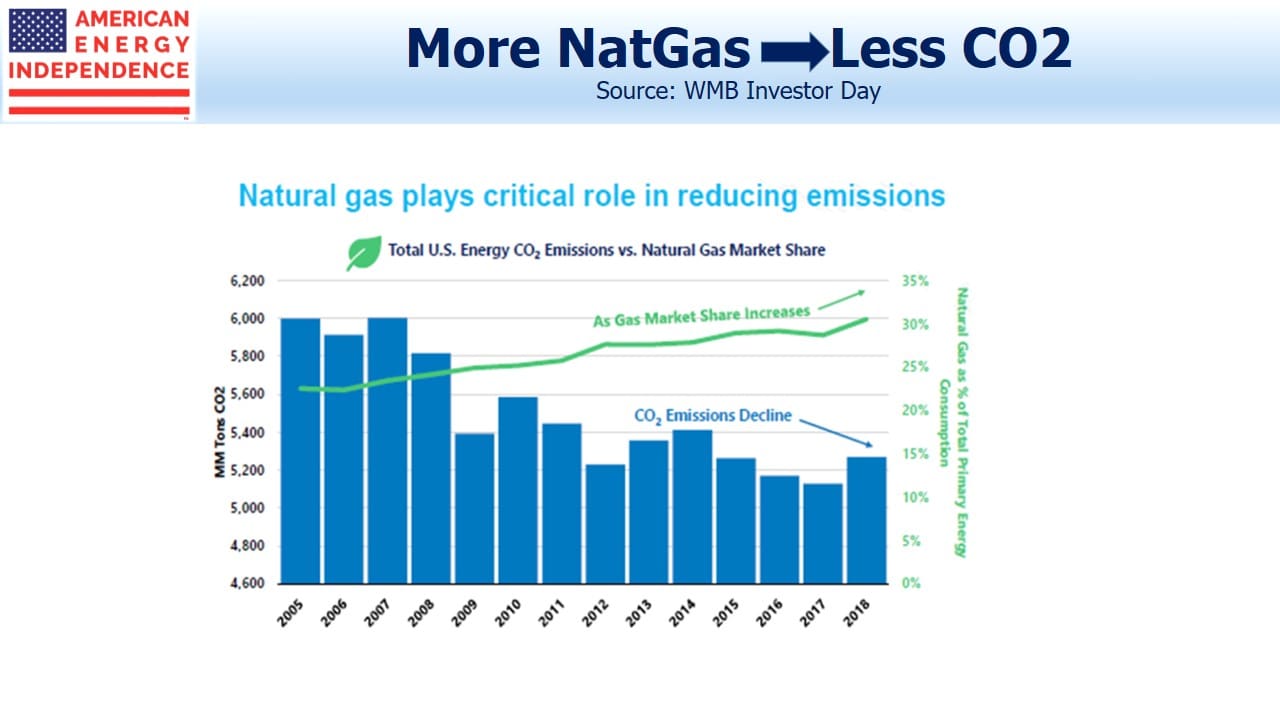
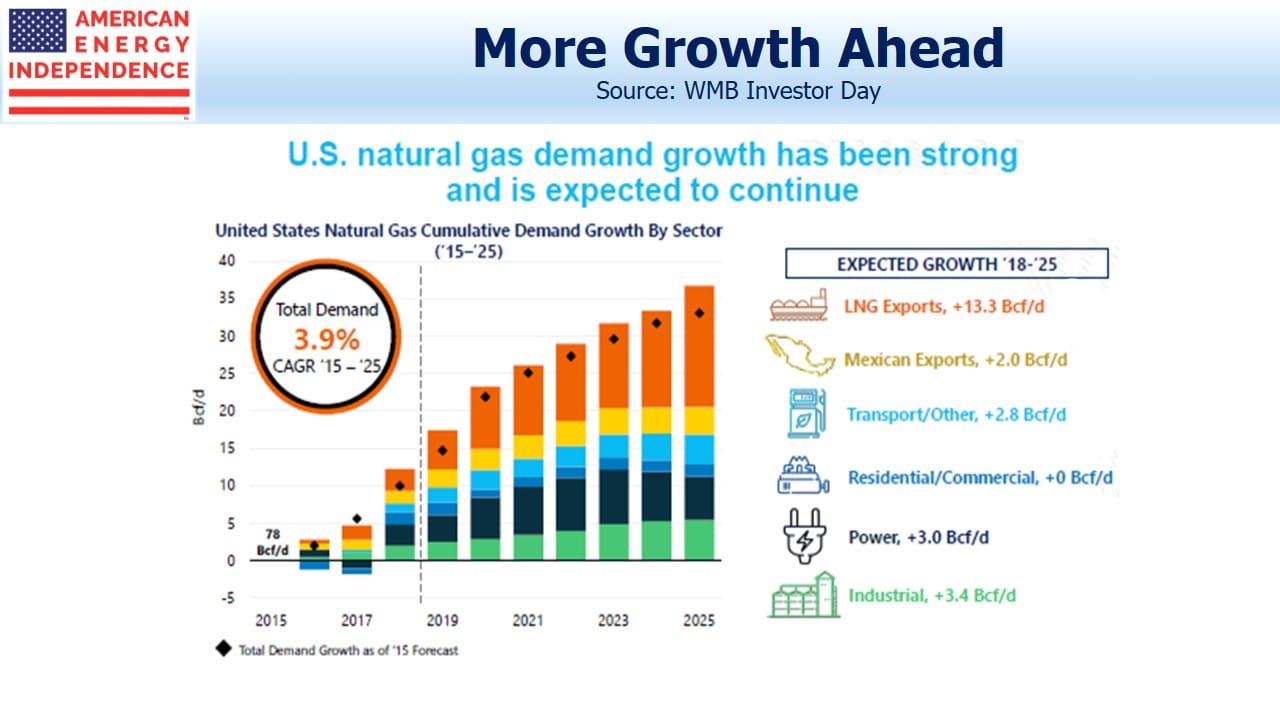
Their presentation opened with some useful slides on the long term, global outlook for natural gas. Although most investors in this sector follow crude oil prices because they drive sentiment among energy investors, our investments are more focused on natural gas because it’s the cleanest burning fossil fuel and we believe has a clearer growth path over the next several decades.
The Shale Revolution has produced an abundance of natural gas in America, which means that it’s not only cleaner than other fossil fuels but also the cheapest form of residential heating. So far, the benefits of this abundance have flowed to the consumers of cheap energy and not the producers, as energy investors know well. Figuring out how to better monetize America’s energy renaissance consumes management teams and investors.
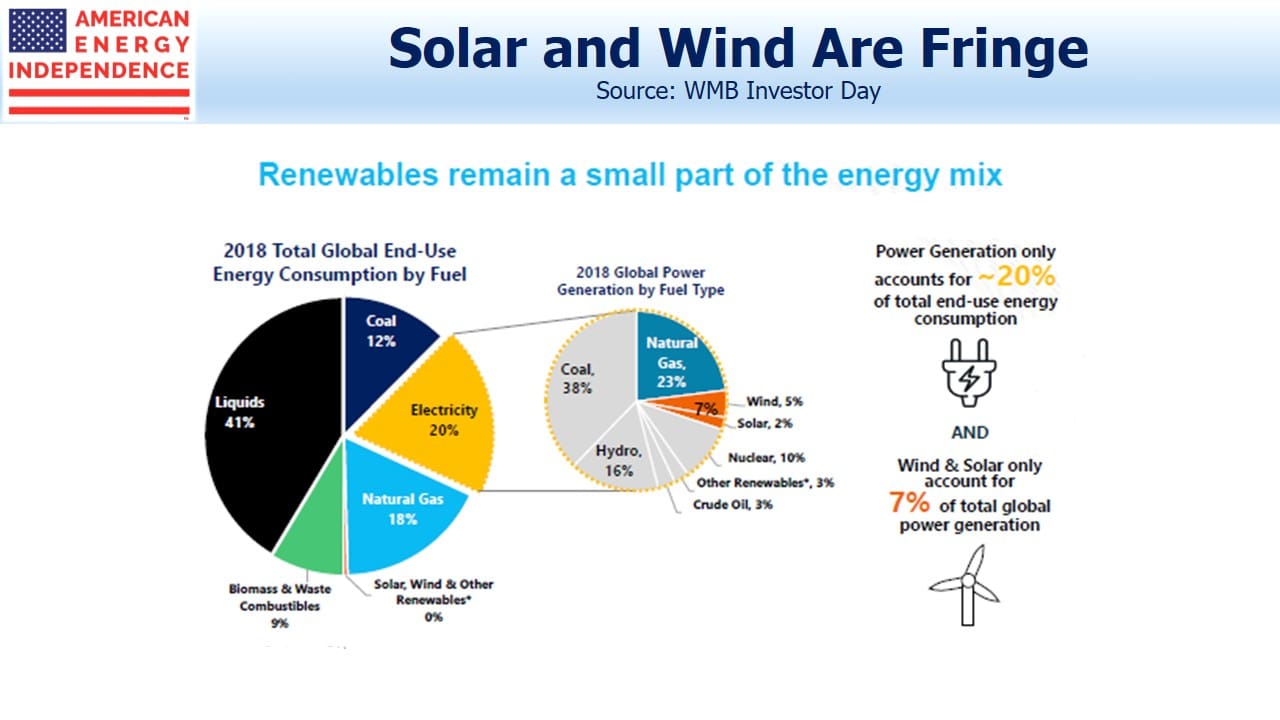
Substantial press coverage is focused on climate change and the opportunity of renewables to impede global warming. Solar and wind remain fringe sources of overall energy, a statement often regarded as incendiary by climate extremists but easily supported in the above chart. Electricity is 20% of global end-use energy consumption, with solar and wind providing 2% and 5% respectively. So at 7% of power generation, which is itself 20% of global energy use, they’re 1.4% of the total. Natural gas substitution for coal has been far more effective in lowering emissions, and attracts thoughtful advocates for cleaner energy.
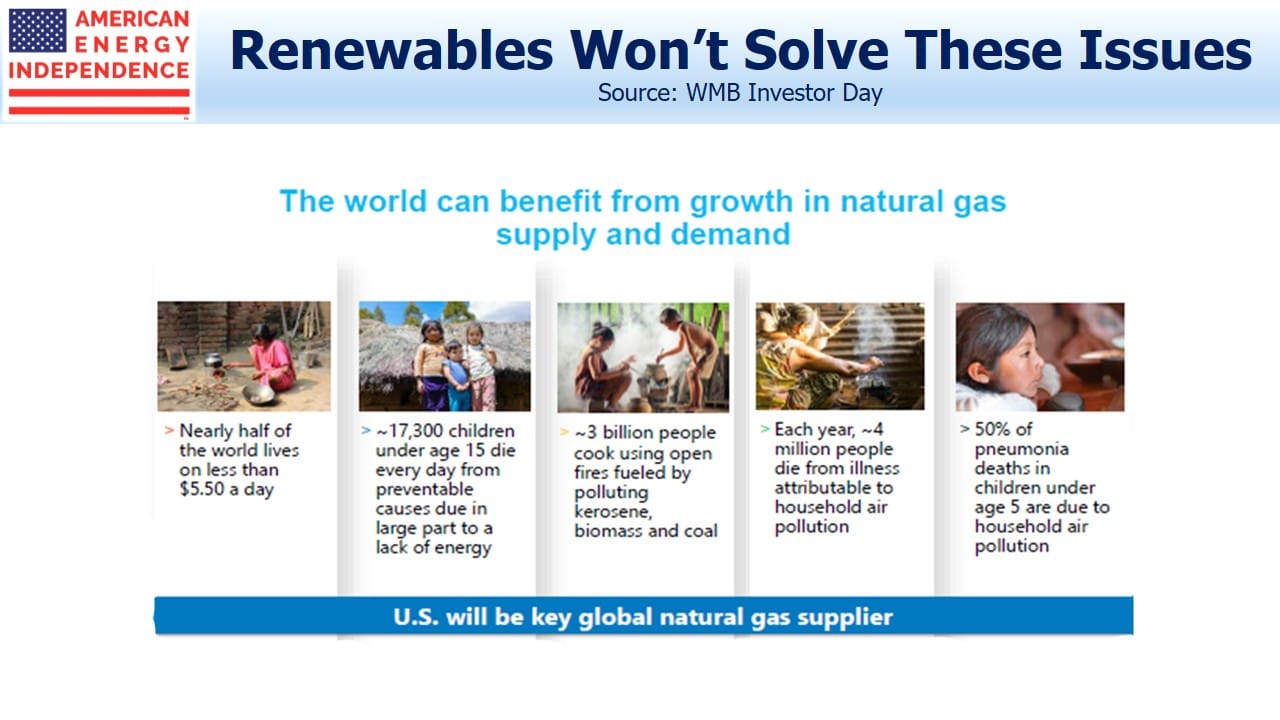
An estimated 17,300 children younger than 15 die every day because of insufficient access to energy, according to UNICEF (the United Nations Children’s Fund). The moral high ground is solidly occupied by those engaged in providing more energy to poor countries, including investors in WMB. Climate extremists impede this progress, and offer no solutions. Their warped, Malthusian philosophy cares little for today’s human suffering.
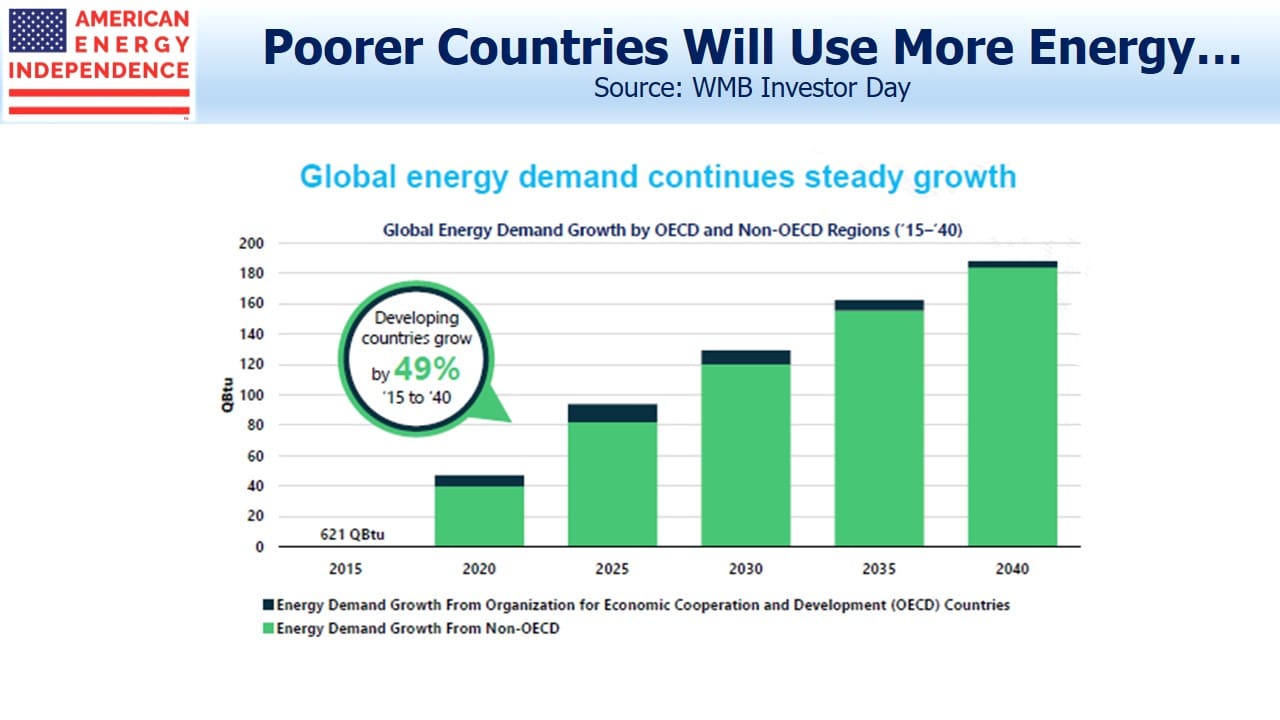
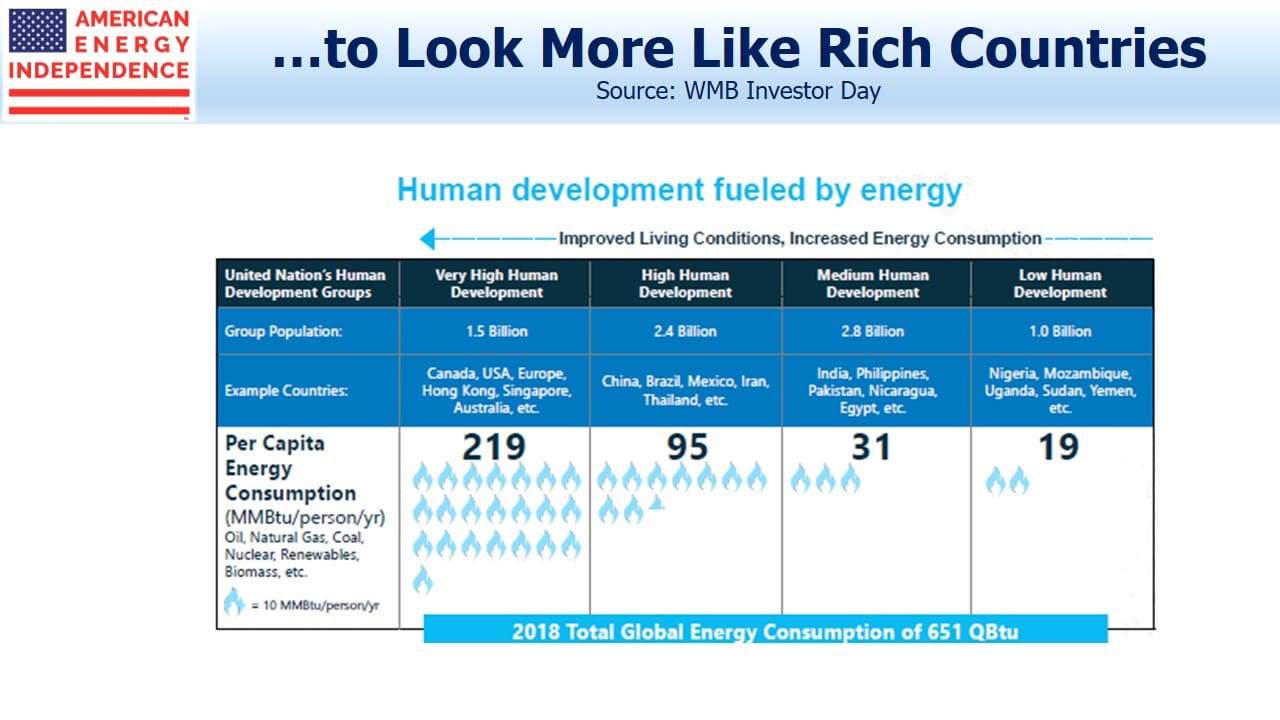
Global energy consumption is going to continue increasing, because it drives higher living standards which are desired by at least half the world’s population. Non-OECD countries are forecast to increase their energy demand by half over the next twenty five years. Any serious impact on emissions will turn on the form in which this increased energy is delivered. China is the world’s biggest polluter and consumes half the world’s coal. If natural gas replaced all the world’s coal, it would lower CO2 emissions by 17%, an enormous change. The world isn’t about to make such a bold move, but because natural gas is expected to fulfill 45% of global demand growth through 2040, its gain in market share is contributing to a cleaner planet.
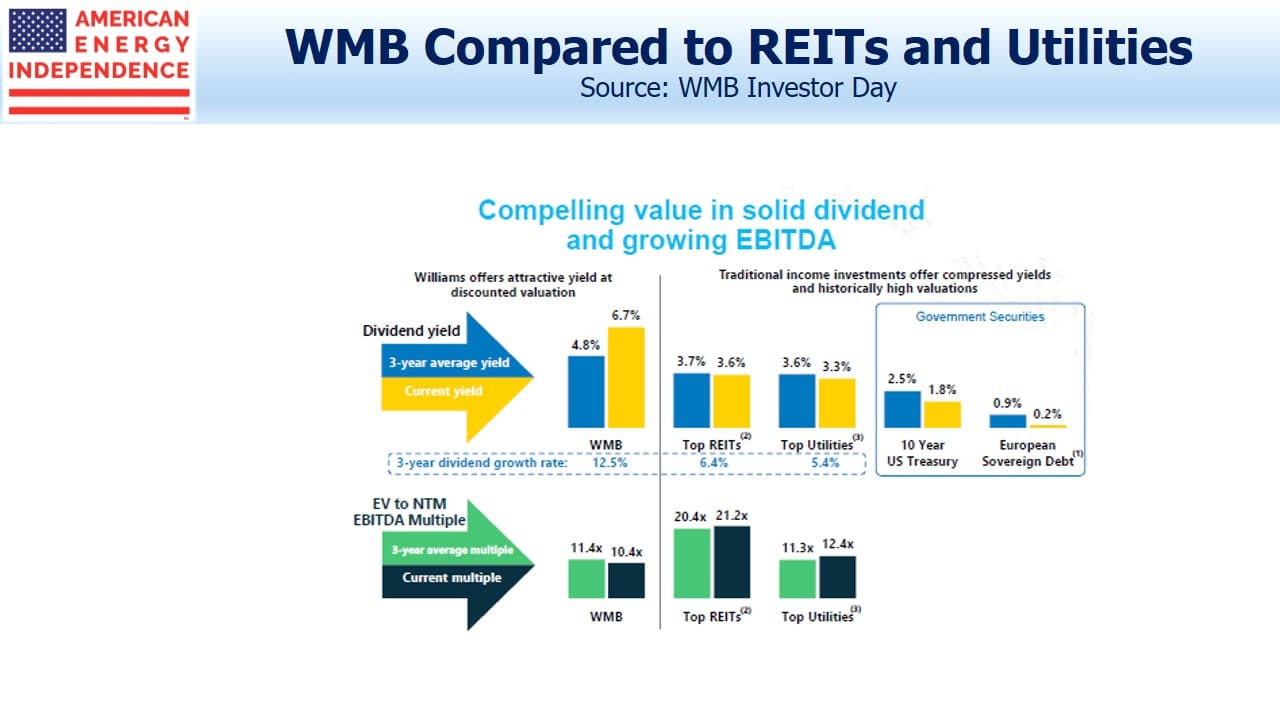
Finally, we show a slide on valuation. Valuation metrics such as Enterprise Value/EBITDA and yield have become less attractive for REITs and utilities in recent years, while they’ve moved in the opposite direction for midstream energy infrastructure. Investors know this well, but the macro outlook for natural gas must surely mean that a company such as WMB, positioned as well as anyone to profit, is cheap and should be substantially higher.
We are invested in WMB.
MLPs Weak in November, As Usual
/1 Comment/in Midstream Energy Infrastructure/by Jaclyn RodriguezThe Alerian MLP Index now has almost a 24 year history. Investors whose experience pre-dates the 2014 high will fondly recall many strong years. Since 1996 the compounded annual return is 11.3% including distributions, even though the AMZX remains 44% off its August 2014 high.
MLPs are a shrinking part of the midstream energy infrastructure sector, and the AMZX omits many of North America’s biggest pipeline companies, because they’re corporations not MLPs. Flows in MLPs and related funds are still dominated by retail investors, which is why the January effect has historically been more impactful than is generally the case for the S&P500.
The human tendency to take stock of one’s portfolio around year’s end is exacerbated by the impact of K-1s. Sell an MLP in December rather than January, and you’ll avoid a K-1 for that one month of the new year. Similarly, a purchase delayed from December to January avoids a K-1 for the last month of the prior year. Both these effects tend to lift prices in January versus December.
Tax loss selling is another feature that tends to weigh later in the year. U.S. equities are owned in large part by institutions that are often tax exempt, so tax planning has a more muted effect on the broader market.
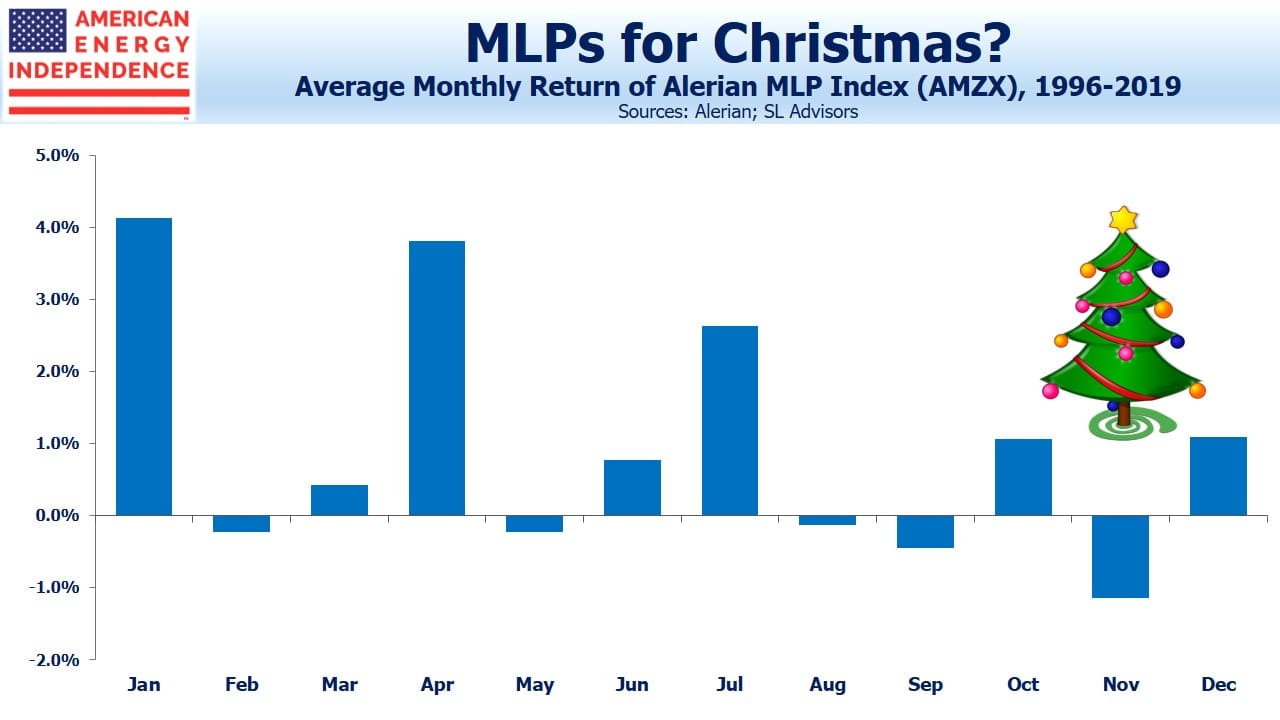
Consequently, MLPs exhibit the seasonal pattern shown in the chart above. It may be some comfort for investors to be reminded that November is historically the best time to make investments in the sector. You’ll also note a smaller pattern around quarterly distributions, which generally fall in the middle of the quarter. Investors tend to avoid selling when a new distribution is imminent, so returns in the first month of the quarter are usually above average. It ought to make no difference at all – stock prices adjust for dividends paid when they go ex-dividend. Nonetheless, the pattern further suggests that sales made in the first month of the quarter will on average draw a higher price.
January stands out as a very strong month, returning three times the monthly average.
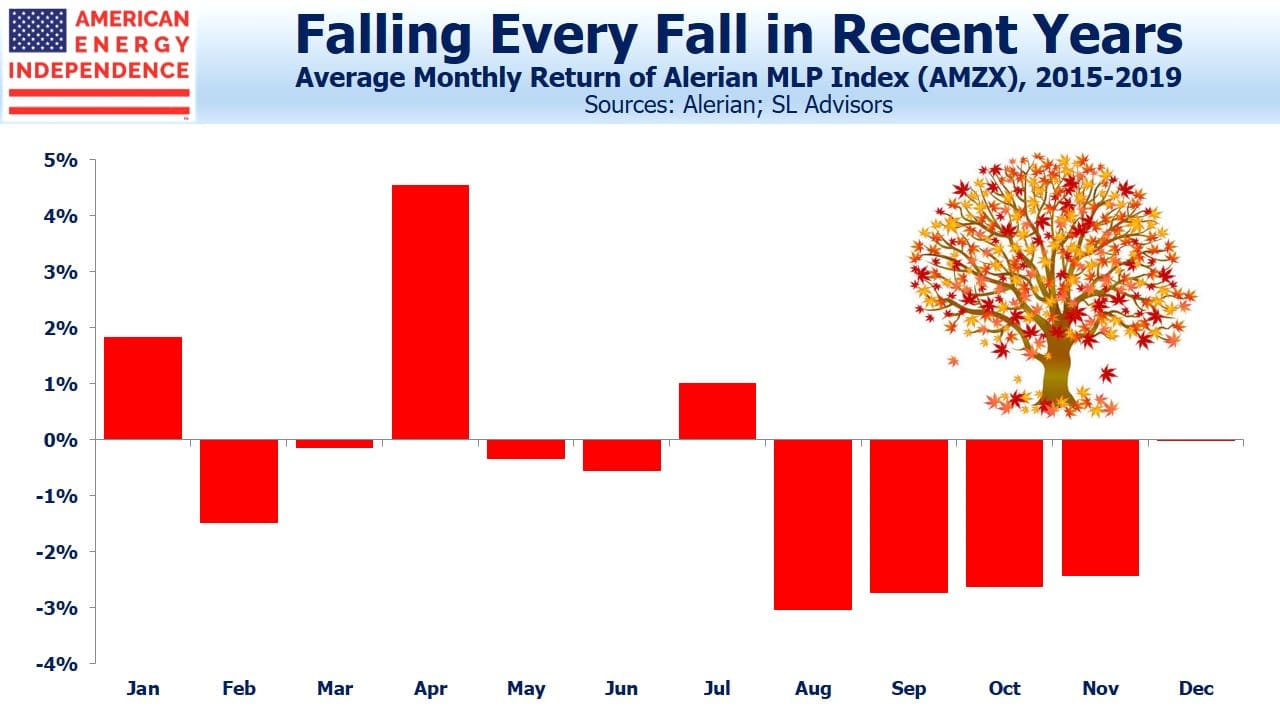
In recent years familiar patterns have been less reliable, including the tendency for MLPs to outperform the equity market (yes, they used to do that). The seasonals of the past five years reveal a very different pattern. As the sector has slumped, a clear trend has emerged of investors selling during the fourth quarter. The first half of the year has remained stronger than the second half, although oddly April has been better than January. Perhaps planned January purchases have been delayed because of prior weakness.
So far, October and November are continuing the pattern of 4Q weakness seen in recent years. We know anecdotally that tax loss selling has been a factor for some investors. It still looks to us as if a bounce in the early part of the new year remains likely. Sentiment is certainly consistent with current prices providing a near term low.
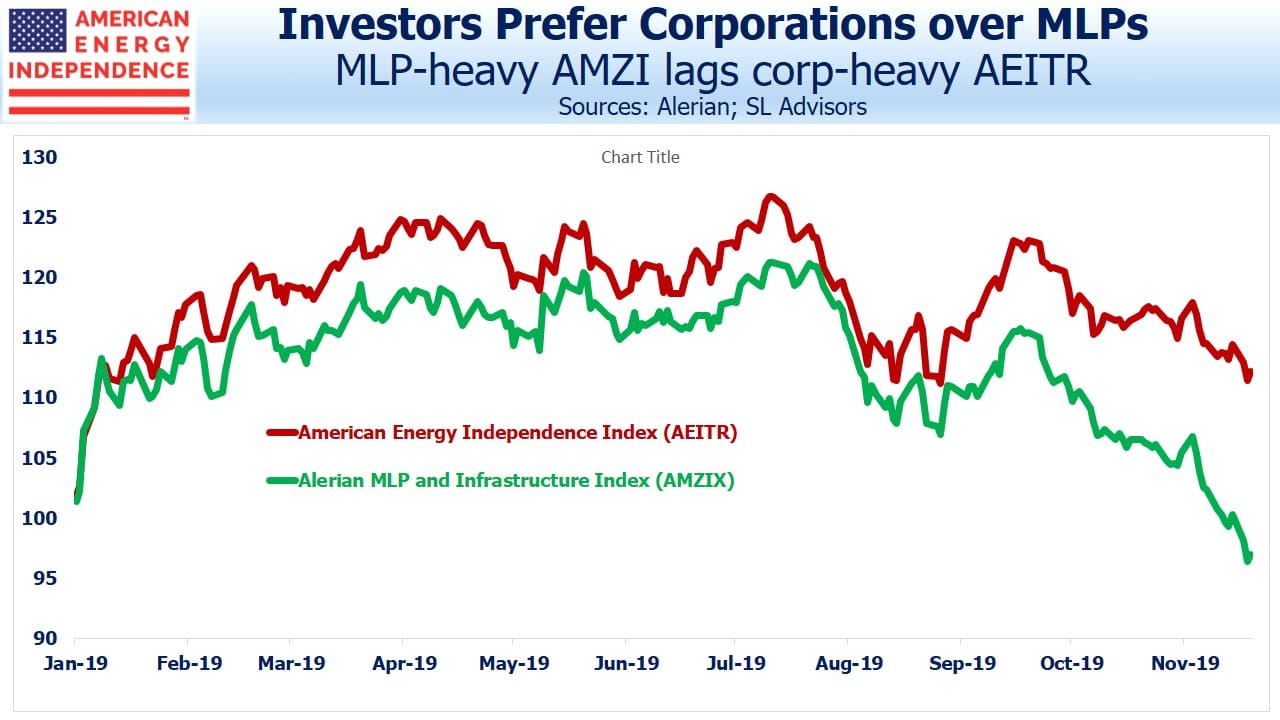
MLP seasonals remain interesting because of what they tell us about past retail investor behavior. Nonetheless, the MLP sector remains too small with too few well managed companies to justify a significant allocation. The American Energy Independence Index is 80% corporations with just a handful of MLPs. It’s +13% YTD compared with -5% for AMZX, starkly illustrating the preference investors have for pipeline corporations over MLPs, and the steady exit of retail investors from MLP-dominated products. Note that you cannot invest directly in an index.
We manage an ETF which seeks to track the American Energy Independence Index.
SL Advisors is the sub-advisor to the Catalyst MLP & Infrastructure Fund. To learn more about the Fund, please click here.
Tallgrass Endgame Approaches
/3 Comments/in Midstream Energy Infrastructure/by Jaclyn RodriguezMost sell-side analysts are constrained in providing critical analysis of the companies they cover, because their firms are usually trying to do investment banking business with them. In spite of all the regulations intended to create a separation between research and banking, typically less than 10% of analyst ratings are a sell (see Why Wall Street analysts almost never put ‘sell’ ratings on stocks they cover).
Blackstone (BX) and Tallgrass (TGE) recent showed how a publicly traded partnership can promote management’s interests at the expense of other investors (see Blackstone and Tallgrass Further Discredit the MLP Model). Few were openly critical, because it conflicts with their business model. R. W. Baird’s Ethan Bellamy is one of the few whose integrity isn’t for sale. Morningstar’s Stephen Ellis spoke plainly because his company doesn’t offer banking services. Others obliquely referred to the controversial sideletter. To recap, BX acquired 44% of TGE earlier this year. If BX agreed to buy the rest of TGE within a year, a sideletter guaranteed TGE management a fixed price for their LP units, thus breaking the alignment of interests between owners and management. As TGE sank during the summer, the odds of BX seeking the rest rose. A weak stock price for TGE made the sideletter more valuable. It looked like a put option.
On Monday, David Dehaemers announced his imminent retirement from Tallgrass, where he did much right as founder and CEO. The eastbound Rockies Express natural gas had seemingly little future with new Marcellus natural gas competing for midwest customers. He oversaw a partial flow reversal, cleverly adapting to new patters of supply. The sideletter and his tone-deaf defense of it were a disappointing departure from his normal straight talk. It caused us to ask of other pipeline companies organized as partnerships how we might get comfortable that they wouldn’t also “do a Tallgrass”. It caused us to ask ourselves, and to question publicly, why we as asset managers should invest in companies whose ethical standards fall so far below those imposed on us by regulation and good practice.
There are some well-run companies in this sector. The three big Canadians (Enbridge (ENB), Pembina (PBA) and TC Energy (TRP)) are shining examples of investor-oriented, prudent management. Most U.S. pipeline companies would be better investments if they were run like Canada’s (see Canadian Pipelines Lead The Way). Enterprise Products Partners (EPD) and Magellan Midstream (MMP) are among the better run American companies. Crestwood (CEQP) in recent years has been well led by Bob Phillips.
It’s likely the investor outcry over the TGE sideletter hastened Dehaemers’ retirement, although he had indicated he was likely to leave by the end of this year. On TGE’s most recent earnings call, he blamed selling institutions for weakening TGE such that BX was induced to offer to buy the rest of TGE at below their original purchase price. It was as if he blamed the selling for embarrassing him by drawing attention to the sideletter, although this document was working as designed in protecting him from TGE’s downside.
It’s unclear what this tells us about the likelihood of TGE accepting BX’s proposal. TGE trades 7% below BX’s $19.50 offer, which was made three months ago. We helped highlight the unfair sideletter’s bias towards management. If ultimately BX buys the rest of TGE at a fair price without the special provisions for management, that will be a win for plain speaking. Not that long ago, David Dehaemers would have agreed.
We have only a minor investment in TGE
Canadian Pipelines Lead The Way
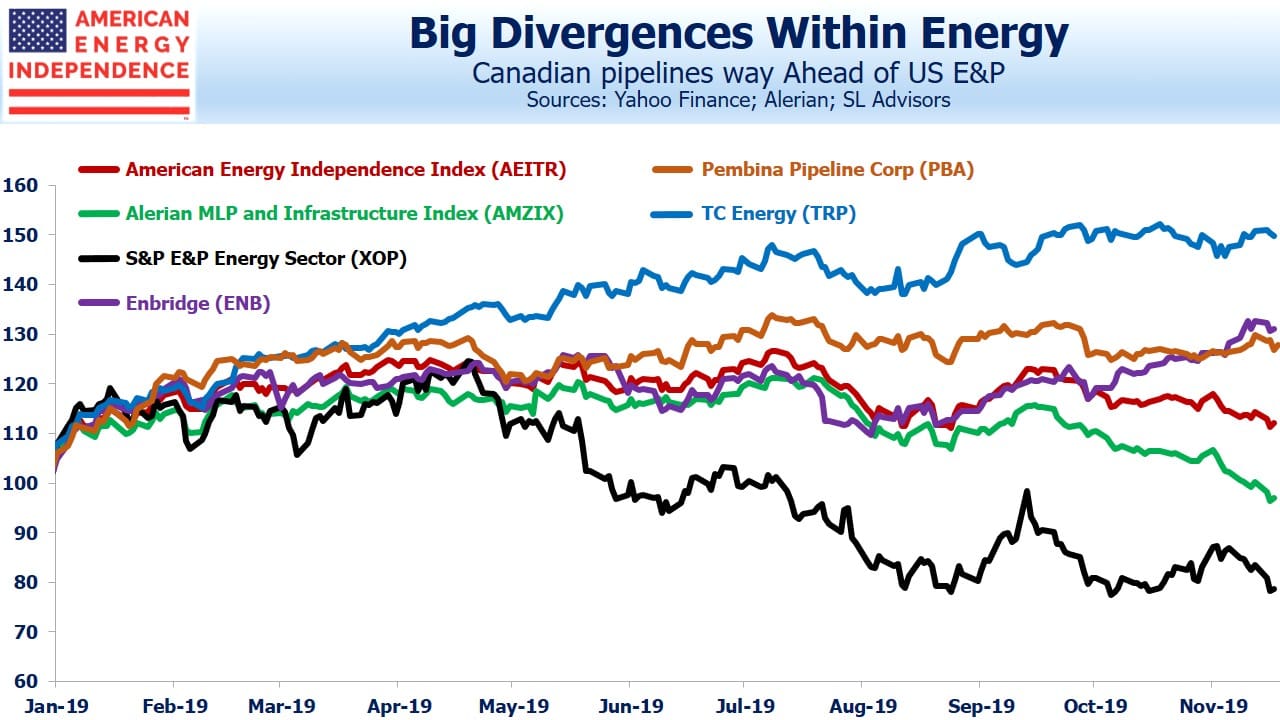
/0 Comments/in Midstream Energy Infrastructure/by Jaclyn RodriguezSentiment among energy investors remains poor. The S&P E&P ETF (XOP) is -21% for the year. Energy has sunk to 4% of the S&P500. The Alerian MLP Infrastructure index (AMZIX) is -3% YTD and reached a low of 44% off its August 2014 high last week. This contrasts with the S&P500, which is +26% for the year. MLP tax loss selling has caused further downward pressure, since so many investors have realized gains in other sectors to pair against energy losses.
Although energy has been weak, wide performance divergences exist. Midstream energy infrastructure has done far better than the E&P companies that are its principal customers. Within that, pipeline corporations have done better than MLPs, which continue to suffer from erosion of interest among their traditional income-seeking investor base. Canadian corporations are among the best performers. TC Energy (TRP, formerly Transcanada), is +50% for the year including dividends, even handily beating the S&P500 with its 26% gain. Few investors in midstream energy infrastructure realize how well TRP has performed, unless they own it. Enbridge (ENB), North America’s biggest midstream energy infrastructure company and also Canadian, is +31%. Pembina (PBA), a less well known Canadian pipeline company, is +27%.
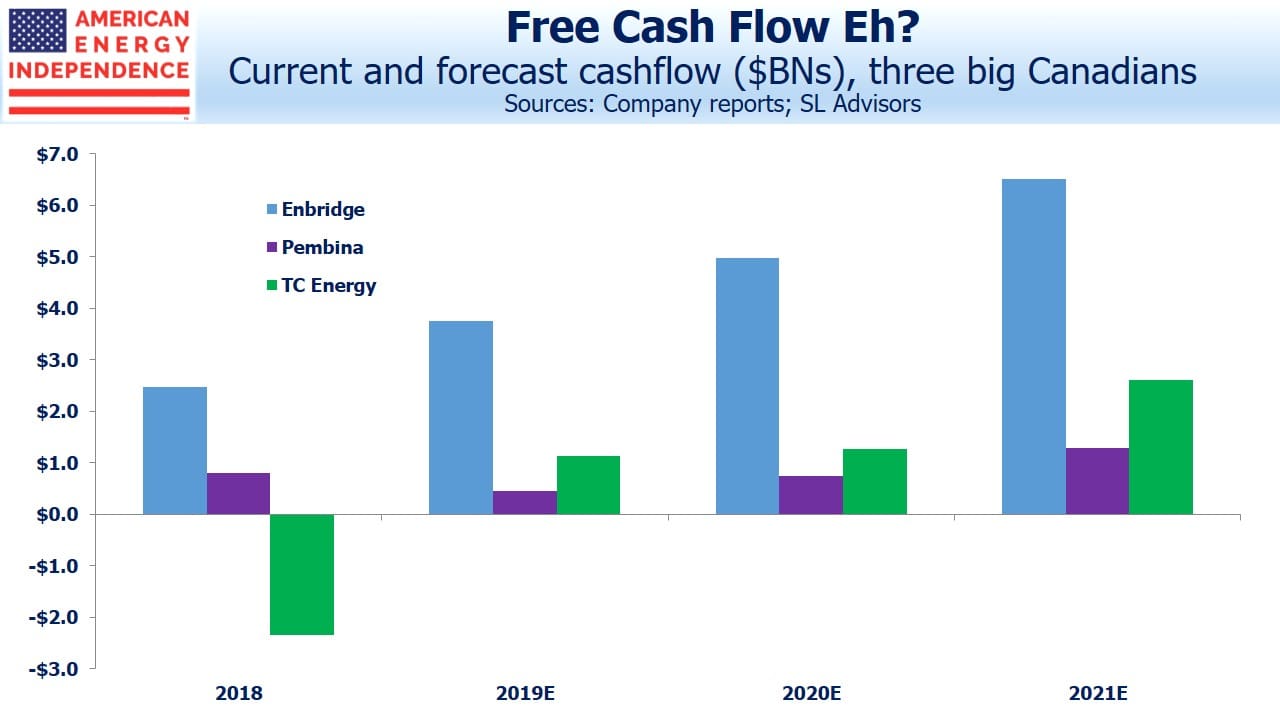
Like their banks, Canadians pipeline companies tend to be run more conservatively. Over the past five years they’ve also set themselves apart from the rest of the sector. Their U.S. cousins would do well to adopt some of their disciplined capital allocation and prudent management practices. These three companies represent 55% of the 2019 Free Cash Flow (FCF) we project for the industry. Their performance supports the case that growing FCF leads to a higher stock price (see The Coming Pipeline Cash Gusher).
The Alerian MLP ETF (AMLP) is a rich source of opprobrium on this blog, because of its flawed tax structure (see MLP Funds Made for Uncle Sam). It does retain one useful feature though, in that it’s relatively easy to short. Big pipeline companies are under-represented in the Alerian index, because most of them are not MLPs. So AMZIX is stuffed full of what investors don’t want. AMLP follows AMZIX, albeit from a distance. Because of its structure, since inception performance of 1.6% is only half its benchmark of 3.2%. AMLP is the worst performing passive index fund in history. This year AMZIX is 15% behind the investable American Energy Independence Index (AEITR), which is 80% corporations, including the abovementioned Canadians.
Comparing the two indices, one can see the recent sharp divergence in performance, which was probably exacerbated by tax-loss selling of MLPs. Short AMLP and long an AEITR-linked security has been a profitable trade. AMLP’s tax drag hurts in a rising market, where its flawed structure impedes its ability to appreciate with its underlying portfolio. But recent weakness has been led by the MLPs that predominate in AMLP, highlighting the importance of being in the right kinds of companies in this sector. Investors are favoring well-run Canadian pipeline corporations and shunning MLPs.
The Canadian pipelines offer powerful evidence that it’s possible to generate steady returns in this business. Those U.S. companies that perform well over the next couple of years will do so by adopting more of their culture from north of the border. Assuming FCF grows as we expect across the sector, performance of the Canadian stocks suggests positive returns should follow.
We are invested in ENB, PBA and TRP. We are short AMLP
We manage an ETF which tracks the American Energy Independence Index
Should Closed End Funds Use Leverage?
/4 Comments/in Midstream Energy Infrastructure/by Simon LackClosed end funds (CEFs) are an obscure sector of the market with a small but fiercely passionate following. Because they have a fixed share count, they can trade at a premium or discount to the value of their holdings, which are usually public equities or debt. This creates appealing opportunities to buy at a discount to intrinsic value. Closed End Fund Advisors provides a lot of useful information on the sector.
Liquidity is always a problem, so the investors tend to be retail with a small handful of institutions. It can sometimes take several days to get into or out of positions. We occasionally run across financial advisors who invest in CEFs for their clients.
In theory, CEFs should generally trade at a discount to Net Asset Value (NAV), because of their relative illiquidity compared to the basket of underlying shares. MLP CEFS have an especially interesting history. We often note the terrible tax structure of the Alerian MLP ETF, AMLP (see MLP Funds Made for Uncle Sam). But MLP CEFS pre-date AMLP and provided some justification for its launch.
This is because for many years MLP CEFs consistently traded at a premium to NAV. The Kayne Anderson MLP/Midstream Investment Company (KYN) illustrates this point. For most of its history, KYN shares have traded at least 5% higher than NAV and at times over 30%. MLP CEFs possess the same tax inefficiencies as AMLP, in that they are liable for corporate taxes because they are more than 25% invested in MLPs.
The benefit of the tax drag is that KYN investors get exposure to MLPs without the tax hassle of K-1s for tax reporting. A decade ago, investors clearly placed a high value on this simplified tax reporting, as evidenced by the substantial premium to NAV at which KYN traded. AMLP’s 2010 launch took place against this backdrop of strong demand for the tax-burdened, 1099 structure.
Where KYN and other MLP CEFs differ from AMLP is in their use of leverage. This is common in CEFs and supports higher yields in exchange for increased NAV volatility. In addition, the interest expense lowers taxable income, which can lower the inherent inefficiency of an MLP CEF with its corporate tax obligation.
For the past year, KYN has traded at a discount to NAV averaging almost 10%. It’s another symptom of declining retail interest in the sector. The sharp 2014-16 drop with heightened volatility caused some damage.
It’s worth revisiting the use of leverage by MLP CEFs. To continue with KYN, in reviewing their past financials, they seek to stay close to “400% debt coverage”, meaning that their desired portfolio consists of $400 in investments funded with $100MM in debt and $300MM in equity. So $1 invested in KYN controls $1.33 in MLPs. The 400% debt coverage rises and falls with the market. Rebalancing back to their target requires selling after a market drop, and buying following a rally (i.e. buy high, sell low). KYN tends to move a little more than the market as a result.
The question is, whether such leverage continues to make sense. MLP balance sheets have come under a great deal of scrutiny in recent years. The industry has moved towards self-funding growth projects with less reliance on external financing; higher distribution coverage; less leverage. Investment grade companies now target around 4X Debt:EBITDA.
A portfolio of MLPs is pretty concentrated. An investor in KYN or other MLP CEF, by accepting leverage at the CEF level, is implicitly rejecting the industry’s 4X Debt:EBITDA target as needlessly conservative. Is this a smart decision? It might make sense to add leverage to a diversified portfolio, because the low correlations across pairs of individual names will keep the portfolio’s volatility below that of its average holding. But if you’re invested in a single sector, the average volatility of the holdings will come close to your portfolio’s volatility. Adding leverage to that portfolio increasingly looks like adding more debt to each individual holding. The practical result is that the investor is adding more risk than the company and credit rating agencies deem appropriate.
We don’t use leverage in our business. The sector has been volatile enough in recent years, and the periodic rebalancings that are required tend to force you to buy high/sell low.
In KYN’s most recent quarterly financials (August 31), they noted 401% debt coverage versus their target of 400%. Since August, the Alerian MLP index (AMZX) has dropped 10%, implying KYN’s coverage ratio has sunk to 360%. Restoring their 400% target coverage will have required selling over $110MM in securities, adding to the market’s recent selling pressure. Last year’s 4Q saw a 17% drop in AMZX which was almost certainly exacerbated by MLP CEFs delevering. The rebound earlier in the year would have seen MLP CEFs similarly increasing leverage back up.
MLP CEFs are constantly chasing the market to restore their desired leverage. Higher volatility increases the cost of such frequent portfolio rebalancings. We think it’s time their investors reassessed whether accessing the sector with leverage makes sense.
We have three funds that seek to profit from this environment:
Energy Mutual Fund Energy ETF Real Assets Fund
Leverage Wipes Out Investor’s Bet on Enlink
/6 Comments/in Midstream Energy Infrastructure/by Jaclyn RodriguezManagers of client capital invested in midstream energy infrastructure have had to explain recent weak performance to investors frustrated at missing out on the buoyant S&P500. We summarized the many conversations we’ve had last week (see When Will MLPs Recover?). The sector is up this year, although investors in MLP-only products like the Alerian MLP ETF (AMLP) are lagging the stock market by 25%, and pipeline corporations by 14%.
Energy remains out of favor to be sure, but midstream energy infrastructure bankruptcies remain rare. As much as fund outflows have pushed equity valuations to levels indicating financial stress, bond investors don’t share the angst. Long term investment grade debt in many cases yields less than the dividend on a company’s common equity.
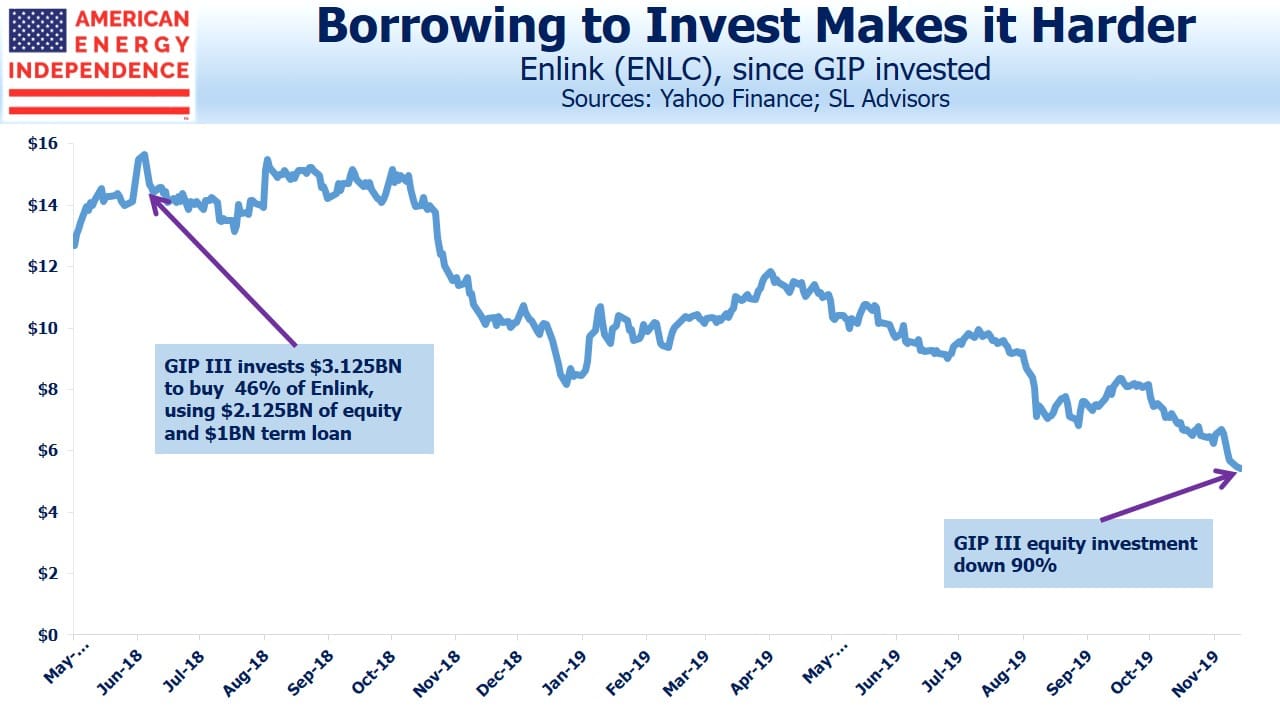
If schadenfreude is your thing, consider the portfolio managers of Global Infrastructure Partners’ (GIP) GIP III fund. In July of last year, they invested $3.125BN into Enlink Midstream LLC (ENLC) and Enlink Midstream Partners, LP (ENLK). Following a simplification a few months later, GIP III wound up with 46.1% of ENLC, the surviving entity, and control of the managing member. $1BN of the $3.125BN was funded with a term loan, because private equity investors always add debt to juice their returns. So GIP III invested $2.125MM of equity.
We don’t use leverage ourselves. Midstream energy infrastructure businesses already operate with leverage that credit rating agencies assess in setting their credit ratings. To add borrowings on top is to reject the agencies as needlessly pessimistic. GIP III wanted a little more upside.
ENLC’s entire market capitalization is currently $2.6BN, valuing GIP III’s 46% stake at $1.22BN. After the $1BN term loan, GIP III’s $2.125BN equity investment is worth $225MM. On a mark-to-market basis, they’re down around 90%. Losing that much that quickly, even in this sector, is stunning. It shows that the most sophisticated institutional investors can get it spectacularly wrong. Few, including us, thought ENLC could sink this low. Its dividend yield is now 20%
GIP has built a strong reputation investing in infrastructure. They manage $51BN across various portfolios (or perhaps more correctly, now $49BN after adjusting for ENLC). They raised the funds for GIP III on the basis of their past track record. They even highlighted their ENLC investment in the marketing materials for the next fund, GIP IV.
Of course there’s no gain in someone else’s losses – but ENLC investors need to consider what GIP will do. Private equity firms generally avoid holding publicly traded securities – the constantly fluctuating valuations add unwanted NAV volatility.
Included in the list of Risk Factors in ENLC’s 2018 10K is:
“GIP has pledged all of the equity interests that it owns in ENLC and ENLC’s managing member to GIP’s lenders under its credit facility. A default under GIP’s credit facility could result in a change of control of the Managing Member.”
The paragraph goes on to explain that, “…if a default under such credit facility were to occur, the lenders could foreclose on the pledged equity interests.”
So the lender could, in theory, seize GIP III’s equity stake in ENLC and sell it to pay back the loan. It’s likely that whatever loan covenants were attached have already been breached, and in the apparent absence of any large sale of ENLC stock, one must assume that a renegotiation has taken place.
On ENLC’s recent earnings call, James Carreker of US Capital Advisors pursued a line of questions relating to GIP’s term loan, noting the reference to it in ENLC’s Risk Factors section of its 10K. CFO Eric Batchelder refused to comment, and offered to “…talk about it offline.”
GIP’s intentions with respect to its ENLC stake are a material consideration for the other investors. ENLC’s 10K warns that, “our operating agreement limits the liability of, and eliminates and replaces the fiduciary duties that would otherwise be owed by, the Managing Member and also restricts the remedies available to our unitholders for actions that, without the provisions of the operating agreement, might constitute breaches of fiduciary duty.” Although ENLC is an LLC, like other publicly traded partnerships in this sector it provides weak investor protections.
The 10K goes on to point out: “Our operating agreement contains provisions that eliminate and replace the fiduciary standards that the Managing Member would otherwise be held to by state fiduciary duty law.” Further on: “…whether or not to seek the approval of the conflicts committee of the board of directors of the Managing Member, or the unitholders, or neither, of any conflicted transaction.”
ENLC’s operating agreement gives GIP an extreme asymmetric position over public holders through its role as managing member. It may have backfired on them. This blog regularly chronicles management self-dealing (see Blackstone and Tallgrass Discredit the MLP Model for example). Growing concerns of abuse and unethical (if legal) behavior have likely caused generalist investors to avoid ENLC, because of GIP’s power to similarly exploit other investors. GIP’s selective rights and canceled obligations have probably hurt ENLC’s stock price.
Given the substantial drop in ENLC since GIP III’s investment, you might think acquiring the rest of the company would be compelling. GIP III likely doesn’t have the ability, and because the different pools of capital managed by GIP have different investors, there would be inevitable conflict of interest concerns if, say, GIP IV bought the balance. It could be perceived that one fund was bailing out another’s poor investment decision. Private equity has to deal with that issue all the time though, and it’s likely they could find a solution. It’s similar to the conflicts committees that usually rubber stamp MLP decisions on capital allocation.
There’s probably a strong motivation for GIP to resolve this issue by year’s end, when GIP III’s annual financials will include ENLC’s public stock price performance. You can be sure they’re pondering their options right now.
We are invested in ENLC and TGE
When Will MLPs Recover?
/5 Comments/in Midstream Energy Infrastructure/by Simon LackOur blog topics are often informed by the subjects that come up in conversations with clients. October was a wrenching month, with the Alerian MLP index slumping to -6% versus +2% for the S&P500. MLPs have lagged equities by an astonishing 22% YTD. Over the last couple of weeks we have been busier than usual fielding calls from investors. By far the most common question in various forms is, when will MLPs recover?
So, for the benefit of those with whom we haven’t recently chatted but are wondering the same thing, below we summarize our thoughts:
- Energy sector sentiment. This remains terrible. Investors would still prefer more disciplined capital allocation. Management teams too often seek dilutive growth, often because their compensation isn’t aligned with per-share metrics. Midstream energy infrastructure has handily outperformed the E&P sector this year, and capital discipline is improving. But many of the people we talk to are weary, looking for reasons to remain invested and searching for confirmation in their original investment thesis that increasing production should benefit pipelines with their toll-like model. However, there are positive signs here, in that Free Cash Flow for midstream energy infrastructure is set to soar over the next couple of years (see The Coming Pipeline Cash Gusher). Growth capex peaked last year, and existing assets are generating more cash. These are both driving FCF to almost $10BN this year, $27BN next year and $43BN or so in 2021. Recent quarterly earnings generally provided confirmation of this positive trend. For example, Targa Resources (TRGP), one of the worst offenders, has 2020 investment spending plans of $1.2BN, half of this year’s. Former CEO Joe Bob Perkins flippantly talked about new projects as “capital blessings”. Investors won’t miss his self-serving arrogance.
- Retail investors are selling. Approximately $3.6BN, roughly 7% of the total, has left MLP mutual funds, ETFs and related products in the past twelve months, which creates constant downward pressure on prices. Although our own products have seen net inflows this year, this is not the norm.
- The MLP business model is probably dead. Pre-2012, pipeline companies organized as MLPs and paid out 90% or more of their cashflow. Back then, America obtained its oil and gas from roughly the same places in the same amounts year after year. Few new pipeline projects were needed, so with little need to retain cash MLPs offered high yields. These attracted income-seeking investors who, because of the K-1s that MLPs issue, tended to be wealthy. In other words, old, rich Americans. The Shale Revolution offered up oil and gas in places not traditionally served by infrastructure – for example, the Bakken in North Dakota and the Marcellus in Pennsylvania. The Permian in west Texas, although long a producing region, saw significant increases in volume. MLPs decided to invest in new pipelines, pressuring balance sheets and ultimately sacrificing distributions. Kinder Morgan was the first to slash its payout, before ultimately simplifying its structure as Kinder Morgan Inc (KMI) absorbed the assets of its MLP, Kinder Morgan Partners (KMP). The rationale for becoming a corporation was to access capital from the world’s institutional equity investors rather than just the old, rich Americans who buy MLPs (see Kinder Morgan: Still Paying for Broken Promises). Most institutions avoid publicly traded partnerships because of complex tax considerations. In the process, original KMP investors, who had invested for stable tax-deferred income, suffered two distribution cuts and a taxable transaction when their units were swapped for shares in KMI. Many thousands remain bitter to this day. Rich Kinder’s promise of ever rising distributions fueled higher payouts back to his general partner via Incentive Distribution Rights (IDRs).
- Prior to 2014, many investors viewed the distribution as sacred and assumed that Rich would honor his promise to continue paying them. After realizing they’d been duped into essentially transferring their money to Rich Kinder through this IDR mechanism based on broken promises, they’ve understandably become disillusioned. If you run into a former KMP investor, ask about their betrayal by Rich Kinder. It’ll be a colorful story. Other MLPs followed KMI’s lead. MLPs shed their income seeking investor base in their desire to fund growth projects. More distribution cuts and unwelcome tax bills followed. This transition to institutional, total return investors has been far harder than they assumed. The legacy of betrayal continues to hang over the sector. KMI had a slide titled “Promises Made, Promises Kept”, boasting about their 13 years of distribution growth. The Alerian MLP ETF has cut its distributions by a third, reflecting similar cuts by its underlying components. This is the only time we’re aware of in which companies slashed distributions even while operating performance was fine, as shown by the growing EBITDA on the slide below. But if you’ve invested for the income and it’s cut, you’re let down and no mitigating circumstances will compensate. It’s why MLPs have shrunk to well under half the midstream energy infrastructure sector, with conventional corporations (“c-corps”) now dominant. Investors in MLP funds or MLP-only portfolios can select from a couple of big MLPs and many very small ones while overlooking six of the ten biggest pipeline companies, since they’re corporations. AMLP, with its 100% MLP construction and disastrous tax structure, would never be created in today’s form. It is a slowly shrinking legacy to the past (see MLP Funds Made for Uncle Sam).
- Election year concerns. A Warren victory is perceived as the most negative, due to her proposed ban on fracking. If applied to federal lands this would have some very modest impact on production. Most drilling takes place on private lands and is regulated by the states. An outright ban on fracking would require an act of Congress which, barring a complete Democrat sweep to include control of the senate, we believe is highly unlikely.
- Tax loss selling. This seems to happen every year, but energy’s chronic underperformance has created opportunities for investors to pair gains elsewhere with losses in this sector.
- Climate Change. It’s hard to assess the impact of investors who might otherwise invest in energy declining to do so, either for ESG reasons or because they fear public policy will impose harsh limits on use of fossil fuels. ESG funds are notable investors in some of the biggest pipeline corporations but not in MLPs because governance (the “G” in ESG) provides weaker investor protections. Tallgrass recently demonstrated this (see Blackstone and Tallgrass Further Discredit the MLP Model). The result has been that the MLP-dominated Alerian MLP index has increasingly lagged our own American Energy Independence Index, which is 80% corporations.
Our best bet is that tax loss selling will soon abate, and continuing evidence of capital discipline will draw generalist investors to invest. There’s certainly plenty of interest from other buyers (see Private Equity Sees Value in Unloved Pipelines). But the history of distribution cuts, some poor capital allocation decisions and episodes of investor abuse because of weak MLP governance have depressed sentiment for some time.
For many years November was the best time to buy, with the predominantly retail investor base making the January effect more pronounced than in the broader equity market. The effect has become more muted as companies have switched from MLP to corporation, but still remains a factor (see Give Your Loved One an MLP This Holiday Season)
We are invested in KMI and TGE

