A Cheap Bet On Inflation

“If I seem unduly clear to you, you must have misunderstood what I said” was Fed chair Alan Greenspan’s response during testimony to the Senate in 1987. Transparent communication has come a long way since then. Greenspan continued the policy of obfuscating responses, reflecting a belief that it improved the Fed’s operating flexibility by disguising mistakes. This inspired Secrets of the Temple: How the Federal Reserve Runs the Country, William Greider’s 1989 scripture describing faith-based monetary policy.

Today, the Fed’s projections are public. Their meeting minutes are published. The mystery has gone, although they still are the most important market participant. Transparency allows for comparison between market forecasts of interest rates and the Fed’s. Of course, the latter has the advantage of being able to make their forecasts correct through their actions, should they be so moved. Fortunately, the Federal Open Market Committee (FOMC) is not burdened with excess vanity, so serially inaccurate interest rate projections do not bother them.

In recent years it’s been mildly amusing, in a nerdy sort of way, to show how the FOMC’s long term forecasts for inflation and the Fed Funds rate have followed bond yields lower, conceding the market’s prescience. Fixed income investors have been ahead of this for years, exhibiting greater accuracy about Fed policy than the FOMC itself (see Bond Market Looks Past Fed). Covid made such games irrelevant, but as markets look beyond the pandemic, revisiting FOMC Projection Materials is becoming worthwhile again.

In August, Fed chair Powell gave a speech where he addressed persistently low inflation and how this had caused FOMC members to continually lower their rate forecasts. He explained how 2% inflation remained their definition of price stability, but since recessions typically cause it to undershoot, the FOMC would henceforth be more tolerant of greater than 2% during a strong economy. The inference, reflected in subsequent FOMC projection materials, is that short term rates will remain low for a long time, at least long enough for inflation to exceed 2%.

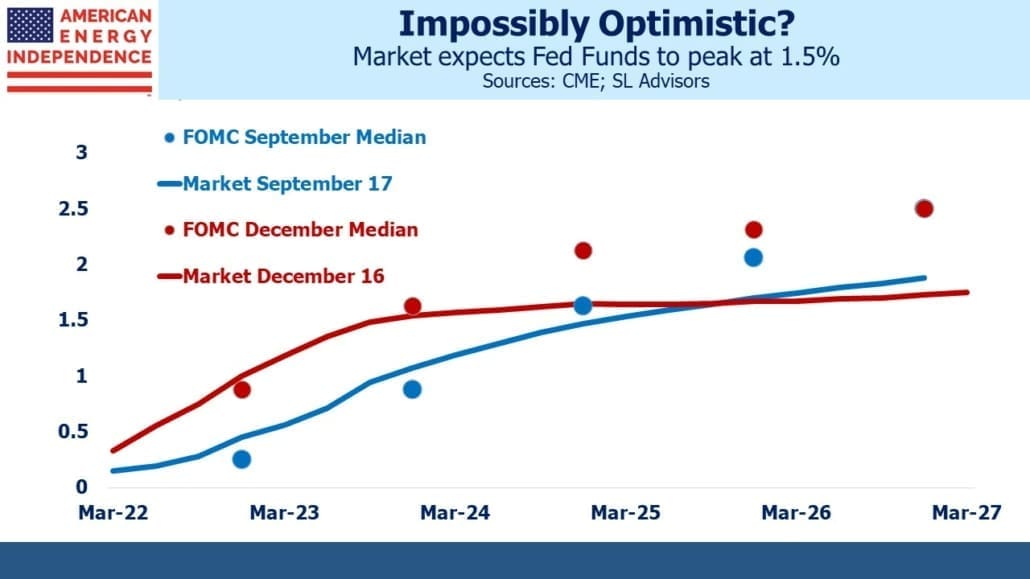
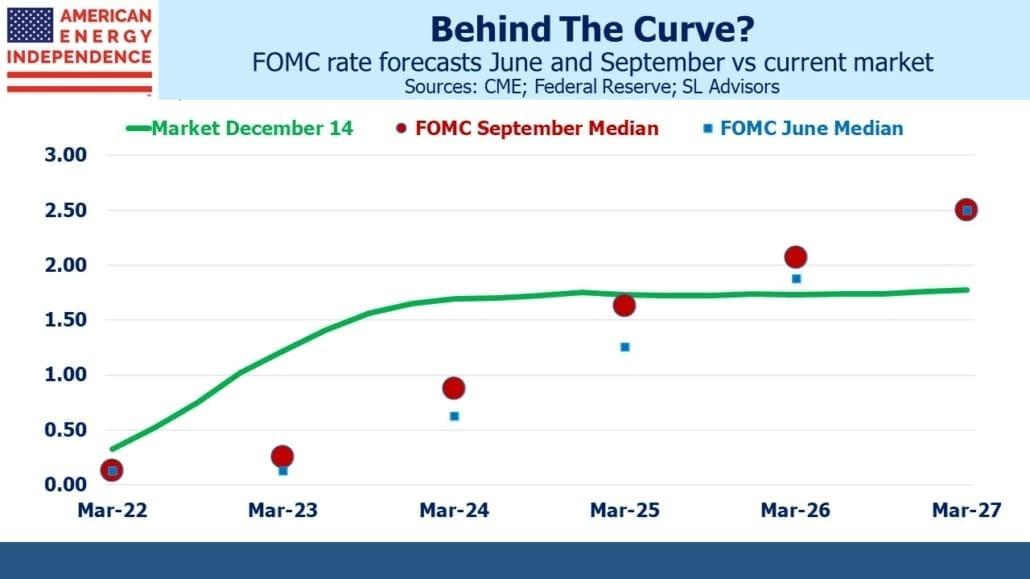
The chart compares the futures market with the FOMC’s forecasts. There is some judgment involved – the FOMC provides annual estimates through 2023 followed by a long-term assumption. The chart assumes that the long run is five years away. The market, as has been the case for years, is assuming lower rates than the FOMC.

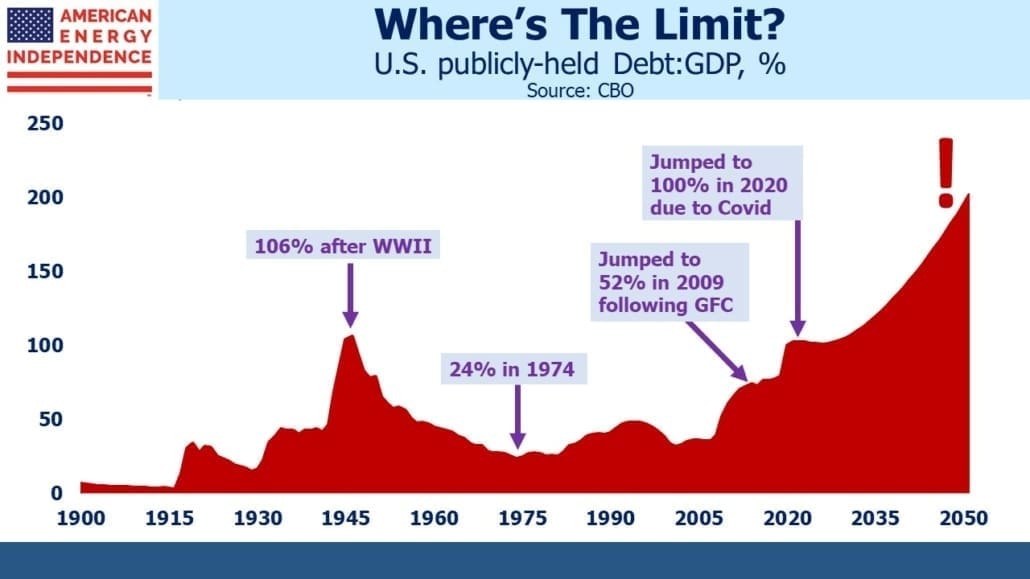
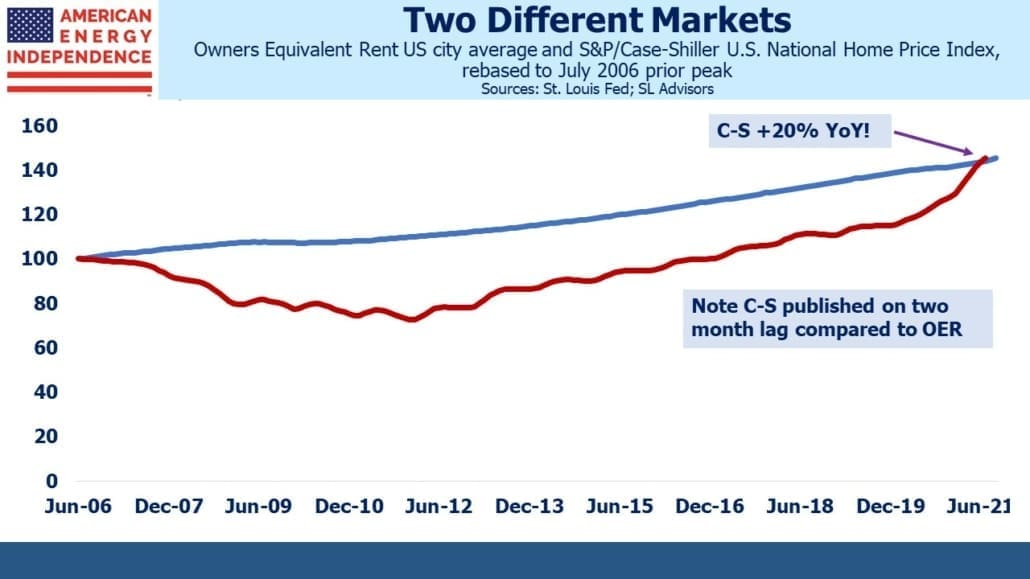
Rates probably will stay low. Betting on higher inflation has been a fool’s game for longer than the average investor’s career. But these are unusual times. M2 money supply growth is 24%, higher even than when we were trying to whip inflation in the 70s and 80s. The fiscal outlook is as bad as ever, with debt projected to exceed the wartime highs of 1945, and stay there.

Modern Monetary Theory (MMT) as explained by Stephanie Kelton in The Deficit Myth: Modern Monetary Theory and the Birth of the People’s Economy, holds that deficits don’t matter until they cause inflation. MMT has been widely panned by mainstream economists and isn’t regarded as a serious framework for fiscal policy. But the reality is that deficit hawks win few votes nowadays. We are, in truth, already pursuing the unlimited government spending that MMT advocates. Higher inflation is the only remaining obstacle, as we noted on Sunday in Deficit Spending May Yet Cause Inflation.

Low inflation remains likely, so betting against this is unbelievably cheap. The eurodollar futures curve offers precise forecasts of short-term interest rates, which in 2022 are expected to rise only 0.06%; that is, the spread between the December ‘21 and December ‘22 futures contracts is 0.06%.

Suppose that the economy emerges from Covid by the spring, as the vaccines allow a return to our previous lives. Consider whether a desire to live for the present promotes a vigorous economic rebound, as people catch up on experiences, trips and visits long delayed. The Roaring 20s followed the 1918 Great Influenza, although the still fresh horrors of World War I also played a significant role in the zeitgeist.

If inflation does pop above 2% next year, markets will start looking more carefully at near-zero Fed Funds and its longevity. No rate hike until 2023 will look to some like an awfully long time. The 0.06% spread between the December ‘21 and December ‘22 futures contracts could easily move to 0.25%, still representing only a single rate hike over that year.

The question is whether the odds offered by the market are sufficiently different from the odds of such happening, the minimum criteria to justify a trade. The money market curve is unlikely to invert, so the loss if nothing happens is a few basis points. The risk/return on this trade is a long way from 50/50, but the odds of an inflation jump are low too. Call it the MMT trade.

Some investors are already contemplating higher inflation. Bitcoin buyers are among them. There are cheaper ways, with well-defined downside, to express such a view. The eurodollar futures curve is one of the best. Your blogger has already initiated this trade.

We are invested in all the components of the American Energy Independence Index via the ETF that seeks to track its performance.

Deficit Spending May Yet Cause Inflation

The biggest question for long term investors is why bond yields remain so low. The Equity Risk Premium (see Stocks Are Still A Better Bet Than Bonds) has favored equities for most of the time since the 2008 financial crisis. Inflation expectations remain well-anchored and are noticeably lower than a year ago. Investors don’t expect it will even rise to the Fed’s 2% target within the next three decades, despite the Fed’s professed objective to overshoot this.

Should inflation, and therefore interest rates, move surprisingly higher, a key support for the bull market would be knocked away.

Betting on higher inflation, or even worrying about it, has been a wasted effort for as long as any of us can remember. My own career began in 1980, around the time inflation peaked. Bond yields have been falling ever since. Jim Grant’s Interest Rate Observer has been warning of resurgent inflation for this entire period. That he retains so many subscribers shows how erudite prose beats accurate forecasts.

The most likely outcome remains low inflation. However, it’s safe to say that few investors are prepared for a surprise. Should it happen, the resulting market response is likely to be traumatic.

There are reasons to worry. M2 is rising faster than at any time in the past 50 years, exceeding even the inflationary late 70’s and early 80’s. The link between money supply and inflation appears to have broken, and any analysis of current conditions must consider that Covid has affected everything. Nonetheless, 24% year-on-year growth means something.

The Federal deficit, invariably nowadays the subject of hand–wringing but inaction, is forecast to be $3.3TN this year, at 16% of GDP the highest since 1945. The Congressional Budget Office expects total debt outstanding to reach 109% of GDP by 2030, exceeding the 1945 peak at the end of World War II. Unlike then, it is expected to remain at elevated levels.

Fiscal discipline has gone because there are few votes to be had in it. Past and present fiscal profligacy has caused little visible damage, as measured by the bond market. The burden of proof increasingly lies with the advocates of prudence.

Believers in Modern Monetary Theory (MMT) should be pleased. MMT holds that countries with a fiat currency, the prevailing global standard nowadays, can never go bankrupt. This is because the government can always issue itself money to pay any bill. Therefore, deficits don’t matter, as explained by Stephanie Kelton in The Deficit Myth: Modern Monetary Theory and the Birth of the People’s Economy (you can read our review here). Or at least, deficits don’t matter until excessive government spending leads the economy to exceed its productive capacity, which is inflationary.

MMT remains at the fringes of political discourse, embraced by the same progressive Democrats who love the Green New Deal (see The Bovine Green Dream). It’s not conventional economic policy.

And yet, the deficit trend suggests that we are embarking on a great MMT experiment. $1TN is now a round lot for stimulus spending, rebuilding our creaking infrastructure, forgiving student debt or combating climate change. Proposing less betrays a lack of urgency. Derisively low bond yields deny fiscal conservatives their most potent weapon. MMT advocates must retain a disciplined silence, in case the rest of us comprehend that we are unwittingly doing their bidding.

Years of costless Federal profligacy have caused voters to become so disinterested in budget discipline that inflation is the only remaining constraint. We will continue testing the limits until we get a different result. MMT has become our fiscal policy. Higher inflation is assured, eventually. We don’t know when, but until then fiscal hawks will remain defenseless, disarmed of empirical arguments.

Therefore, every investor needs to consider how their portfolio will cope with higher inflation.  Though the timing of such is unclear, it is inevitable. Gold and Bitcoin suggest that some see warning signs ahead.

The point of investing is to preserve purchasing power. For years, simply earning positive returns was almost sufficient. Companies with pricing power offer some protection. If inflation is 5%, Coca-Cola will pass that through to customers, like so many companies with a strong brand and barriers to entry.

Real assets are another good choice. The rising cost of pipeline inputs (steel, concrete, labor) will increase the value of what’s already built. The next few years will in any case see few new pipelines. President Biden and relentless legal challenges from environmental extremists will add value to existing assets that have become hard to replicate.

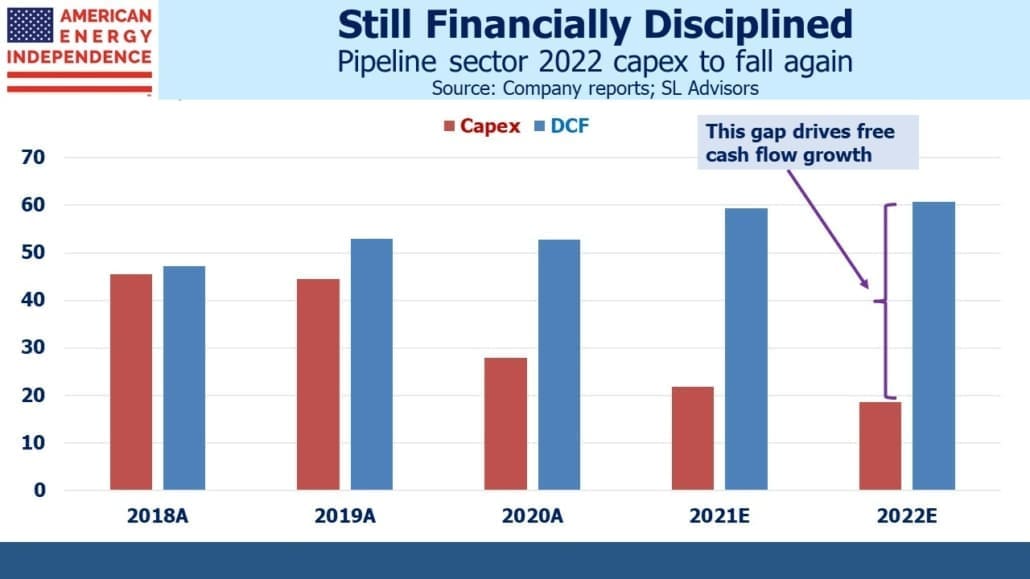
This is why planned spending on new pipelines is continuing its downtrend. Investors are welcoming the resulting boost to free cash flow, which has spurred a series of buyback announcements (see Pipeline Buybacks To Shift Fund Flows).

Oil is a global commodity whose recent price rise is partly to compensate for a weakening US dollar. Natural gas is similar, although relatively high transportation costs allow greater regional price disparities. And much of the North American pipeline network operates with tariffs that include inflation adjustments.

Inflation remains dormant, but America is probing for the conditions which will change that. MMT proponents are getting their wish. Pipelines offer protection for every portfolio.

We are invested in all the components of the American Energy Independence Index via the ETF that seeks to track its performance.

Clean Energy Isn’t Just About Renewables

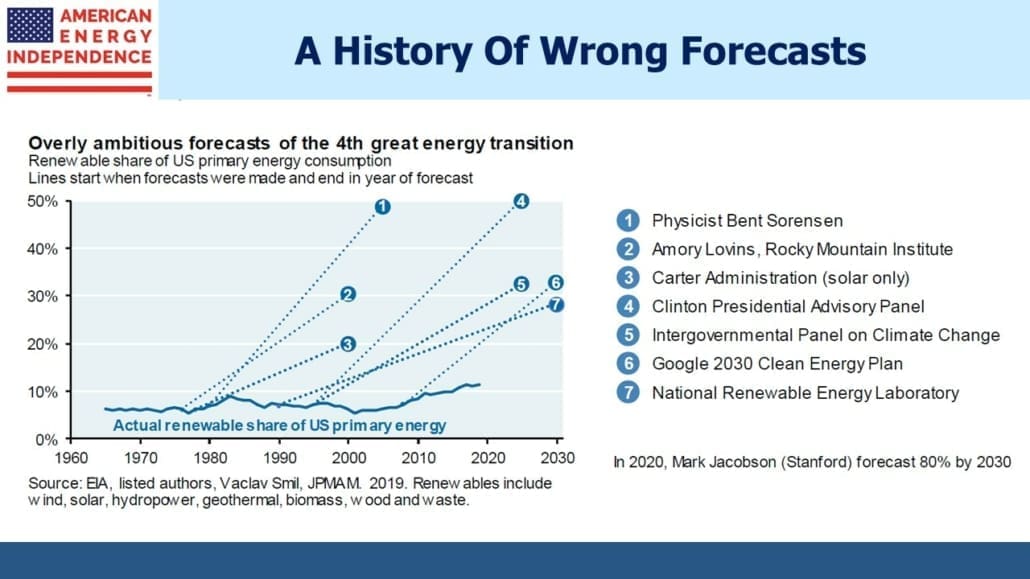
Technological advances in solar, wind and batteries receive widespread media coverage. Costs are falling and battery back-up is improving, vital to cope with renewables’ intermittency. As Enbridge CEO Al Monaco noted last week (listen to our podcast, Oh Canada’s Pipelines!), the world is going to use more energy, and consumption of every form of energy will increase. While the media focus is on renewables, fossil fuels represent 80% of global energy consumption. Improving what already works, by dealing with emissions, is also a recipient of considerable R&D.

Hydrogen is receiving increasing attention. It has a reputation for being perennially five years away from cost effectiveness – but investors are certainly taking note of anything that’s hydrogen-related. A couple of months ago we noted how New Fortress Energy (NFE) had seen their stock triple this year on little more than vague plans to ship hydrogen (see Hydrogen Lifts an LNG Company).

The emission benefits of using hydrogen depend on how it’s produced. The most common method is methane pyrolysis, which uses heat to separate hydrogen from carbon (methane is CH4). Another process applies electrolysis to water, which separates the hydrogen atoms from oxygen, Both require energy as an input.

Most hydrogen in use today is “gray”, meaning fossil fuels are used in its production. “Blue” hydrogen is derived from methane, with the CO2 that’s produced as a by-product being captured. That’s already a pretty good result. “Green” hydrogen relies on energy from renewables to power the extraction process.

Hydrogen is an appealing solution if costs can be brought down, because burning it produces water, not CO2. Compared with methane it is less dense, and causes the steel used in pipelines to become brittle, which means it can’t currently be moved in a pure form through existing infrastructure.

But hydrogen is already being added in small quantities to existing supplies of natural gas (methane). For example, Los Angeles is currently adding 4% hydrogen to their natural gas supply and is hoping to get to 10%.

Pipeline companies are watching this area closely, awaiting solid evidence that it can be made commercially viable. If hydrogen use does gain traction, today’s midstream infrastructure businesses are well positioned to benefit, since hydrogen transportation will be via pipelines. The industry will surely find a technical solution to the problems caused by direct interaction of hydrogen with steel – perhaps by applying a protective coating to the inside.

Recently, United Airlines announced an investment in 1PointFive, a joint venture between Occidental (OXY) and Rusheen Capital Management that aims to extract CO2 from the atmosphere. Airlines know that renewable energy won’t help them curb emissions – batteries are far too heavy to be built into an airplane. And jet fuel has the added benefit of being burnt as it’s used, decreasing weight.

Aviation is estimated to produce over 2% of global CO2 emissions. Post-Covid, flying is likely to resume its upward path in developing Asia at a minimum, even if a full return to normalcy is five years away as some airline executives fear. Nonetheless, it highlights that solar and wind offer a limited set of solutions, which means ongoing need for liquid fuels.

Extreme weather events have caused a jump in solar panel insurance. Last year a hailstorm in Texas caused $70MM in damage to a solar farm. California wild fires damaged three sites earlier this year. Solar panels are easily damaged, and insurance rates are 20-30% higher than a year ago.

“We have seen projects that were achieving their expected returns no longer able to do that, as a result of the change in the cost of insurance,” said Michael Kolodner, US power and renewables practice leader at Marsh, an insurance broker.

Those who blame these and other extreme weather events on climate change will not appreciate the irony.

Another non-renewable, clean energy solution is NetPower’s emission-free natural gas turbine (see Clean Fossil Fuels May Be Coming). The company explains that their patented “Allam-Fetvedt Cycle burns natural gas with pure oxygen. The resulting CO2 is recycled through the combustor, turbine, heat exchanger, and compressor.”

NetPower says they have, “Multiple projects are in development worldwide for rapid global deployment of commercial units.”

Cleaner ways of burning natural gas; extracting harmful CO2 out of the atmosphere; commercially viable hydrogen. These are all potential solutions to the problem of lowering emissions that don’t rely on solar panels, windmills and batteries. These are the types of breakthrough that could quickly put today’s pipeline companies at the forefront of combating climate change. What’s clear is that innovation is happening in many more areas than simply the use of sun and wind.

We are invested in all the components of the American Energy Independence Index via the ETF that seeks to track its performance.


Pipeline Buybacks To Shift Fund Flows

The pipeline sector’s increasing Free Cash Flow (FCF) has quietly allowed several companies to initiate buyback programs. We calculate that over $8.5BN in buyback programs have been announced this year, including $3.5BN following 3Q earnings.

One of the biggest headwinds to improved equity returns this year has been selling by funds. There was the forced selling in March (see MLP Closed End Funds – Masters Of Value Destruction), which was likely in the $1-4BN range, and $6.4BN in steady redemptions from open-ended funds all year.

Recent buyback announcements have improved the buy/sell balance in the sector, such that companies could be absorbing investor sales with their own excess cash. Of course, buyback programs don’t have to be executed if, for example, prices rally to less attractive levels. This flexibility adds to their appeal. And while it’s impossible to predict what fund investors will do, their total AUM sank as low as $24BN in November before rising prices increased values.

It’s likely that positive investment returns will turn outflows to inflows before too long.

Increased buybacks, if combined with a shift in investor appetite for the sector, would represent a substantial change in flow of funds into pipeline stocks. Valuations have been attractive for months (see May’s post, Pipeline Cash Flows Will Still Double This Year). Fund flows are starting to reflect this.

Next year the continued growth in FCF will leave excess cash after dividends. Over the next two years, we estimate that the sector will generate $25BN in excess FCF after dividends. This should leave room for further buyback announcements over the next few quarters.

The market has been slow to recognize this, but pipelines are becoming cash-generative businesses. Enbridge (ENB) reflected this shift on a slide at their investor day last week. Large capital projects are being replaced with a focus on boosting returns from existing assets. Funding is now internally generated cash rather than the capital markets. And they are making investments in  renewables as part of the energy transition, as long as returns justify it.

Related to the energy transition, on Thursday United Airlines announced an investment (amount unspecified) in 1PointFive, itself joint venture between Occidental (OXY) and Rusheen Capital Management. They are developing technology to extract CO2 from the air and convert it into pellets that can be stored.

It’s possible to by cynical about such efforts – United Airlines, like every public company, has an ambitious ESG agenda. The requirements to score well on ESG criteria are extremely flexible. For example, Lockheed Martin has been in the Dow Jones Sustainability Index for seven years (see Pipeline Buybacks and ESG Flexibility). Think green bombs. In many cases there’s more style than substance to ESG-initiatives. Nonetheless, this illustrates that the R&D to combat climate change isn’t limited to improving battery storage to compensate for renewables’ intermittency. Commercially viable carbon capture would recast the debate about climate change. It’s worth watching.

We are invested in all the components of the American Energy Independence Index via the ETF that seeks to track its performance.


MLP Closed End Funds – Masters Of Value Destruction

When MLP investors cast around for characters to blame for the past few years of underwhelming  equity returns, management teams are the obvious target. Like their upstream clients, midstream businesses embraced the endless volume growth of the Shale Revolution with sharply increased growth capex. By 2018 they’d heard the message from investors that stability trumps growth and begun to pull back. This year, as a result of continued capex frugality, free cash flow will double. Given the pandemic, which even led briefly to negative crude prices in April, this result is extraordinary and only now beginning to register with investors.

Although recent equity returns for pipelines have been sparkling, few will soon forget the trauma of March when wholly indiscriminate selling drove prices to unfathomable depths. Management teams are responsible for operating performance and while this drives equity returns over the long run, in between quarterly earnings reports stock prices gyrate on investor opinion, guesses and hunches. March was miserable for everyone involved in midstream, but chief among the villains of that sector-wide margin call are the managers of MLP Closed End Funds (CEFs).

These vehicles have been around for years, holding MLPs in an inefficient, tax-paying c-corp structure. They were Wall Street’s first attempt at separating the K-1 from the sought-after retail buyer. The corporate tax liability, an expensive haircut to returns, was obscured by the tax-deductible interest expense on leverage.

MLPs were once considered a fixed income substitute. Borrowing money to buy bonds in a closed end fund structure can be defensible if the underlying assets are very stable. MLPs long ago lost the advantageous reputation of “income-seeking substitute” as their rush for Shale Revolution growth stressed balance sheets and led to higher volatility. Nonetheless, MLP CEFs retained their leveraged model, even though most were forced into distressed sales during the 2014-16 slump when depressed MLP values tripped risk limits.

Moreover, they stuck with it even while the pool of MLPs shrunk. This now unrepresentative set of securities is a third of the American Energy Independence Index, our broad-based index of North American midstream energy infrastructure. By comparison, MLPs are smaller, less creditworthy, more liquids/less natural gas focused, and offer weaker corporate governance. In short, nobody is contemplating an IPO of an MLP closed end fund today. If they hadn’t been created years ago, they wouldn’t be around.

The problem with investing with leverage is that it leaves you exposed to even a brief sharp fall in your holdings. If you buy $100 of securities with $30 in debt, a 40% market drop takes your leverage from 30% to 50%. If that’s beyond your lender’s risk tolerance, sales must immediately follow. Once done, recouping the locked in losses is almost impossible. The leveraged investor assumes risk to the path of short term returns that the cash buyer does not.

To see how dumb an idea closed end MLP Funds had become, consider that leverage at MLPs had been coming down in recent years as rating agencies tightened the standards required of an investment grade rating. Debt:EBITDA of 4X became the new target, and MLPs either reached it or planned to.

A portfolio of MLPs is not a diversified equity portfolio. Individual security returns will differ to be sure, but the group will largely move together — especially so when prices are falling hard. So, when the closed end fund MLP portfolio manager adds leverage to this homogeneous basket of securities he (and it most assuredly is he, for such imprudence requires excess testosterone) is asserting that pipeline companies are managed too conservatively. Never mind that the industry and its rating agencies have settled on 4X Debt:EBITDA as appropriate, the MLP PM believes 5-6X is fine.

The intellectual arrogance in this stance is breathtaking. Because the holdings of an MLP CEF will track each other more than any other sector, this amounts to increasing each individual company’s leverage to 5-6X. The only possible justification for this is if the PM has both the plan and the skill to reduce leverage just before the crash. As we saw in March, they had neither.

March is a memory, although still raw for many. At the low on March 18, the sector was briefly –63% YTD. MLP CEFs lost almost their entire value through forced sales. Tortoise’s fund closed –92% for the year on that date. Even now MLP CEFs, including those run by Goldman Sachs and Kayne Anderson as well as Tortoise, have still lost half to three quarters of their value since January 1. They have barely participated in the sector’s strong recovery, now -10% for the year.

MLP CEFs could never make up for their forced sales in March when leverage limits kicked in.

If you were invested in pipelines but avoided MLP CEFs you probably feel unaffected. You’d be wrong. When these funds sold, they defined the low and caused prices to fall more than they would have absent the forced deleveraging. Your portfolio consequently fell more than it had to as well. The excessive volatility doubtless induced other investors to exit, tired of the distress. It’s permanently part of the price history of the sector, guiding future buyers in their assessment of risk. In short, today’s holders require more conviction in their investment thesis to compensate for the risk history suggests they’re taking.

The villains in this episode are the PMs of funds run by Goldman Sachs, Kayne Anderson and Tortoise, to name a few. They all persisted with the arrogantly leveraged structure right into the maw of the March collapse. Goldman Sachs knows about risk, and the firm emerged from that period of heightened volatility relatively unscathed. Their fund blowing up simply means the PM didn’t get the memo from Risk Management to cut back.

But Kayne Anderson and Tortoise are dedicated MLP investors. Their risk management function should have had little else to confuse it. They clearly had no risk management, no judgement, or neither.

The silver lining is Darwinian, in that such incompetence destroyed sufficient capital that MLP CEFs are no longer big enough to matter to anyone other than their hapless investors.

If you own one of these wretched vehicles, consider the stewardship practiced by your PM and whether it’s worthy of your money.

We are invested in all the components of the American Energy Independence Index via the ETF that seeks to track its performance.

We have three funds that seek to profit from this environment:

Energy Mutual Fund Energy ETF Real Assets Fund


Investors Continue To Rotate Into Energy

The pipeline sector continued on its tear last week. The catalyst was Pfizer’s vaccine announcement a month ago, but cheap valuations have drawn increasing attention as prices have risen. The buybacks announced by several companies added further support.

For many months, we’ve argued that the biggest problem with the sector was negative sentiment. Since peaking in 2014, midstream energy infrastructure has lagged the S&P500 significantly. The industry began to acknowledge investor criticism of over-investment back in 2018. That’s when growth capex peaked. Since then, the path to growing free cash flow has been clear – but sentiment is often the last piece to fall in place.

Rising stock prices are starting to do that. This is persuading investors that what appears cheap perhaps really is. We are seeing it in our own business, where inflows have returned and investors are increasingly prepared to commit capital. The energy sector ETF XLE is on track for a record year of AUM growth.

Energy is part of the broader shift from technology to value, including small cap. The widely-watched QQQ/IWM ratio solidly crossed its 200-day moving average to the downside last month, and has continued its new trend.

Since the beginning of October, the American Energy Independence Index has rallied 32%. At –8% YTD, it’s not inconceivable that it could claw back its remaining losses for the year. At the end of March, it had lost more than half its value over the prior three months.

So it’s worth pausing to examine valuation.

The components of the AEITR still yield 7.5% — still sufficiently high to suggest healthy skepticism regarding sustainability. Yet all companies except for Energy Transfer paid quarterly dividends at least as high as before. We calculate that payouts are now covered almost 2X by Distributable Cash Flow (DCF).

Free Cash Flow (FCF) should come in at $23BN for the year, up from $8BN in 2019. We entered 2020 expecting FCF to double, and by May reaffirmed that forecast (see Pipeline Cash Flows Will Still Double This Year).

The increase is fully driven by reduced growth capex. We see it rising to $44BN next year, an 11% FCF yield which is more than 2X that of the S&P500.

One of the reasons we like our prospects with incoming President Biden is that pipeline spending plans are likely to remain constrained. New projects are almost impossible nowadays. Environmental extremists have figured out how to use the court system to introduce unpredictable legal delays into any project. We are not unhappy with this (see Pipeline Opponents Help Free Cash Flow).

Long term capital commitments to fossil fuels face significant uncertainty with respect to public policy. While this will disappoint executives who love to build, investors like us will find much to like. Less building means less execution risk as well as more cash for buybacks, dividend hikes and debt reduction. How ironic that a Democrat president is likely to create an improved environment for investors – such was the exuberance unleashed by Trump’s pro-energy, deregulatory push.

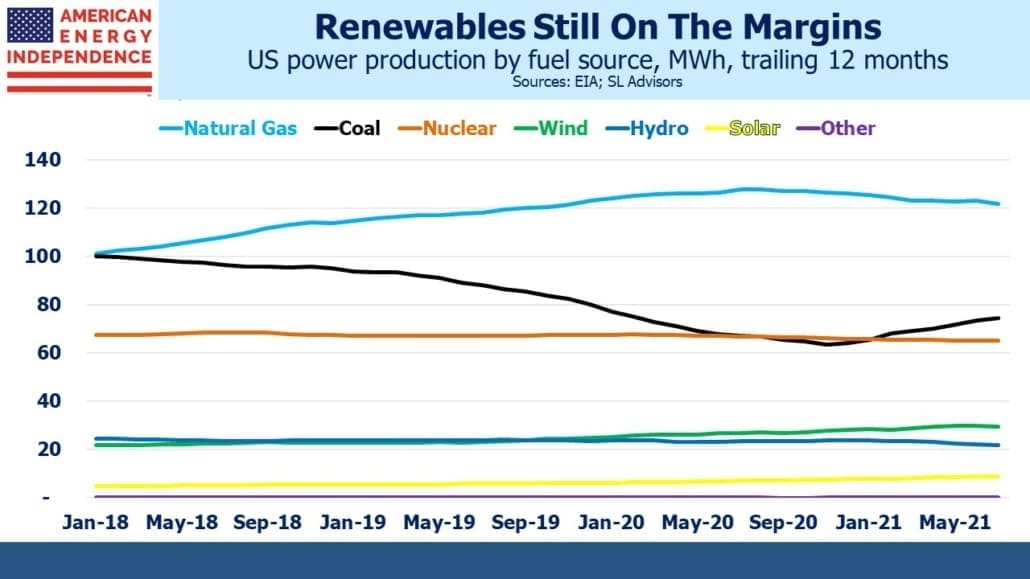
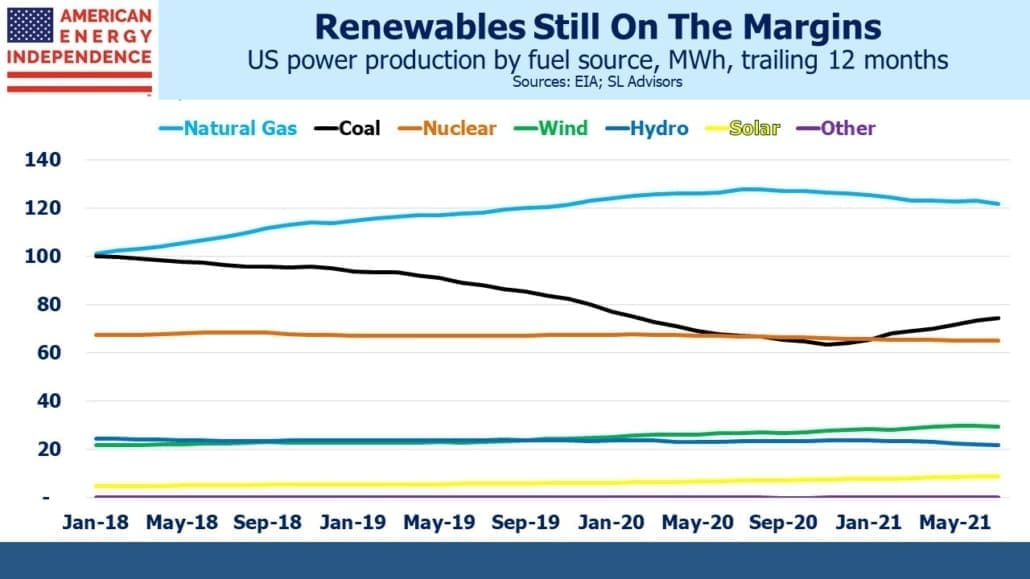
Meanwhile, the U.S. Energy Information Administration reported that natural gas fired power generation increased in most of the U.S. over the past five years. Natural gas is going to see demand growth for years to come, especially from developing countries intent on raising living standards. Don’t be distracted by all the media attention to renewables. What counts is what’s actually going on.

We are invested in all the components of the American Energy Independence Index via the ETF that seeks to track its performance.

Enterprise Products Keeps On Going

November was a month of records for stocks, including for the energy sector. The American Energy Independence Index (AEITR) was +20.8%. This year has seen the top two months, and it’s still –16.1% YTD. 

Crude oil grabs most of the attention, but propane is an under-appreciated area of rising production that’s driving higher exports. It’s generally used for heating by businesses, industry and homes, but is also used for cooking in rural areas that are not reached by natural gas (methane).  

Propane exports have been rising steadily for the past decade, growing at a 26% compound annual rate since 2010. We crossed the 1 million barrels per day threshold in 2017. The Covid pandemic is barely a blip. 

One reason for this is increased demand in India. Propane is often produced as a by-product of oil refining, but in the U.S. it’s found naturally in gas wells where it’s separated out from the methane.  

Tens of millions of households in India rely on bottled propane for cooking and heating. The drop in gasoline demand earlier this year lowered local refinery runs, depressing propane production. So India turned to the U.S. for imports (see Energy Does More Than Move People). 

Enterprise Products Partners (EPD), the biggest MLP, is one of the winners from this business. They include propane in their Natural Gas Liquids (NGL) segment, and they’ve participated in this growth as much as any company.  

NGL exports volumes are now similar to crude oil, though few outside those following EPD would know that. Propane dominates the segment. 

This has driven EPD’s margin from NGL pipelines and services to a 9% compound annual growth rate over the past five years. Based on the first 9 months, 2020 looks set to be another record year for NGLs 

This all highlights the resilience of their business model.  

Nonetheless, EPD’s stock price has lost a third of its value this year, even after a 17% gain in November. This reflectcontinued loss of appetite among investors for the sector. EPD’s $1.78 dividend currently yields almost 9% and looks secure since the company has bought back $225MM in stock this year out of an announced $2BN program.  

Investors often ask whether EPD will convert to a c-corp. There can be little doubt that, if accessible to a far broader set of buyers, their stock would rally. However, insiders own 32% of the company, and they have concluded that subjecting their profits to corporate taxes doesn’t justify the potentially higher valuation. Although EPD never had to cut its distribution, unlike most of its MLP peers, it suffers guilt by association with many poorly run brethren. CEO Jim Teague usually runs a colorful quarterly earnings call – regular listeners look out for the Vietnam references (i.e. he’s been in tougher spots than 2020).  

We are invested in all the components of the American Energy Independence Index via the ETF that seeks to track its performance.

Investors Rotate Into Energy

November is on track to be the second best month in the history of the American Energy Independence Index (AEITR)Through yesterday, the index is up 27% for the month. April’s 39% bounce off the March lows is the biggest, but with the index having doubled in value since then, November is on track to be the biggest points move ever. It’s eclipsed the June high, and has recovered to 12% YTD (the S&P500 is +16% YTD).  

Jim Cramer has even offered some reasons to buy – describing President-elect Joe Biden as “the counterintuitive savior of the oil industry”. He’s echoing a point we’ve made – that Democrat policies favor higher energy prices (see Why Exxon Mobil Investors Might Like Biden). Combined with a more cautious attitude towards growth projects, an era of growing free cash flow is at hand for midstream energy infrastructure – a trend that’s remained in place all year and is returning cash to shareholders (see Pipeline Buybacks Are Coming). 

Although energy is enjoying a strong month, fund flows are not yet following which suggests a healthy skepticism remains. Investors in this sector have seen too many false dawns, and remain cautious. Nonetheless, with recently announced buybacks being big enough to counter the typical outflows of the past few months, it won’t take much of a shift by investors to cause net buying.  

The vaccine news triggered the rally, but the fundamental outlook had been improving for months before that. Other than Energy Transfer (ET), all paid dividends as expected following 3Q earnings. The components of the AEITR now yield just under 8% on a market-cap weighted basis – almost 4X the S&P500. 

The energy sector is the biggest beneficiary of the huge shift under way from technology to value (see The Big Rotation Begins). Since the ratio of the QQQ to the Russell 2000 (IWM) crossed its 200-day moving average on November 9th, when Pfizer’s vaccine news broke, it has moved decisively lower. 

The North American pipeline sector has a float-adjusted market cap of around $375BN, less than a fifth of tech giant Apple (AAPL). Exxon Mobil is $175BN. Energy has sunk to below 3% of the S&P500. 

The strong performance of technology stocks in recent years means that if just a small percentage of investors switch from tech to energy, it’s likely to move higher given their relative size. 

Meanwhile, we can look forward to incoming Climate Change Czar John Kerry overlooking his own outsized carbon footprint while lecturing the rest of us about ours.  

We are invested in all the components of the American Energy Independence Index via the ETF that seeks to track its performance.


The Hidden Cost of Renewables

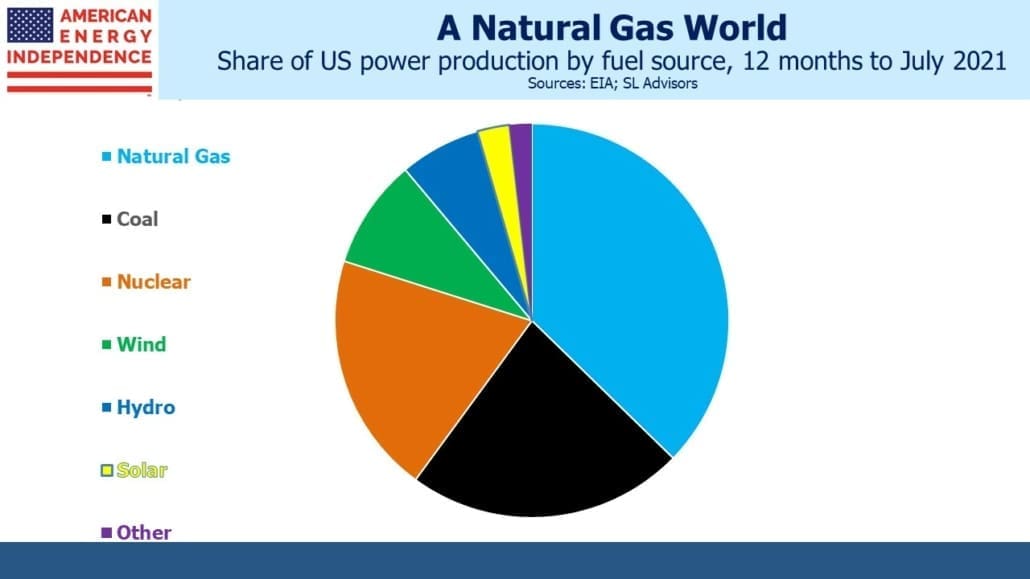
Renewables receive a disproportionate share of media coverage given their still small size. In 2019, less than 9% of America’s power came from solar and windFossil fuels (mainly coal and natural gas) are over 62%. Moreover, electric power is only 37% of our total energy use. Renewables receive outsized attention because of the hope they will lead to lower emissions. A look at recent daily data on U.S. power generation illustrates the challenges we’ll face in relying on intermittent, low-density sources of energy.  

California is a leader in moving away from fossil fuels. We should hope the rest of America doesn’t seek to emulate them, because Californians pay the most for the least (see California Dreamin’ of Reliable Power). 

The first four charts draw on hourly electricity generation across the lower-48. Solar and wind are both intermittent – solar is fairly predictable,  and wind less so. The challenge for grid operators is matching demand with supply.  

Over a recent seven day period, solar and wind provided 15% of our electricity, but the range was between 8% and 21%. Because their share is still small, this variability is easily managed by dialing other power sources up or down as needed. Natural gas combined cycle (NGCC) plants have the advantage of being easily recalibrated to accommodate fluctuations in nature’s power output. Their flexibility enables increased use of renewables – a benefit Californians are denied because of a purist dogma that has seen them phase out even natural gas power plants. 

In combination, solar, wind and natural gas provided almost half our electricity over a recent seven-day period. What’s especially interesting is that natural gas output is strongly negatively correlated with the intermittent sources. This highlights the symbiotic relationship between the two.  

Power demand isn’t constant – it’s higher during the day and peaks around dinner time. So we need variable sources of power. For example, if we used nuclear power exclusively, its constant output would require either storage or supplementary power to match demand.   

Cost estimates of intermittent power sources need to include either complimentary natural gas power or battery back-up. Breathless media coverage of the topic rarely considers the fully-loaded costs.  

The chart below is from a paper published by the University of North Carolina which compared the cost of electricity from an NGCC with different combinations of renewables and back-up to achieve the same output for the 85% of the time such plants typically run. Solar and wind generally product at about 25% of capacity.  

None of the alternatives are cheaper than an NGCC, although solar with NGCC back-up is the cheapest of the three alternatives considered.  

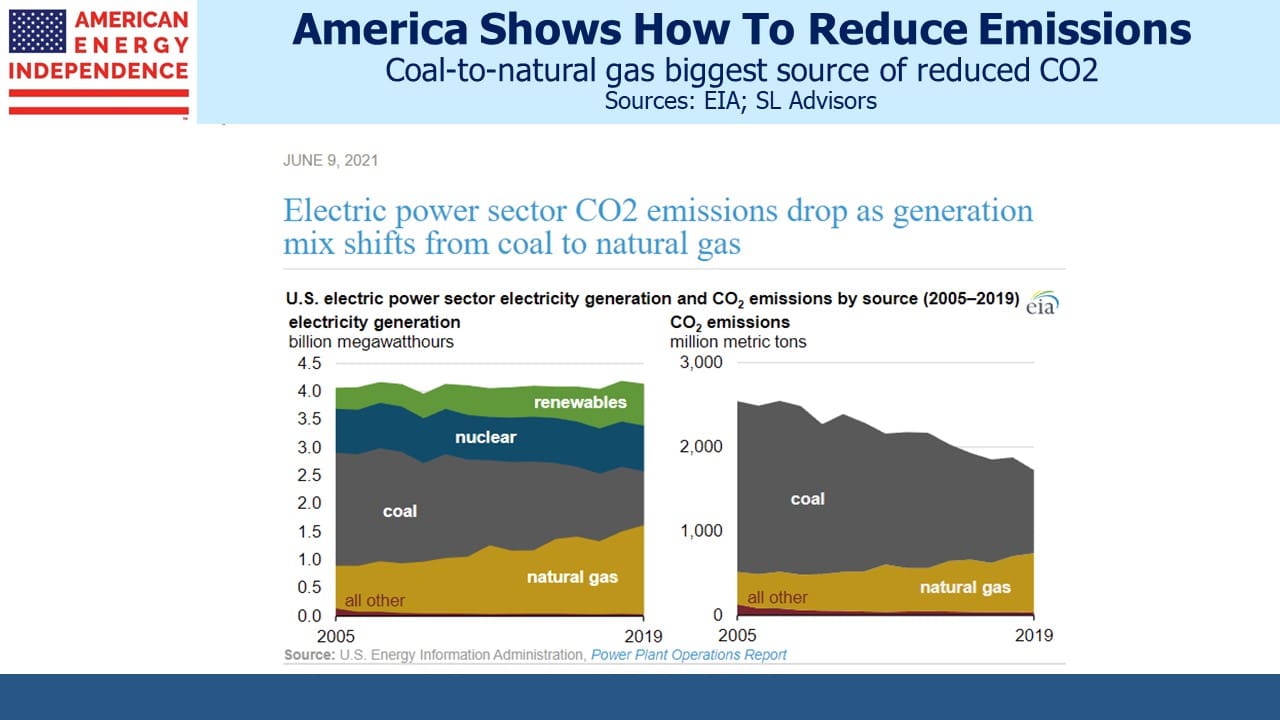
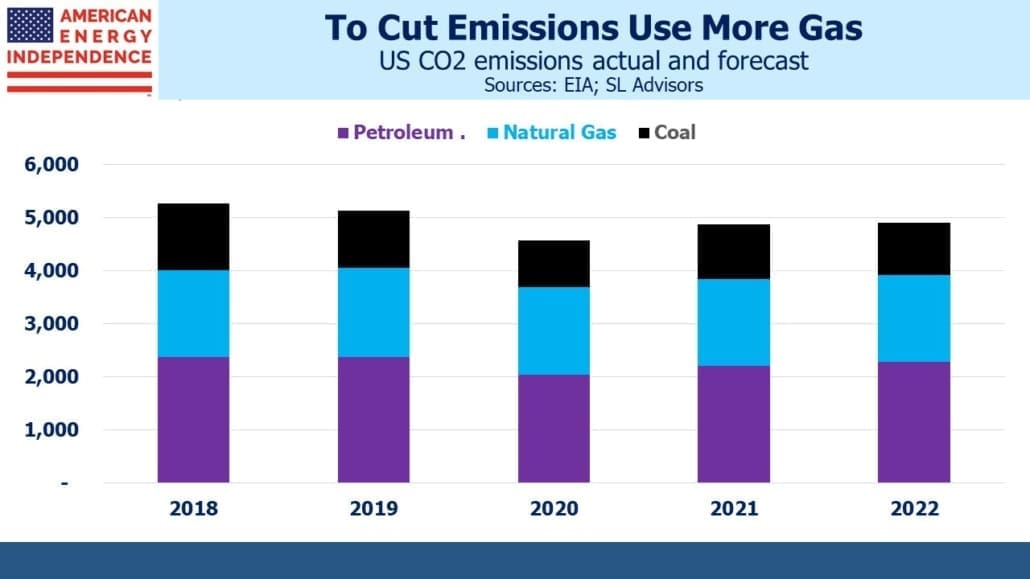
In recent years natural gas has been the biggest contributor to falling U.S. emissions, and is enabling increased use of renewables. Continuing this success is our best path to combating climate change.   

We are invested in all the components of the American Energy Independence Index via the ETF that seeks to track its performance.

Energy’s Momentum Continues

Last week’s news from Pfizer triggered some big sector moves, as investors sold technology stocks in favor of value like energy and financials (see The Big Rotation Begins). Pfizer CEO Albert Bourla didn’t overstate the case when he said, “It is a great day for humanity when you realize your vaccine has 90% effectiveness. That’s overwhelming,” 

Moderna followed up with their own vaccine announcement this week, topping Pfizer with 94.5% efficacy. Even though this news was telegraphed by Anthony Fauci days earlier, the switch into value stocks has continued.  

On the day of Pfizer’s announcement, the American Energy Independence Index (AEITR) solidly crossed its 200day moving average. It has continued to move sharply higher since then, outpacing the S&P500 by 10%. The prospect of a return to normalcy within six months or so has lifted sectors that Covid has hurt, such as energy.  

Yesterday showed the energy demand for pipeline stocks, as the sector opened down on the day but traded up from then on, increasing its recent outperformance against the S&P500.  

For the past six months, investors have wrestled with the conundrum of the Covid pandemic and rising equity markets. During the spring, the news seemed so relentlessly bad that holding a constructive view on stocks seemed insensitive (see The Stock Market’s Heartless Optimism).  

Superlatives were inadequate for the many record statistics that described the global economy shuddering to a sudden halt. Economic distress shows up quickly in the employment statistics. The April non-farm payroll report recorded a stunning loss of 20 million jobs – almost 1 in 7 U.S. workers lost their jobs in one monthEven in the face of this disaster, the S&P500 was up 12% by the end of the month. 

Although the Federal government’s stimulus is widely credited with arresting the economy’s sharp decline, most people assume that personal income has similarly collapsed along with employment. This is not the case. 

The chart below shows the personal income “bridge” from September 2019 to September 2020. Disposable Personal Income – that is, including the effects of any government transfer payments such as unemployment insurance, is $1TN higher than a year ago. $800BN of that is due to direct payments by the Federal government. But even Wages and Salaries are $56BN higher over this period. 

Meanwhile, the economy has lost ten million jobs. In 2019 we averaged monthly gains of 178K None of us have ever witnessed a period like this, with employment and personal income heading in sharply different directions 

It’s surprised economists for most of the year. The failure of Congress to pass an additional stimulus plan has created fears of more widespread hardship. But the vaccine news from Pfizer and Moderna will likely temper the more extreme stimulus proposals.  

Meanwhile, energy is becoming the new momentum sector. 

We are invested in all the components of the American Energy Independence Index via the ETF that seeks to track its performance.

image_pdfimage_print