The Bull Market in Natural Gas
Pipeline company earnings for 2Q21 were satisfyingly unremarkable, and were followed up recently with news of further givebacks to investors. Cheniere Energy implemented a dividend as part of a comprehensive long term capital allocation plan. They also plan to repay $1BN of debt annually as they target an investment grade rating. The company expects to generate $15-17 per share in Distributable Cash Flow DCF over the long run (stock closed on Friday at $88). The dividend had been long expected – Cheniere exemplifies the industry’s improving balance between growth projects and free cash flow as well as any company.
Williams Companies announced a $1.5BN share repurchase program, having previously announced full year results were trending towards the higher end of earlier guidance.
Overall there were no notable 2Q21 earnings misses versus consensus expectations.
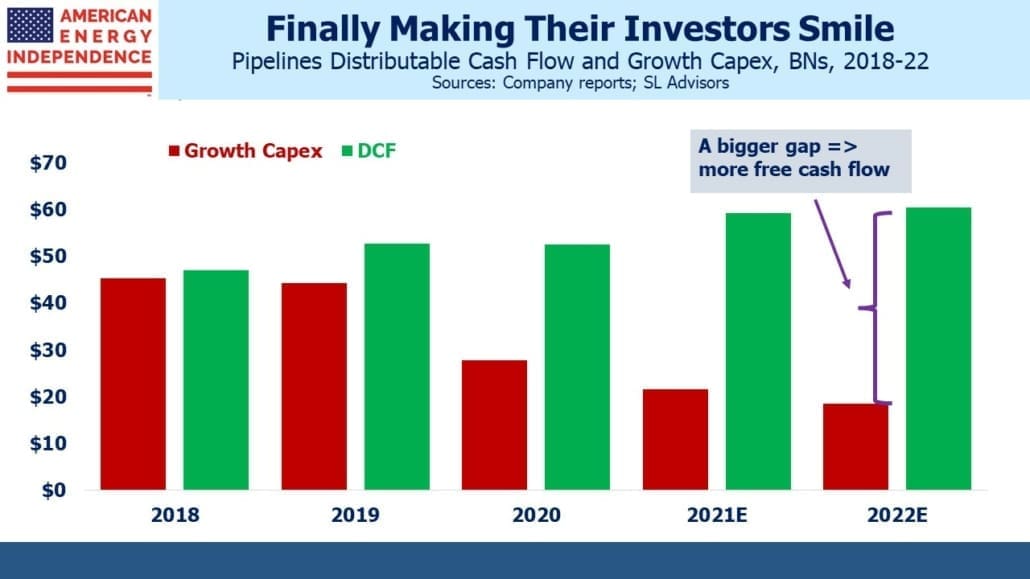
Free Cash Flow (FCF) continues to grow. The pipeline sector has undergone a significant change to its cash generation since 2018, when virtually all its DCF was plowed back into new projects. Investors demanded improved financial discipline, but the Covid shock caused further cuts in growth plans. The Democrat administration has also helped, by continuing to make new fossil fuel production unappealing. However, this hasn’t stopped the White House from appealing to OPEC to offset such policies by increasing crude oil supply (see Is Biden Vulnerable At The Gas Pump?).
Against this backdrop, natural gas prices have been rising steadily. Last winter saw sharp price spikes for all three benchmarks as the northern hemisphere winter delivered periods of severe cold. Traders are preparing for a repeat. Global supply shortages have been exacerbated in recent months by a drought in Brazil which reduced their output of hydropower. Congestion in the Panama Canal has slowed deliveries of Liquified Natural Gas (LNG) to Asia. This has forced some tankers to sail round the tip of South America, adding to transport costs and limiting supply.
European imports of natural gas from Russia have also been lighter than expected, with official explanations from Gazprom being vague and unconvincing. It’s a safe bet that Europe’s increased reliance on Russian imports via Nordstream 2 will at times in the future look ill-advised. On Friday Russia announced the completion of the controversial pipeline.
If crude oil had more than doubled over the past six months, as natural gas has, financial markets would be intently focused on every daily move. Pipeline stocks would be enjoying a similar bull market, even though oil prices affect sentiment more than cashflows. By contrast, rising natural gas prices really are benefitting the US – enabling Cheniere’s LNG export facilities and Williams’ pipeline network to increase cash returns to shareholders.
The spread between US natural gas versus the Asian and European benchmarks is easily wide enough to cover LNG transportation costs. Deliveries to US LNG export terminals are running at 10.9 Billion Cubic Feet per Day (BCF/D), up from 3.7 BCF/D in the same period last year. Last week 20 LNG tankers left US ports carrying 74 BCF of LNG to foreign customers.
Demand is recovering faster than supply. Associated gas output remains flat YTD since oil production from places such as the Permian remains below pre-Covid levels. Dedicated dry gas regions such as the Marcellus and Haynesville are increasing output, but the net result is that domestic prices are being forced up modestly too.
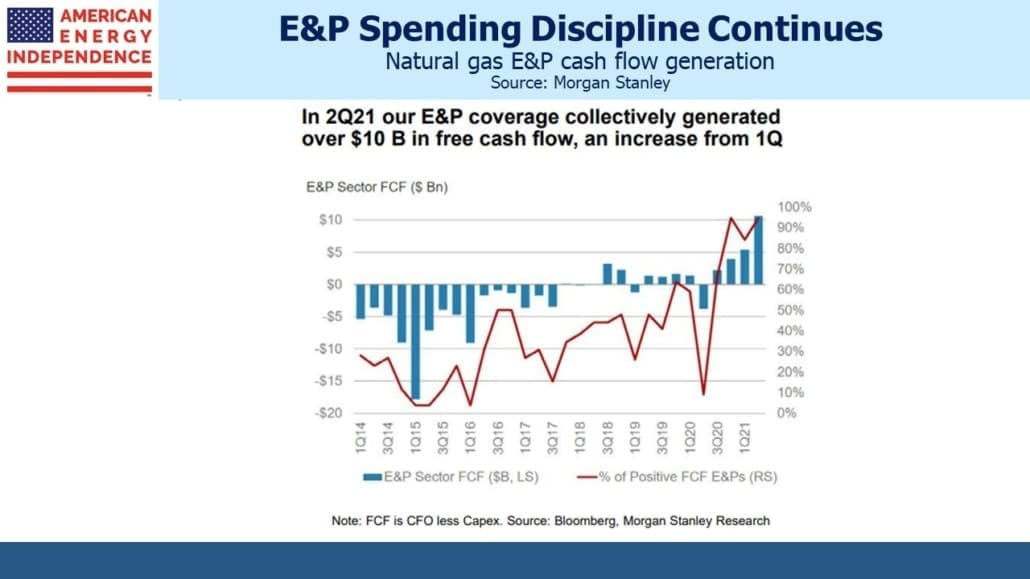
Financial discipline remains strong. Natural gas E&P names covered by Morgan Stanley reached $10BN in FCF for 2Q21, a welcome development after years of negative or flat FCF. These are some of the customers of pipeline companies – upstream as well as midstream is responding to investor demand.
Growing LNG exports are the main driver of increased domestic demand. Production is lagging behind. This led Morgan Stanley to recently ask “Is The Era Of Low Prices Over?” Production is currently running around 93 BCF/D, still below December 2019’s 97 BCF/D just before Covid. Near term risks appear skewed to the upside, especially if the northern hemisphere has a colder than normal winter.
Looking farther ahead, supply is likely to increase, which will bring lower US prices. This is because there still exists ample US supply that can be produced profitably at below $3 per MMBTU. 2-3 BCF/D of increased output looks likely over the next couple of years, much of which will feed our increasing LNG export capacity.
The budget plan making its way through the House of Representatives currently excludes natural gas from its list of “clean” energies eligible for subsidies from the Department of Energy. This is a mistake, since technologies already exist allowing natural gas to be burned cleanly. Carbon capture and sequestration (see Carbon Capture Gains Momentum) and the Allam-Fetvedt Cycle (see Clean Energy Isn’t Just About Renewables) are two examples. Nonetheless, global demand for US natural gas is growing, and puts the domestic pipeline industry in a good position for continued growth.
On a different and more somber topic, it would be remiss of me not to acknowledge the twentieth anniversary of 9/11. Like tens of thousands of people who worked on Wall Street at that time, I am remembering friends killed in that attack. In the first half of my career during the 80s and 90s I traded derivatives with Euro Brokers and government bonds with Cantor Fitzgerald, two firms that suffered substantial loss of life amongst their employees. Everybody remembers their location and what they were doing at that time. Our thoughts are with the families and loved ones of the people who lost their lives on that day.
We have three funds that seek to profit from this environment:
Important Disclosures
The information provided is for informational purposes only and investors should determine for themselves whether a particular service, security or product is suitable for their investment needs. The information contained herein is not complete, may not be current, is subject to change, and is subject to, and qualified in its entirety by, the more complete disclosures, risk factors and other terms that are contained in the disclosure, prospectus, and offering. Certain information herein has been obtained from third party sources and, although believed to be reliable, has not been independently verified and its accuracy or completeness cannot be guaranteed. No representation is made with respect to the accuracy, completeness or timeliness of this information. Nothing provided on this site constitutes tax advice. Individuals should seek the advice of their own tax advisor for specific information regarding tax consequences of investments. Investments in securities entail risk and are not suitable for all investors. This site is not a recommendation nor an offer to sell (or solicitation of an offer to buy) securities in the United States or in any other jurisdiction.
References to indexes and benchmarks are hypothetical illustrations of aggregate returns and do not reflect the performance of any actual investment. Investors cannot invest in an index and do not reflect the deduction of the advisor’s fees or other trading expenses. There can be no assurance that current investments will be profitable. Actual realized returns will depend on, among other factors, the value of assets and market conditions at the time of disposition, any related transaction costs, and the timing of the purchase. Indexes and benchmarks may not directly correlate or only partially relate to portfolios managed by SL Advisors as they have different underlying investments and may use different strategies or have different objectives than portfolios managed by SL Advisors (e.g. The Alerian index is a group MLP securities in the oil and gas industries. Portfolios may not include the same investments that are included in the Alerian Index. The S & P Index does not directly relate to investment strategies managed by SL Advisers.)
This site may contain forward-looking statements relating to the objectives, opportunities, and the future performance of the U.S. market generally. Forward-looking statements may be identified by the use of such words as; “believe,” “expect,” “anticipate,” “should,” “planned,” “estimated,” “potential” and other similar terms. Examples of forward-looking statements include, but are not limited to, estimates with respect to financial condition, results of operations, and success or lack of success of any particular investment strategy. All are subject to various factors, including, but not limited to general and local economic conditions, changing levels of competition within certain industries and markets, changes in interest rates, changes in legislation or regulation, and other economic, competitive, governmental, regulatory and technological factors affecting a portfolio’s operations that could cause actual results to differ materially from projected results. Such statements are forward-looking in nature and involves a number of known and unknown risks, uncertainties and other factors, and accordingly, actual results may differ materially from those reflected or contemplated in such forward-looking statements. Prospective investors are cautioned not to place undue reliance on any forward-looking statements or examples. None of SL Advisors LLC or any of its affiliates or principals nor any other individual or entity assumes any obligation to update any forward-looking statements as a result of new information, subsequent events or any other circumstances. All statements made herein speak only as of the date that they were made. r
Certain hyperlinks or referenced websites on the Site, if any, are for your convenience and forward you to third parties’ websites, which generally are recognized by their top level domain name. Any descriptions of, references to, or links to other products, publications or services does not constitute an endorsement, authorization, sponsorship by or affiliation with SL Advisors LLC with respect to any linked site or its sponsor, unless expressly stated by SL Advisors LLC. Any such information, products or sites have not necessarily been reviewed by SL Advisors LLC and are provided or maintained by third parties over whom SL Advisors LLC exercise no control. SL Advisors LLC expressly disclaim any responsibility for the content, the accuracy of the information, and/or quality of products or services provided by or advertised on these third-party sites.
All investment strategies have the potential for profit or loss. Different types of investments involve varying degrees of risk, and there can be no assurance that any specific investment will be suitable or profitable for a client’s investment portfolio.
Past performance of the American Energy Independence Index is not indicative of future returns.


Leave a Reply
Want to join the discussion?Feel free to contribute!