The Losers From Quantitative Easing

SL Advisors Talks Markets
The Losers From Quantitative Easing
Loading
/

UK Prime Minister (PM) Liz Truss has reached “in office but not in power” in record time. On September 6th she met with Queen Elizabeth II and formally became PM. Two days later the Queen died, commencing a period of mourning that ended with the monarch’s funeral on September 19th. Practically speaking, that’s when Liz Truss’s hold on power began. Four days later her government shocked markets by announcing £45BN ($50BN) in tax cuts funded with borrowing.

Sterling collapsed and by September 28th the Bank of England had abandoned its balance sheet reduction (Quantitative Tightening, or QT) in order to urgently restore financial stability. In the UK bond market pension funds were dumping thirty-year gilts, driving the yield from 3.5% to (briefly) 5%. Conservative party MPs are already discussing ways to dump their new PM.

By Friday self-preservation and market turmoil had forced her to abandon most of the plan, firing her Chancellor of the Exchequer Kwasi Kwarteng for good measure. Truss will henceforth be dodging political regicide following her disastrous start. As the Economist devastatingly observed, her shelf life is about the same as a lettuce.

UK residents are pondering how governmental ineptitude on an epic scale has raised interest rates and made foreign trips more expensive. The rest of us are wondering if it could happen here.

Pension funds and leverage are a poor combination. The solemn trust imposed on those that manage people’s retirement savings requires ensuring market volatility never interferes. Therefore, Liability Driven Investing (LDI), the proximate cause of the turmoil, is worthy of examination. Anytime you see Value at Risk (VaR) included in marketing literature aimed at pension funds, as is the case with LDI, there’s a problem lurking.

Defined Benefit (DB) pension funds are obliged to meet certain obligations in the future, often linked to salary at retirement. Defined Contribution (DC) plans (like 401Ks) are becoming increasingly common, because employers prefer shifting the investment risk to plan participants. The UK has around 5 million people covered by DB plans with assets of £1.8TN ($2TN). For comparison, the US has $16.8TN in DB plans but $13.1TN is in Federal, state or local plans, many of which are underfunded with unclear ultimate outcomes for retirees.

DB pension funds compare their assets with the Net Present Value (NPV) of their obligations to figure out if they have a surplus or deficit. Pensions are among the longest liabilities around, and their NPV is acutely sensitive to changes in the discount rate.

Because US public pension funds follow Governmental Accounting Standards Board (GASB) rather than GAAP, they calculate the NPV of their liabilities oddly, in that they use the rate of return they think they’ll earn on their assets. It creates the perverse incentive to add risky investments since they’ll generally have a higher return, which in turn depresses the NPV of their obligations (see Through the Looking Glass into Public Pension Accounting). The average assumed return on US public pension assets, and therefore the discount rate on their liabilities, is just under 7%. Even though this has been falling, it’s still wildly optimistic.

The UK government issues guidance for DB plan discount rates – currently much lower than the US at  around 2.5% depending on the specifics of the plan.

Treasury Inflation Protected Securities (TIPs) offer a return linked to inflation and are appealing to pension funds with their long liabilities. In the UK index-linked gilts are called “linkers.”

Real yields have been falling for years, and on US government debt have at times been negative. The UK is a more extreme version, presumably reflecting a relatively greater appetite of UK pension funds to immunize inflation risk compared to their US counterparts. The dearth of choices available to UK pension funds is apparent in the 1.5% coupon with which the now plunging 30 year gilts were issued just last year.

Investing at negative real yields guarantees reduced purchasing power. Falling long term rates have hurt UK pension funds by increasing the NPV of their liabilities. In theory equities, which represent a perpetual claim on company profits, ought to compensate. A 1% drop in a thirty year discount rate increases the NPV of a payment due in thirty years by 30% (ie the duration of a 30-year zero coupon bond equals its maturity). Unfortunately, you can’t rely on stocks going up by 30% at the same time.

UK pension plans sought advice on managing their exposure to falling rates, and it was helpfully provided by firms such as Russell Investments in the form of derivatives. Simply put, LDI is a derivatives contract that generates a profit for the pension fund when long term rates fall, the point being that falling rates will lead to a lower discount rate and therefore a bigger NPV of their pension obligations. LDI behaves like an investment in long term bonds, but without the need to spend cash to buy the bonds.

Derivatives contracts, like futures, require counterparties to post margin to one another depending on which side of the contract is in the money. The LDI models on which advice is based are naturally complex and proprietary. Pension funds probably relied on the assumption that losses on their LDI trades would be offset by a reduced NPV of their liabilities, and they could use pension contributions to provide additional margin if required. VaR analysis from their consultants would have provided reassurance.

Two things went wrong. One is that UK linker real yields fell to deeply unattractive levels, causing pension funds to explore risky alternatives. The second is that the new PM’s ill-considered fiscal expansion caught the market off-guard, driving yields up sharply. This in turn shredded VaR assumptions, requiring untimely sales of securities by pensions to cover margin calls on LDI losses. Derivatives create leverage. On one level this is another story of too much risk.

However, the underlying problem is low/negative real yields, and these are caused in large part by Quantitative Easing (QE). Society generally likes low borrowing costs, but every borrower has a lender and pension funds are clearly QE-losers. Central banks have been quicker to grow their balance sheets with QE than to shrink them with QT.

Ironically, the Bank of England provided updated guidance on QT on September 22, the day before Kwasi Kwarteng dropped his fiscal bomb. Six days later they were buying again to mop up the mess.

Buying bonds is now part of the central bank toolkit, and in the US it’s virtually certain that the next recession will be upon us before the Fed has shed its excess $TNs. Although real yields have moved up recently, there’s little reason to think their long term decline has ended. The problems of DB pensions haven’t been solved. But the UK does seem like a unique case of poor investment choices and an impetuous new PM.

Meanwhile the Fed is singularly focused on inflation which increases the odds they’ll make another mistake, upon which they’ll switch back to employment. QE will begin again, becoming a permanent form of debt monetization. 2% long term inflation is a poor bet. This FOMC shuns multi-tasking and fixates on one metric at a time. That will be Jay Powell’s legacy.

Energy’s Asynchronous Marriage

SL Advisors Talks Markets
Energy’s Asynchronous Marriage
Loading
/

The relationship between crude oil prices and pipeline stocks is a perennial subject – why do the toll-like features of midstream energy infrastructure sometimes fail to separate the sector from the vicissitudes of commodity markets?

The truth is they move together more at certain times than others. The 2015 drop in crude caused by excessive production in the US shale patch hit the pipeline sector – unreasonably so since demand remained buoyant throughout. Pipeline stocks rebounded faster than oil. The 2020 Covid collapse reflected a sharp drop in demand because everyone was locked down, so weakness in pipelines made sense although it was exacerbated by some fund managers whose self-confidence exceeded their ability (see MLP Closed End Funds – Masters Of Value Destruction).

The relationship doesn’t just stand out during periods of weakness. The American Energy Independence Index (AEITR) and oil have marched more or less upward together for the past couple of years, a relationship that has elicited few complaints.

Measuring the relationship statistically reveals a positive correlation of around 0.4. They move together, but not so reliably as to allow for one to be used to hedge the other. Our recent blog highlighting the cheapness of oil relative to coal (see OPEC+ Strikes Back) drew several questions about the outlook for crude and whether pipelines were a good way to express a bullish view.

We do think the balance of risks is skewed to the upside. Upstream companies probably offer a more straightforward way to bet on rising crude. Midstream should do well in most outcomes including flat commodity prices.

As we enter earnings season, Factset calculated that the energy sector is all that stands between S&P500 3Q earnings growth and a down quarter. Specifically, +2.4% versus –4.0% ex-energy. Seven of the 11 S&P sectors are forecast to be negative. Moreover, expected energy sector earnings have been revised up this month, to $53.1BN from $50BN.

I will concede that at times the relentless outperformance of a few enormous tech stocks left me less enthused than the typical investor whose portfolio seemed stuffed full of FANG. Therefore, from your blogger’s vantagepoint the recent defanging of the market in favor of hard assets represents an appropriate restoration of relative value.

Mike Shellenberger is an environmental advocate who has written several books and is running as an independent against California governor Gavin Newsom. I read Apocalypse Never: Why Environmental Alarmism Hurts Us All, which offers a break from the shrill alarmism common among many climate extremists with a more sober assessment. Shellenberger is a big supporter of nuclear power, as should be any serious proponent of efforts to lower CO2 emissions. I haven’t read San Fransicko: Why Progressives Ruin Cities but I suspect it offers some useful insights because San Francisco is not what it used to be.

Shellenberger recently gave a presentation in Sydney, Australia in which he argued that increased penetration of intermittent energy into a grid raises its cost.

“The reason is easy to understand,” Shellenberger noted, “Solar and wind produce too much energy when you don’t need them and not enough energy when you do, and both of those impose costs on the electrical grid.”

More solar panels and windmills require increased investment in battery storage and reliable power (such as natural gas) to be there when it’s not sunny or windy.

Electrification of our transport system requires substantial investments in transmission, something Senator Joe Manchin’s stalled effort to improve infrastructure permitting seeks to improve. A few years ago Wood Mackenzie published research that explored what increased Electric Vehicles (EVs) in Texas would mean for their power grid, which operates independently from the rest of the US.

Prajit Ghosh, Wood Mackenzie’s head of America’s power and renewables research, showed that improvements in rapid charging could require 1.2 megawatts of power to charge a 100KW battery in five minutes. Assuming as few as 60,000 EVs in the state (Texas registers around 24 million cars) would use 72 Gigawatts of power, more than half the state’s total capacity. Simultaneous charging of EVs is implausible, except perhaps if a hurricane was approaching and owners rushed to anticipate power cuts when it would be a problem.

EVs make some sense, especially as charging becomes more readily available and quicker. Every EV owner I know loves their car, but also owns a conventional vehicle for long journeys. But there’s no shortage of warnings that the nation’s power grid isn’t ready. Increased electrification is likely to support natural gas demand as much as weather-dependent power.

TC Energy recently announced plans to invest C$146MM in their first Canadian solar project, in Saddlebrook Alberta where on the winter solstice sunset follows sunrise by just under eight hours. For TC Energy it represents a minor investment that burnishes their green credentials.

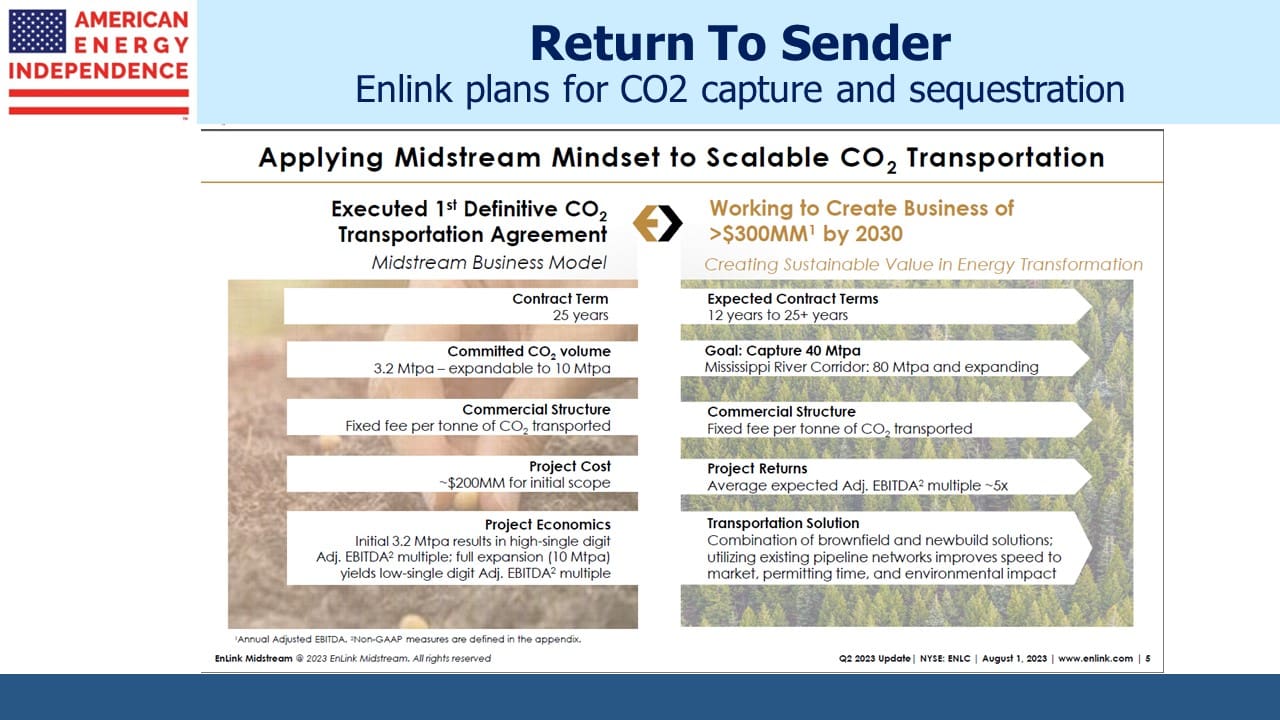
Investments in carbon capture appear more credible, having received a boost in the US from the inaptly named Inflation Reduction Act. Western Midstream and Occidental Petroleum recently announced plans to jointly develop “carbon dioxide (“CO2”) capture, transportation, utilization and sequestration opportunities in and around their existing asset bases in the Texas Delaware and Colorado DJ Basins.”

Alberta is selecting 19 proposals to build carbon storage hubs across the province.

European demand for US natural gas remains strong, as shown by Atlantic LNG tanker rates reaching an all-time high of $397,500 per day. Morgan Stanley recently added up agreements signed since the late February Russian invasion to export 61.27 million tons per annum. In aggregate this is 8 Billion cubic Feet per Day (BCF/D), compared with current US production of around 100 BCF/D and LNG export capacity of around 11 BCF/D. The agreements generally begin 2025-26, reflecting the lead time required to build LNG export facilities. US natural gas is what the world wants.

We have three funds that seek to profit from this environment:

Energy Mutual Fund Energy ETF Real Assets Fund

OPEC+ Strikes Back

SL Advisors Talks Markets
OPEC+ Strikes Back
Loading
/

Recently Shell’s CEO commented that China had added more coal production capacity during the third quarter than Shell’s entire global energy production. It is a response to high prices. We don’t often write about coal because we’re not invested in it. Prices have more than doubled over the past year, although were lower in September (the Fed St Louis series shown is through August). Unburdened by ESG and not visited by Greta, only China can explain how this is consistent with curbing CO2 emissions.  If they do start falling as promised in 2030 it will likely be from a higher level than they currently project.

Interestingly, coal prices compared with crude oil on a BTU-equivalent basis recently converged, for the first time in at least thirty years. They’re not direct substitutes other than in some cases for power generation. Relative to coal, crude oil is historically cheap. The Biden administration does not see it this way, but OPEC+ does.

Aramco Chief Executive Amin Nasser recently warned people are “…focusing on what will happen to demand if recession happens in different parts of the world, they are not focusing on supply fundamentals.” At the same conference, Shell Chief Executive Ben van Beurden said current high prices do not easily translate into a shift in capital allocation given it can take decades for oil and gas projects to produce and start paying off.

Predicting commodity prices isn’t easy, but it does seem that for crude oil the risks are skewed to the upside. Recession fears are widespread, but it’s still not the most likely outcome. The actual drop in OPEC+ output is likely to be around 1.2 Million Barrels per Day (MMB/D) rather than the 2 MMB/D advertised, because several countries are already struggling to produce at their current quota. Nonetheless, Goldman Sachs raised their estimate for crude by $10, to $110 for this quarter and $115 next quarter. “Price risks are skewed potentially even higher,” says Damien Courvalin, head of energy research.

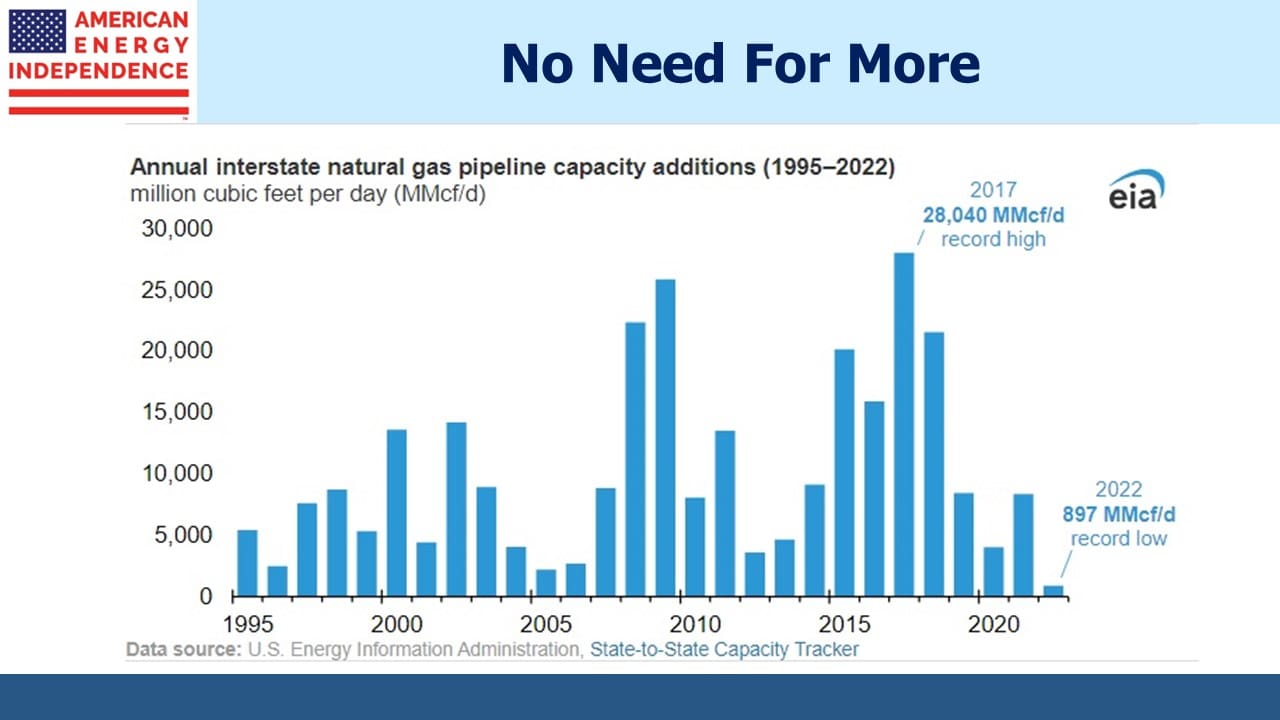
Growth capex has been falling for several years, and as Shell’s van Beurden noted lead times are long. Energy security has suddenly become a priority for Europe following years of policies based on the unsteady foundation that supply would always be there. Without betraying a smile, OPEC Secretary-General Haitham Al-Ghais noted that “Energy security has a price, as well.” He could have added disingenuously that the higher prices OPEC is engineering will stimulate additional investment in future production, something western governments are loathe to do.

Bloomberg columnist Javier Blas wrote, “Currently, oil investment is geared toward a world of stagnant, or even falling, demand — in line with climate-change goals to slash fossil-fuel emissions. The problem is that oil demand not only isn’t declining, but so far this year it’s increasing.”

This is why Goldman’s head of commodity research Jeff Currie argues that the ESG movement is impeding the capex cycle response that would normally follow high prices (see Liberal Energy Policies Remain Good For Investors). Remember to hug a climate protester and drive them to their next protest.

Unlike most OECD countries, Britain has recognized that they need more energy that is reliable. They recently made more licenses available to drill for oil and gas in the North Sea. On cue Greenpeace announced they would be filing a court challenge, confirming the Currie doctrine linking ESG with reduced supply and higher prices.

In the US, the number of Drilled but Uncompleted wells (DUCS) continues to slide, reflecting maintained capital discipline by US E&P companies and skepticism that concern about oil and gas supply will last beyond next month’s midterm elections.

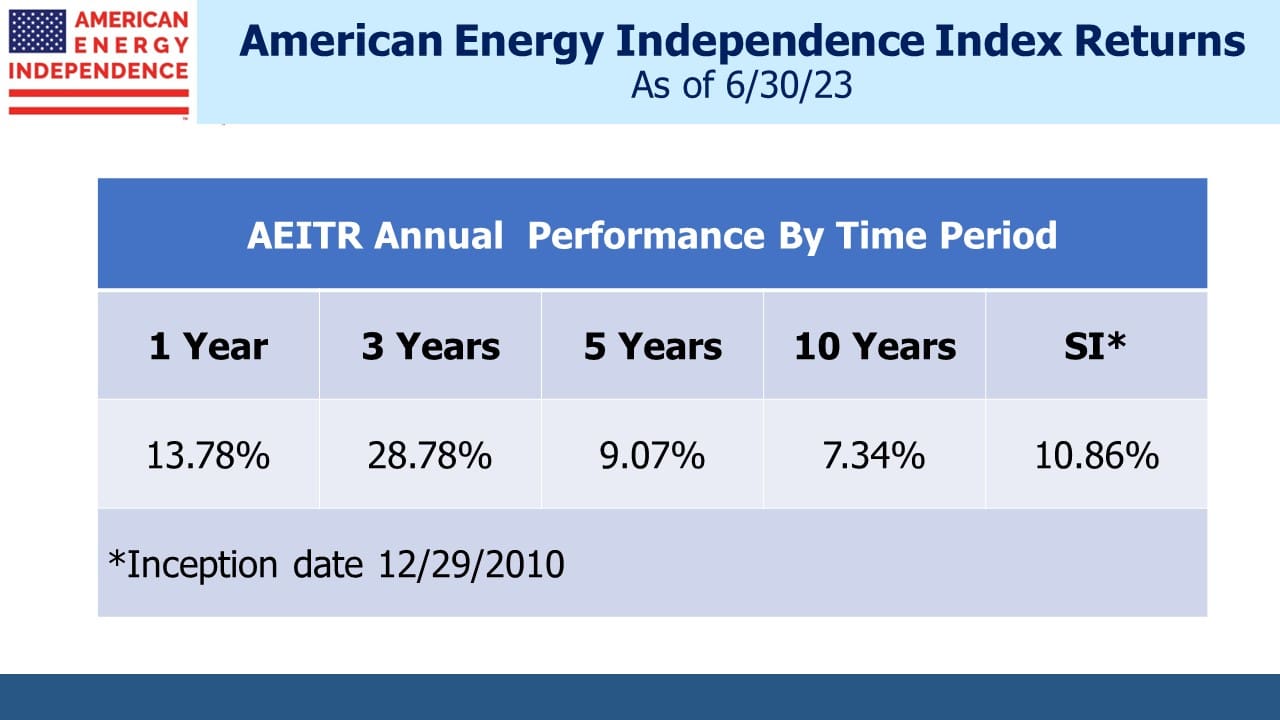
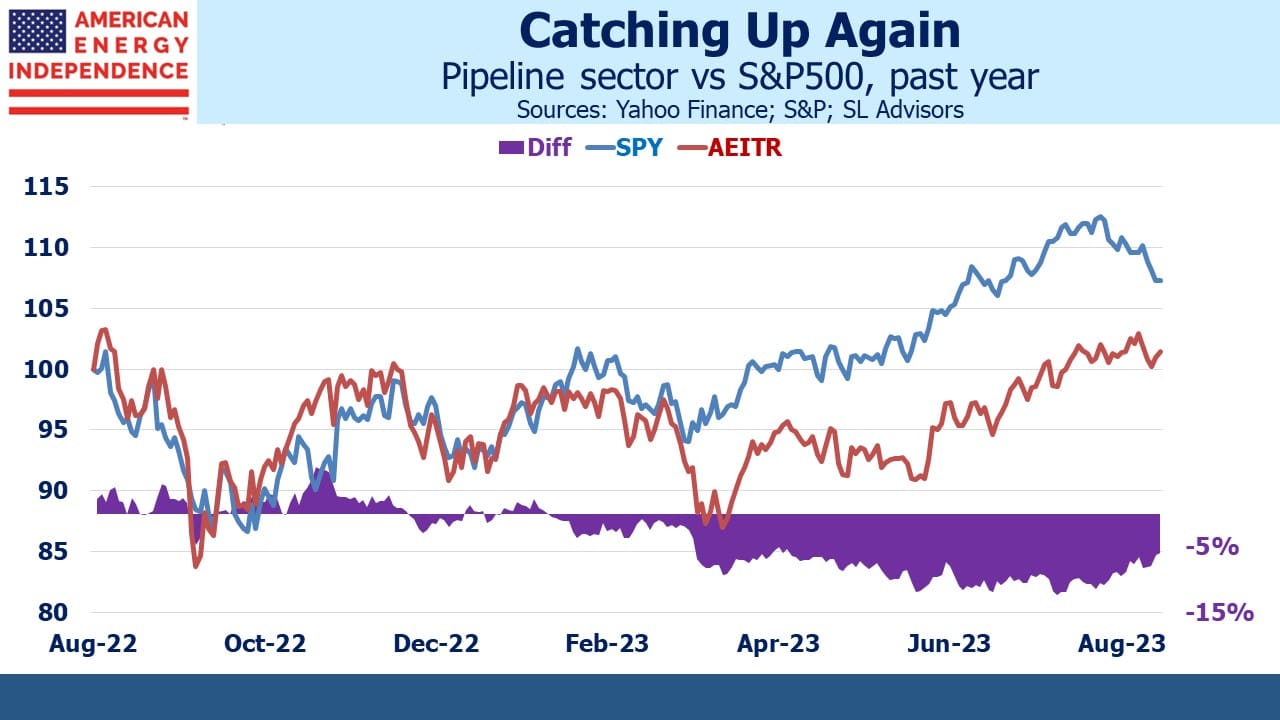
For casual observers energy has been an underperforming sector until recently. It may surprise some to learn that over the past three years midstream energy infrastructure as defined by the American Energy Independence Index (AEITR) has beaten the S&P500 by 4.3% pa. Over the past five years the underperformance gap has narrowed to 1.9% pa. At the end of last year, the AEITR trailing five year return lagged the S&P500 by a whopping 14.7% pa. On current trends it won’t be long before pipelines will be ahead of the S&P500 on this measure.

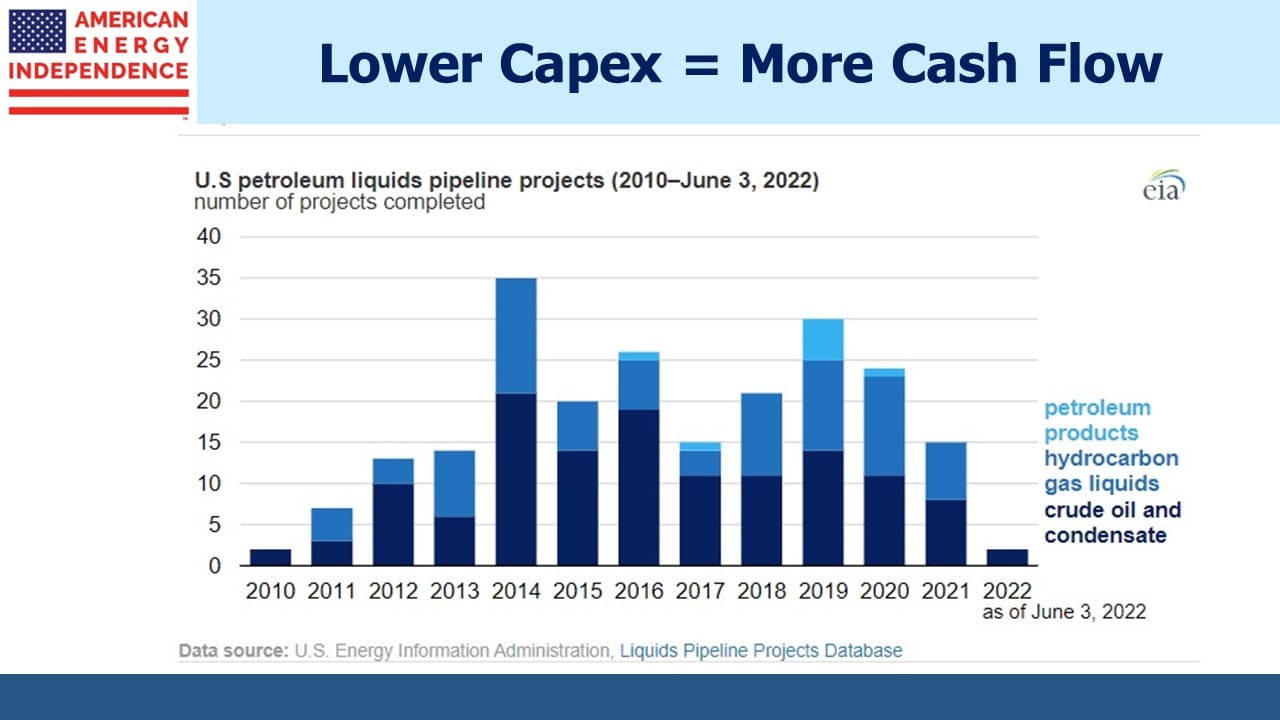
3Q earnings season should provide further evidence of strong dividend coverage, continued growth in cashflows, improving leverage and restrained growth capex.  In addition, the direct link to PPI incorporated in many pipeline contracts provides protection against inflation. In a sea of red ink this year, the sector is an uncommon source of green.

We have three funds that seek to profit from this environment:

Energy Mutual Fund Energy ETF Real Assets Fund
Please see important Legal Disclosures.


What’s Next For Tellurian?

SL Advisors Talks Markets
What’s Next For Tellurian?
Loading
/

Tellurian (TELL) CEO Charif Souki is one of the more colorful executives in the energy sector. In his book The Frackers, WSJ journalist Gregory Zuckerman memorably chronicles his career from a “shaggy-haired Lebanese immigrant” who spent seven years in Aspen where he “skied and bummed around” to founding Cheniere, today’s leading exporter of US Liquefied Natural Gas (LNG).

In 2016 Souki founded Tellurian, planning to develop a greenfield LNG export terminal (Driftwood). It was to be the next Cheniere. He assembled a team of former colleagues and set about designing the facility and signing contracts for construction and LNG shipments. Rounding up enough customers who will commit to long-term Sale and Purchase Agreements (SPAs) is necessary to obtain financing and reach Final Investment Decision (FID). It’s how all these projects progress. There’s no alternate use for an LNG facility, so twenty year contracts are the norm.

Today Souki’s weekly videos draw several thousand views on Youtube. Sycophantic comments are posted by true believers. It always seemed TELL was one SPA away from FID on Driftwood. Souki is the rare CEO who offers a regular public perspective on his business.

In a recent video Souki conceded to “tactical errors” which explain TELL’s slumping stock price. Convinced that the spread between foreign natural gas benchmarks and the US represents a long-term profit opportunity, TELL sought to retain the price risk in the SPAs they negotiated. Cheniere and most other exporters charge a liquefaction fee and seek to avoid exposure to commodity prices. This creates more stable, visible cashflows which lowers their cost of capital.

As Cheniere has shown, they still retain price risk on some contracts which has allowed them to raise their EBITDA guidance three times this year. TELL’s approach offers more upside if differentials remain wide, but the higher risk profile has made investors wary. Large pricing discrepancies have a way of self-correcting. The US is likely to attract manufacturing from Europe because of our cheaper energy, which may push domestic natural gas prices higher and European ones lower.

In August 2021 TELL raised $100 million in a secondary offering at $3 per share, a 25% discount to the prevailing price. Later that year they paid $8 million in cash incentive compensation to senior executives. Once again betraying his risk appetite, Souki publicly contemplated using the balance of the proceeds to help acquire an upstream natural gas E&P company. Although this type of vertical integration made sense with their desire to retain natural gas price risk, TELL should have been positioning itself as the seller not buyer in such a transaction.

Since then TELL has visibly struggled to obtain the financing necessary to build Driftwood. Russia’s invasion of Ukraine provided a boost to the US LNG sector, and Souki must have salivated at the huge prices European buyers have paid for LNG shipments. In March TELL announced construction of Driftwood had begun, in an attempt to create a sense of inevitability around their plans and draw investors in.

Falling stock and bond markets have reduced risk appetites. Last month TELL pulled a bond offering, presumably because the yield investors required was too high. In his recent video, Souki acknowledged that retaining price exposure to natural gas had been a mistake. They recently let two SPAs lapse. There is no longer any clear timeframe for FID on Driftwood.

Souki is used to adversity. Cheniere was originally planning to import LNG to compensate for falling domestic production. The Shale Revolution turned this calculus upside down. Souki pivoted to developing an export business – a non-trivial change since regassifying LNG imports uses very different equipment than chilling natural gas and loading it onto LNG tankers.

In spite of this success, in 2015 Souki was forced out of Cheniere by Carl Icahn who objected to excessive compensation and Souki’s desire to create a marketing arm to trade natural gas. He soon founded Tellurian.

Last year Souki received total compensation of $20,182,005 according to TELL’s proxy statement. Even Kinder Morgan, not known for a parsimonious philosophy towards its senior executives, restrained themselves to $18 million for CEO Steve Kean. There aren’t many analogous LNG start-up companies – NextDecade (NEXT) is the only true comparable. So TELL’s list of peers for compensation consists of profitable companies whose operations are generating positive cash flow, not something TELL can currently boast.

NEXT is included in TELL’s peer group, and paid its CEO Matthew Schatzman $9,202,686 last year. Even Cheniere’s CEO Jack Fusco was paid less than Souki last year at $18,091,084.

Charif Souki’s problem, identified by Carl Icahn back in 2015 when he was on Cheniere’s board of directors, is that he likes pay for performance in advance.

Stock prices for TELL and NEXT were approximately tracking each other through Russia’s invasion in February which boosted both. But in recent months TELL has slumped as investors tired of the promised financing to reach FID on Driftwood. Meanwhile NEXT has pushed ahead with signing SPAs, and we think they will reach FID on two, possibly three “trains” to deliver LNG to awaiting tankers by the end of this year. Of the two, NEXT now seems much more likely to execute their plan.

Souki offered his mea culpa on Youtube which was forthright of him even if he didn’t offer to return some of his already advanced performance-based compensation.

The lesson here is that investing alongside Charif Souki may work out – it did at Cheniere. But it always works out for Souki. Expect to see repriced stock option awards as a necessary step to keep him motivated. Whatever comes next for TELL, we think NEXT is a better run company.

We have three funds that seek to profit from this environment:

Energy Mutual Fund Energy ETF Real Assets Fund
Please see important Legal Disclosures.


Inflation Expectations Are Too Optimistic

SL Advisors Talks Markets
Inflation Expectations Are Too Optimistic
Loading
/

Although inflation has soared to levels not seen in forty years, expectations for future inflation have stayed remarkably low. This is evident in the bond market, where the spread between five year treasury notes and five year Treasury Inflation Protected Securities (TIPS) is 2.4%, implying average inflation of that level. The forecast over ten years is similar. Inflation over the next year is clearly going to be higher. JPMorgan estimates around 4.5%. So one can infer that the bond market is forecasting inflation starting in one year of less than 2%.

Such low rates suggest a virtually unshaken confidence in the Fed’s ability to restore price stability. Moreover, the CPI tends to run 0.2%-0.4% higher than the Personal Consumption Expenditures (PCE) Deflator, the Fed’s preferred measure. This is because the weights in the PCE update dynamically to reflect actual consumption, whereas the CPI weights are updated once a decade.

The Fed could interpret these market-based forecasts to show that long term inflation doesn’t present a problem. While it’s true that ten year inflation expectations have been trending higher since the pandemic, it peaked in April at 3% and has been declining ever since.

It’s possible that Quantitative Easing distorted the market forecasts that the bond market would otherwise provide. Although the Fed is now letting its holdings run off, they still hold over $5.7TN in treasury securities and $2.7TN in mortgage-backed securities. Return-insensitive investors including from Japan ($1.3TN) and China ($1TN) keep yields lower than they would be otherwise, reducing the inflation forecast embedded.

But the Federal Reserve also owns almost $400BN in TIPs, where their buying would have the opposite effect on inflation expectations. It’s hard to say what the net distortion is, if any. The Fed owns 24% of our $21.25TN in bills, notes and bonds outstanding versus 26% of the TIPS. Central bank activity since the 2008-09 financial crisis has rendered the forecasts embedded in the bond market less useful.

Other measures of future inflation confirm the benign outlook of bond investors. The University of Michigan survey shows consumers expect 3% inflation over the next five years and 5.1% over the next twelve months, which implies around 2.5% after one year.

The constrained outlook provides the Fed with an excuse to pause tightening (i.e. declare victory and withdraw) at any time. They seem to be focused on current data even though monetary policy is widely understood to impact with a considerable lag. There seems to be no risk premium to allow for the possibility that inflation fails to return to 2% in a timely manner.

Goldman’s global head of Commodities Research provided an interesting perspective on the Meb Faber Show (podcast) last week. For at least a year after inflation surged the Fed blamed supply problems related to the pandemic. In abandoning “transitory” they embraced the traditional approach of tightening policy to slow demand.

Currie argues that demand for commodities is driven by developing countries where most of the world’s population is striving for higher living standards and consuming more of everything. Proponents of ESG investing are impeding the capex cycle that would typically see greater investment in supply in response to higher prices.

For example, the Dallas Fed Energy Survey found widespread concern among executives about public policy. Comments included this: “The biggest issue we have in our industry is the federal government, which advocates for our extinction. This has affected our ability to hire new, young talent from colleges because they’ve been brainwashed into believing that our industry is bad and that our industry is disappearing, with no future for them. This will be an issue in our industry and the public will pay with higher commodity costs. The capital being chased out of our industry is leading to less supply, and that always leads to higher prices.” He might have added that rising interest rates also impede the investment of capital in new production.

This illustrates how environmental extremism is inflationary. By attacking supply without addressing demand, it impedes investment in new supply. Fortunately, public companies are starting to push back. When Rep Rashida Tlaib (D-MI) asked JPMorgan CEO Jamie Dimon if he would endorse her ESG platform by ceasing funding of new oil and gas projects, Dimon responded, “That would be the road to hell for America.” Goldman’s Currie argues that this commodity cycle will see a constrained investment in new supply because of lunatics like Tlaib.

In the UK, newly installed Chancellor of the Exchequer (US equivalent is Treasury Secretary) Kwasi Kwarteng is likely to become the shortest-tenured in history. The UK is showing what happens when US-style fiscal profligacy is attempted without the benefit of being a superpower issuing the world’s reserve currency. An op-ed in the Financial Times described the borrowing splurge to fund elimination of the top rate of income tax as “Reaganomics without the dollar.”

UK bond yields have soared, prompting the Bank of England to shelve plans to reduce their balance sheet in order to support the market. Conservative PM Truss, half of whose three weeks in office has been spent in mourning for the late Queen with the other half managing a self-induced crisis, blames Russia’s invasion of Ukraine for the bullet in her foot.

Britain’s GDP growth ranks 19th in the G20, only ahead of Russia.

Sometimes voters make choices that aren’t in their best interests. Brexit is the proximate cause of sluggish UK growth, by choosing increased barriers to trade with the EU and by extension to most of the free world. Truss’s fiscal expansion is a response of the party that championed Brexit to its dismal economic result. Critics include the IMF, Ray Dalio, and Atlanta Fed president Raphael Bostic.

The hapless UK chancellor dubbed “Kami-Kwasi” by the tabloid press is likely to be sacrificed as a face-saving measure before the proposed fiscal expansion is inevitably diluted. If US politics gets you down, following the UK will remind that things could be worse.

We have three funds that seek to profit from this environment:

Energy Mutual Fund Energy ETF Real Assets Fund

Please see important Legal Disclosures.


Natural Gas Demand Remains Firm

SL Advisors Talks Markets
Natural Gas Demand Remains Firm
Loading
/

Midstream energy infrastructure lagged the market sharply following last week’s FOMC meeting with its revised dot plot. The odds of a recession have increased. Although infrastructure businesses have very visible cashflows, enough holders operate on a hair trigger that requires little inducement to sell. It’s doubtful you’ll see any revision to guidance as a result of the last few days.

Increasing demand for US natural gas provides a strong underpinning. NextDecade was the subject of a positive article by RBN Energy (see Jump In The Line, Part 4 – NextDecade Eyes FID On Rio Grande LNG Project With Carbon Capture). They have signed commitments for 75% of the capacity of their first two Liquefied Natural Gas (LNG) trains – the name given to the structures that chill and condense methane before its loaded onto specialized LNG tankers.

A Final Investment Decision (FID) to move ahead with construction of the Rio Grande LNG facility in Brownsville, TX is expected before year’s end. Further selling agreements may result in FID on three trains. At its full capacity of five trains, NextDecade’s Rio Grande LNG terminal will ship 3.6 Billion Cubic Feet per Day (BCF/D) of natural gas. Cheniere, the leader, currently ships 5-6 BCF/D. NextDecade also promises to capture 90% of the CO2 expended at Rio Grande, a feature likely to appeal to climate-conscious European buyers. 

US LNG exports will increase, but the results will take several years to show up given the complexity of construction. LNG contracts are typically designed with a liquefaction fee and limited price exposure to natural gas for the LNG operator.

NextDecade’s success contrasts with Tellurian’s struggles to obtain financing for their project. Tellurian’s bullish view on natural gas prices meant they structured agreements such that they retained price risk. Consequently, they have found it hard to attract investors for this riskier business model. Two selling agreements recently lapsed, so Tellurian moved a step farther away from FID.

Meanwhile, some US drillers are prioritizing natural gas production over crude oil. In west Texas, “associated gas” produced along with crude oil, has often been flared – capture and transportation being unprofitable. Today that is reversing, as increased global demand for LNG trickles through the energy sector (see Dregs of US Oil Patch Are More in Demand Than Crude Itself).

Critics of the Federal Reserve are finding more ammunition. Former NY Fed president Bill Dudley believes the Fed is underplaying the pain of inflation fighting. He thinks the unemployment rate (currently 3.6%) will need to rise much higher than the FOMC projected peak of 4.4% in order to meaningfully impact inflation. He notes still very benign long term inflation expectations – ten years of 2.4% based on US treasuries. Dudley fears that the Fed will lose support for its policies when it becomes clear rates must move higher than expected.

We’ve pointed out the weaknesses in Owners’ Equivalent Rent (OER), the statisticians’ measure of the service (shelter) a home provides (see The Fed Is Misreading Housing Inflation). Yesterday the Case Shiller 10-city composite index of home prices recorded a 14.9% annual increase, down from 17.4% the prior month.

Home price index futures (yes, they do exist) present a gloomy outlook for housing. CME Metro Area Housing Index futures imply a 9% drop over the next year. At the depths of the 2008-09 financial crisis the Case Shiller Metro Area Home Price Index (on which the futures are based) registered a –12.8% annual drop in February 2009.

If the market forecast is correct, we’re in for more than just a little softness. Nonetheless Fed chair Jay Powell said at last week’s press conference that he expects shelter inflation to, “remain pretty high for a while.” He knows OER has little to do with home prices.

We continue to think that over the long term 3% inflation is more likely than 2%. Voters long ago ditched any tolerance for pain to reduce the Federal deficit, the outlook for which steadily worsens. There’s no reason to believe that higher unemployment today in search of lower inflation tomorrow will garner widespread support once the newly unemployed realize they’ve been sacrificed for the greater good.

For evidence of today’s demand for pain-free economics, look no further than the president’s student loan forgiveness program which the nonpartisan Congressional Budget Office (CBO) estimates will cost $400BN. Even the New York Times seems to have lost some enthusiasm. Critics note that the CBO analysis excluded, “a plan to reduce payments for future borrowers who go on to earn low incomes after college, which outside analysts say could cost hundreds of billions of dollars more.”

You might think that, since the student loan problem is caused by young people borrowing to purchase educations inadequate to subsequently deliver sufficient income for repayment, thoughtful policy might seek to dissuade more of the same.

Apparently all this can be achieved through an executive action by the president. A country where such is possible seems likely to find slow debt monetization with 3-4% inflation preferable to fiscal and monetary discipline. We believe midstream energy infrastructure offers attractive upside in such circumstances.

We have three funds that seek to profit from this environment:

Energy Mutual Fund Energy ETF Real Assets Fund
Please see important Legal Disclosures.


In Case it’s Not Clear, Rates Are Going Up

SL Advisors Talks Markets
In Case it’s Not Clear, Rates Are Going Up
Loading
/

“I have approximate answers and possible beliefs in different degrees of certainty about different things, but I’m not absolutely sure of anything.”

Fed chair Jay Powell did not say this at his press conference on Thursday. It is attributed to American physicist Richard Feynman. But had Powell uttered these words they would not have seemed out of place. Having overseen a largely avoidable spike in inflation by maintaining monetary accommodation for at least a year too long, the FOMC has turned their focus on its resolution. Thus are they laying the groundwork for their next mistake.

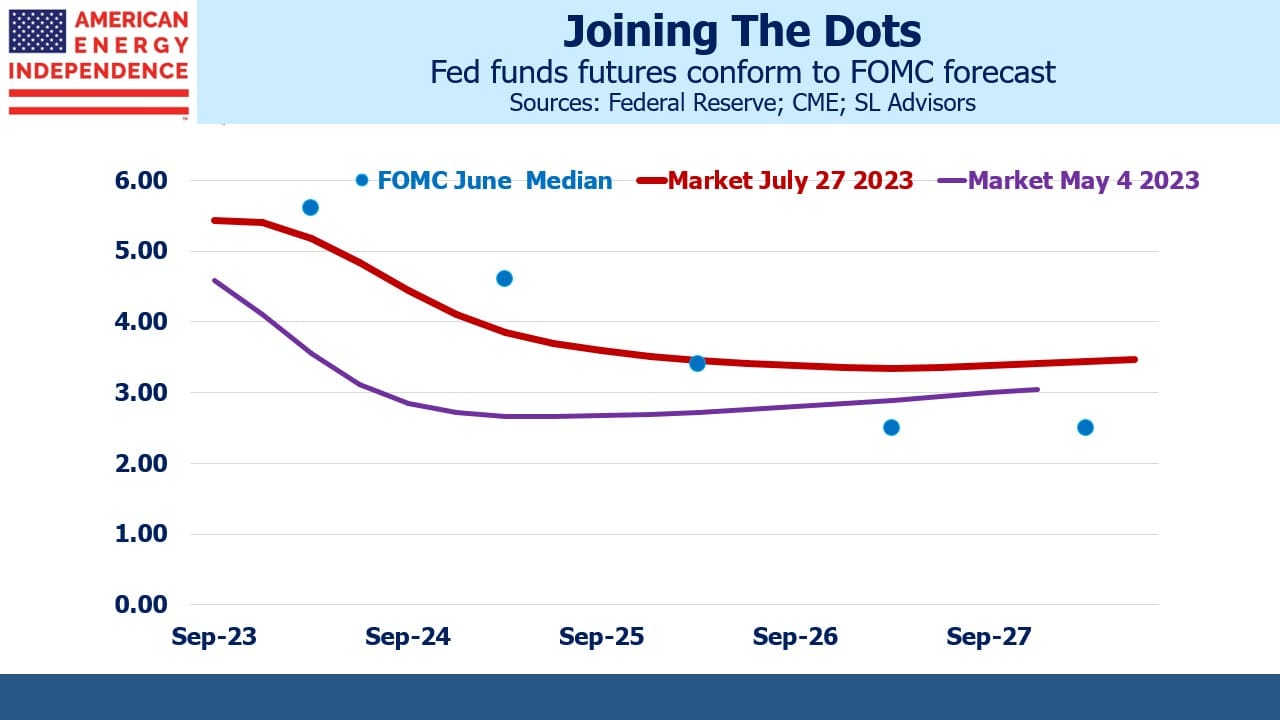
The revised dot plot projects a sharp increase in the Fed funds rate – in fact for now the FOMC is ahead of the market in their assessment of the rate cycle peak. The 2024-25 area of the futures curve is 0.50% lower than the latest Summary of Economic Projections (SEP). Fed policy can best be described not as managing a dual mandate that balances employment with price stability, but as attending to whichever of these two objectives is most out of line. Consequently, the warnings of hardship to come as the Fed drives up unemployment so as to soften wage growth and, in turn, inflation.

The SEP doesn’t portend much hardship. It projects unemployment averaging 4.4% in the fourth quarter of next year and 2024, so presumably peaking around that level. Before the pandemic many held full employment to be around 4.5%, so this hardly looks like a forecast of economic misery. PCE inflation, the Fed’s preferred measure and generally lower than CPI, is forecast to reach 2% by 2025.

Prior to the pandemic, the Fed emphasized full employment and tolerated a modest inflation overshoot. It seems reasonable to assume they’ll swing too far the other way now. Because inflation is the Fed’s focus, it’s likely unemployment will miss to the upside.

There’s little to fault so far in the current tightening cycle other than its tardiness. But the FOMC exhibits the weakness of committees in that they’re slow to reach a consensus and because of this they’re slow to reach a new one. Crisp decision making is not a hallmark of Powell’s FOMC.

Fed critics are increasingly numerous and will become more vocal as rates rise. The actionable conclusion from this analysis is to bet that yields on 2024-25 short term interest rate futures will rise towards the blue dots. This FOMC wants to compensate for their inflation mistake by snuffing it out reasonably quickly. Their SEP says as much. The risk, as in most tightening cycles, is that they’ll overshoot and cause a recession. Achieving the benign combination of modestly rising unemployment with declining inflation remains an inordinately optimistic outcome.

Last Sunday we showed how the inflation stats rely on a lagging measure of home prices to calculate shelter inflation (see The Fed Is Misreading Housing Inflation). Owners’ Equivalent Rent (OER), is a survey that asks what homeowners believe they could rent their home for as a way to measure inflation in the cost of shelter, the service that a home provides. Shelter inflation was an important factor in the recent high CPI report. When asked, Chair Powell said, “I think that shelter inflation is going to remain high for some time. We’re looking for it to come down, but it’s not exactly clear when that will happen… So I think on shelter inflation you’ve just got to assume that it’s going to remain pretty high for a while.” Later he referred to the “red hot housing market” adding that, “we probably in the housing market have to go through a correction.”

This acknowledges the problem in using OER. It’s a non-cash item that lags the housing market but constitutes 31% of the CPI. The PCE deflator also uses OER but assigns a lower weight to shelter than does the CPI. It was interesting that Powell expects shelter inflation to remain high – it would seem an odd view to hold unless he’s also aware that OER lags the actual cost of housing.

There are increasing signs of softness in home prices, with rising mortgage rates being the culprit. Data from Zillow shows prices in San Francisco and Los Angeles both dropped 3.4% in the past month. Just as they missed the booming housing market because OER was slow to react, the Fed is likely to assess higher than actual inflation as OER lags on the way down. Mike Cembalest at JPMorgan recently wrote that “housing is imploding.”

I don’t think the Fed knows how to process information about house prices as it relates to inflation.

Another illuminating comment from Powell on the rate cycle was, “…you want to be at a place where real rates are positive across the entire yield curve.” Presumably a positive yield on ten year TIPs would suffice for the long end, but it’s unclear whether this means the Fed funds rate must be higher than current inflation, or simply above near-term inflation expectations.

At some point we’ll find out. For now monetary policy is being led by a group that, while not conceding one large policy error is nonetheless focused on avoiding a second one.

We have three funds that seek to profit from this environment:

Energy Mutual Fund Energy ETF Real Assets Fund
Please see important Legal Disclosures.


Why Liberal States Pay Up For Energy

SL Advisors Talks Markets
Why Liberal States Pay Up For Energy
Loading
/

The northern hemisphere winter is approaching, which means more opportunities for amusement or shock at New England’s masochistic energy policies. Massachusetts and neighboring states have denied themselves access to abundant US natural gas in the Marcellus shale in Pennsylvania by preventing the construction of new pipelines that would connect them. As with most initiatives embraced by climate extremists, this one rests on the questionable belief that making it harder to use natural gas for power generation will somehow shift demand to renewables.

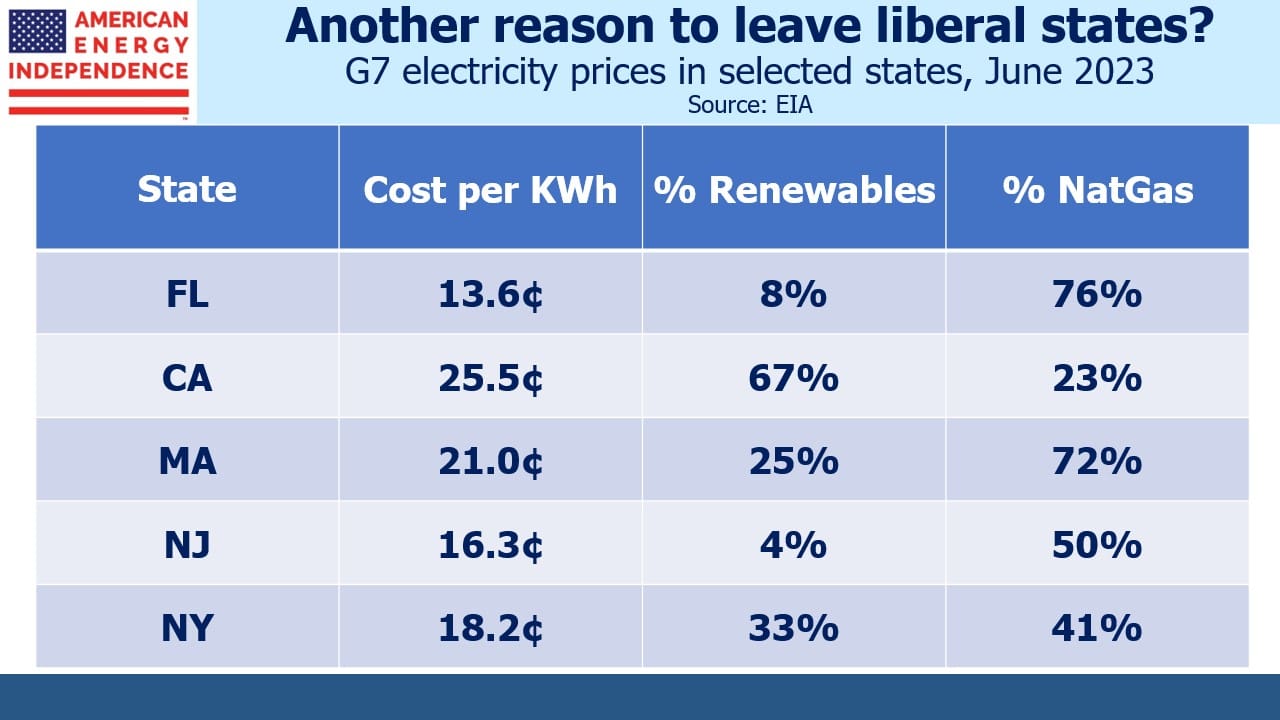
The US Energy Information Administration (EIA) is forecasting a 7.5% increase in the retail price of electricity this year. However, the pain of higher energy prices will not be spread evenly. Eversource Energy, a New England based utility with about four million customers, recently more than doubled rates from 10.67 cents per Kilowatt Hour (KWh) to 22.57 cents per KWh.

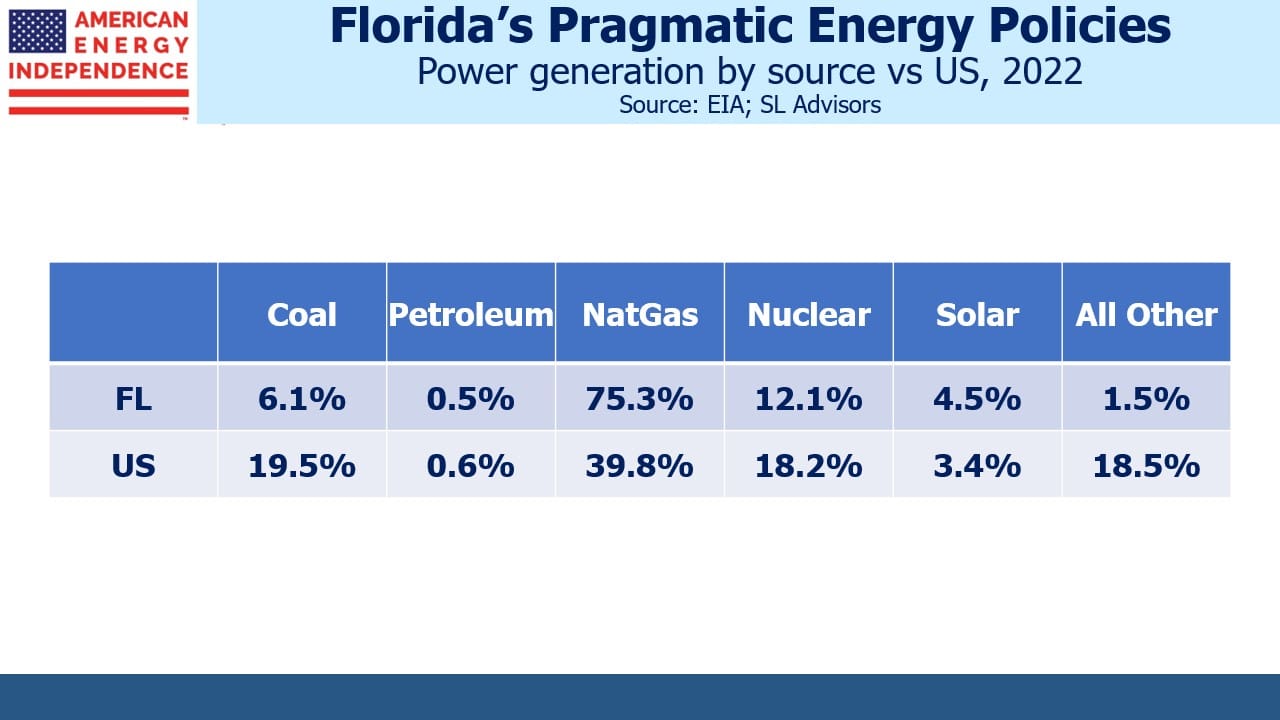
The New England Independent System Operator (ISO) reports that last year natural gas represented 46% of the energy used to generate electricity, above the US average of 38%. Liberal politicians in Massachusetts and neighboring states may be hoping that preventing new natural gas pipelines will somehow reduce its consumption, but instead shipments of Liquefied Natural Gas (LNG) are covering the shortfall. On its website the ISO notes that following the shale revolution, “… natural gas generators became the go-to resource for New England.” Not sharing politicians’ zeal to impede access to reliable energy, the ISO warns, “… we are finding that during severe winter weather, many power plants in New England cannot obtain fuel to generate electricity.”

In August Boston took delivery of its tenth LNG shipment of the year, bringing their seaborne imports to 16 Billion Cubic Feet. They have to compete with strong demand from European buyers, where LNG prices have been as much a 10X the US Henry Hub benchmark, currently around $8 per Million BTUs (MMBTUs). If Boston paid a mere $30 per MMTBU premium, that’s almost $0.5BN more in expense than if they were able to access this supply domestically.

Customers in New England are used to paying more than the US average for electricity. Retail sales of electricity in Massachusetts are around 50 Million Megawatt Hours annually. The average US price is 10.19 cents per KWh. In Massachusetts it’s 18.19 cents.

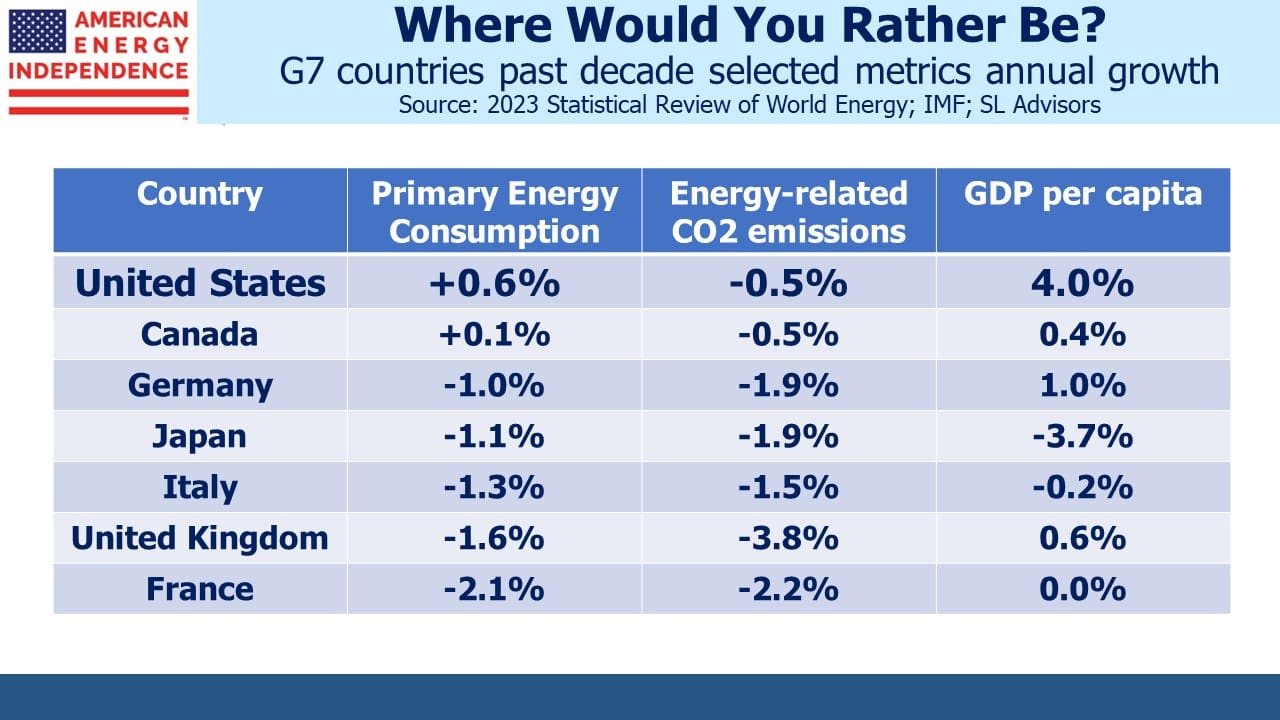
CO2 emissions have fallen over the past decade across the US to around 5.2 Gigatons (2019), down by 4.4%. Coal to gas switching is the biggest driver. Massachusetts has done a little better, lowering emissions by 7 million tons or about 10%.

If we assume that residents of the Bay state are paying an extra 5 cents per KWh for their electricity to achieve this CO2 reduction, that works out to $2.5BN in added expense. Divided by the 7 million tons of reduced CO2 means Massachusetts is spending $357 per ton.

This is an astronomical amount. The recently passed Inflation Reduction Act provides tax credits of $80 per ton for CO2 that is captured and permanently sequestered underground. Exhaust from ethanol production generates high concentrations of CO2, which makes this a likely use for the tax credit. Direct Air Capture, which pulls CO2 out of the ambient air where it exists at around 412 parts per million, will earn a $180 tax credit for its permanent storage underground.

CO2 tax rates in Europe vary widely. France is €45 per ton ($45) and Sweden is the highest at €117.

Surveys tend to reveal that support for public policies aimed at reducing greenhouse gas emissions is broad but shallow. Gasoline prices have been rising for most of the Biden administration. Global investment in new oil production remains too low to maintain supply at current prices. E&P companies recognize the impediments to new production represented by environmental extremists and left-wing energy policies. Together they have succeeded in driving pipeline sector free cash flow yields to over 10% because new pipeline construction is much less common. As I often say, if you meet a climate extremist, give them a hug and drive them to their next protest.

The Administration has been emptying out the Strategic Petroleum Reserve in recognition that high prices at the pump have political downside. For the same reason, a US carbon tax has never commanded much support even though it would cause more efficient capital allocation.

But there are clearly some parts of the US with a greater tolerance for higher energy prices if perceived to be in support of emissions reduction. New England’s energy policies present an example of what to avoid for many of us, but utility bills aren’t becoming a political issue.

Annual CO2 emissions in California fell by 12 million tons (2009-19), a 3.3% reduction. Assuming Californians are also paying 5 cents per KWh for this achievement, that works out to a stunning $1,042 per ton, along with an inadequate grid that recently asked Tesla owners to refrain from charging their cars.

Climate extremists could point to both these states as evidence that consumers will accept higher energy prices in support of their policies. Or they may calculate that the very high price per ton of CO2 some consumers are paying will draw unwelcome attention to the results of liberal energy policies.

Both states have found that impeding natural gas consumption leads to unexpected difficulties – either LNG imports to Boston or the risk of power cuts in California. Natural gas is hard to beat. It’s displaced a lot of US coal production, including in Newburgh, IN where a strip mine formerly operated by Peabody Coal is now the bucolic Victoria National Golf Club. The energy transition is good.

We have three funds that seek to profit from this environment:

Energy Mutual Fund Energy ETF Real Assets Fund
Please see important Legal Disclosures.

The Fed Is Misreading Housing Inflation

SL Advisors Talks Markets
The Fed Is Misreading Housing Inflation
Loading
/

The August CPI report that came out last Tuesday was the catalyst for a sharp market reversal. The headline number was a benign 0.1%, helped by falling gasoline prices. But the “core” number (ex food and energy) came in at 0.6%.

There were several factors, but chief among them because of its high weighting was shelter at 0.7%. which has a 32.3% weighting in the CPI. Food is 13.5% energy is 8.8%. When these two are removed to create the core figure, shelter’s weighting rises to 39.8%.

Within the core CPI number, Shelter is made up of Rent (9.3%) and Owners’ Equivalent Rent (OER, 30.5%), on which we have written before (see Why You Can’t Trust Reported Inflation Numbers). Two thirds of American households own their home. But the economists at the Bureau of Labor Statistics (BLS) want to separate out the service that a home provides (shelter) from its value as an asset.

To estimate OER, BLS statisticians survey homeowners to ask what they think they could rent their home for in the current market. The huge problem with this approach is that few of us give the matter much thought. Homeowners generally know what their home is worth, but you won’t hear cocktail chatter about how the imputed rent on one’s townhouse suddenly shot up.

Home ownership is the prevailing choice of shelter in America. Therefore, OER has a substantial weight in the BLS assessment of living costs, even though uniquely within the CPI it’s not based on cash transactions.

The shortcomings in OER are about to complicate monetary policy.

In theory, if home prices are rising this should cause rents, including the OER, to rise as asset owners seek to maintain their return on investment.

Everyone outside the BLS knows real estate has been hot. Home buyers have regularly been required to pay over the asking price to get a deal done. The S&P/Case-Shiller U.S. National Home Price Index (C-S) has reflected this, increasing year-on-year at 18% as of June (the most recent figure available).

There are signs that the tight real estate market is moderating. The C-S index was rising at 20.6% in March and April. By contrast, OER is now rising, although as the long-term chart shows it fluctuates less than home prices.

But what’s really interesting is that OER is a lagging indicator. From 2000-2020 one year returns on C-S and OER have a correlation of only 0.35. Lagging OER improves the fit, and it turns out the 18 month lagged OER has a correlation of 0.75 with C-S.


The reason is likely that home owners are slow to convert changes in home prices into revised OER, because OER doesn’t affect them. Nobody pays OER. It takes over a year of rising (falling) home prices to show up as an increase (decrease) in OER. Homeowners have a slow reaction function. Inconveniently for the BLS, most of us just don’t think much about renting out our home.

This highlights a significant weakness in how the Fed assesses inflation. The rise in OER they’re observing today is a delayed reaction to the rapid house price appreciation the rest of us have been watching since the beginning of the pandemic in early 2020. Back then, the Fed didn’t see housing inflation because OER didn’t reflect it. Belatedly, it is showing up in the CPI.

Because the history of OER shows it reacts to home prices with a substantial lag, this means the shelter component of CPI is likely to look worse in the months ahead. Its large weight in the core CPI will keep this measure elevated. In this respect, it’s fair to say that the Fed is fighting the last war. In their public comments FOMC members have been very clear that they are looking for a sustained drop in inflation. It was higher than they thought six months ago, if not for the lagged feature of OER.

The fact that inflation expectations remain surprisingly moderate doesn’t appear to be an important consideration.

Core CPI is unlikely to fall substantially while OER is rising. Although the Fed prefers the Personal Consumption Expenditures deflator because of its dynamic category weightings, OER is used there too.

The inverted yield curve for interest rate futures makes more sense when you consider the slow reaction function of OER survey respondents. As long as the Fed uses this measure of housing, they’ll be relying on an echo of the past rather than real time. Based on the historical relationship between C-S and OER, the shelter component of the inflation statistics likely won’t peak for another year. It means the Fed is more likely to make the mistake of maintaining high rates for too long by relying on stale inflation data for shelter.

Only an economist could love OER. It’s about to play an outsized role in monetary policy for all the wrong reasons.

We have three funds that seek to profit from this environment:

Energy Mutual Fund Energy ETF Real Assets Fund
Please see important Legal Disclosures.


Another Pleasant Suprise From Cheniere

SL Advisors Talks Markets
Another Pleasant Suprise From Cheniere
Loading
/

On Monday evening Cheniere provided their third revised EBITDA guidance of the year. It’s good that they’re not based in the EU where they would be a target of the planned windfall profits tax. Cheniere has raised guidance by $1.2BN (after 1Q earnings), $1.6BN (after 2Q earnings) and now another $1.2BN pointing to a range of $11.0-11.5BN.

Cheniere now plans to direct around 40% of Distributable Cash Flow (DCF) to shareholder returns, including a 20% dividend hike and an expected 10% growth rate in the future. European LNG demand has helped push margins higher. 2022 is turning out to be an exceptional year and the company is guiding for EBITDA in subsequent years around $7BN, although some analysts believe that is conservative. Their long term “take-or-pay” contracts provide almost 20 years of cash flow visibility. We are long-time investors in Cheniere

The news from Cheniere provided a pleasant distraction from the inflation numbers for energy investors. The core CPI number (ex-food and energy) was sharply higher than expected at 0.6%, well above July’s 0.3% figure. Inflation expectations have remained surprisingly constrained over the past couple of years. Ten year inflation expectations as derived from the treasury market are 2.4%. However, the Fed will worry that stubbornly high inflation will become embedded in consumer expectations. In our opinion savers should plan on a higher inflation rate when assessing their retirement outlook.

The resilience of midstream energy infrastructure compared with the S&P500 reflects the explicit inflation linkage many pipelines offer (usually via the Producer Price Index). We think it’s an excellent component of any equity portfolio.

The US exports around 11 Billion Cubic Feet per Day (BCF/D) of Liquefied Natural Gas (LNG). This will rise modestly over the next couple of years to around 13 BCF/D, but may increase sharply beyond that depending on which projects can sign enough long term contracts to reach a Final Investment Decision (FID).

There are few pureplay LNG export opportunities available beyond Cheniere. NextDecade (NEXT) and Tellurian (TELL) are both early-stage companies with plans to build facilities over the next few years. Of the two we prefer NEXT for its superior governance, but both companies will likely draw increased interest as investors consider other companies that may emulate Cheniere’s success.

The collapse in Russia’s exports of natural gas (methane) to western Europe highlight the expense involved in transportation. Methane moves by pipeline or LNG tanker. Russia invested billions of roubles in the infrastructure to support Nord Stream 1 and 2. These pipelines have no alternative use. Although China is an obvious alternate buyer, more billions of roubles will be required to build the necessary infrastructure. Moreover, as noted in an FT article, China will be a difficult customer. No country wants to be overly reliant on a neighbor for energy. Fixed infrastructure that straddles national borders, such as pipelines, will increasingly require the near-certainty of stable relations. The post-Ukraine world is one where energy supplies can be leveraged for political gain. Energy security makes imported seaborne natural gas in the form of LNG a more flexible alternative, even if it costs more. Consequently, global demand for LNG is likely to benefit from this type of geopolitical analysis. The US is well positioned to benefit.

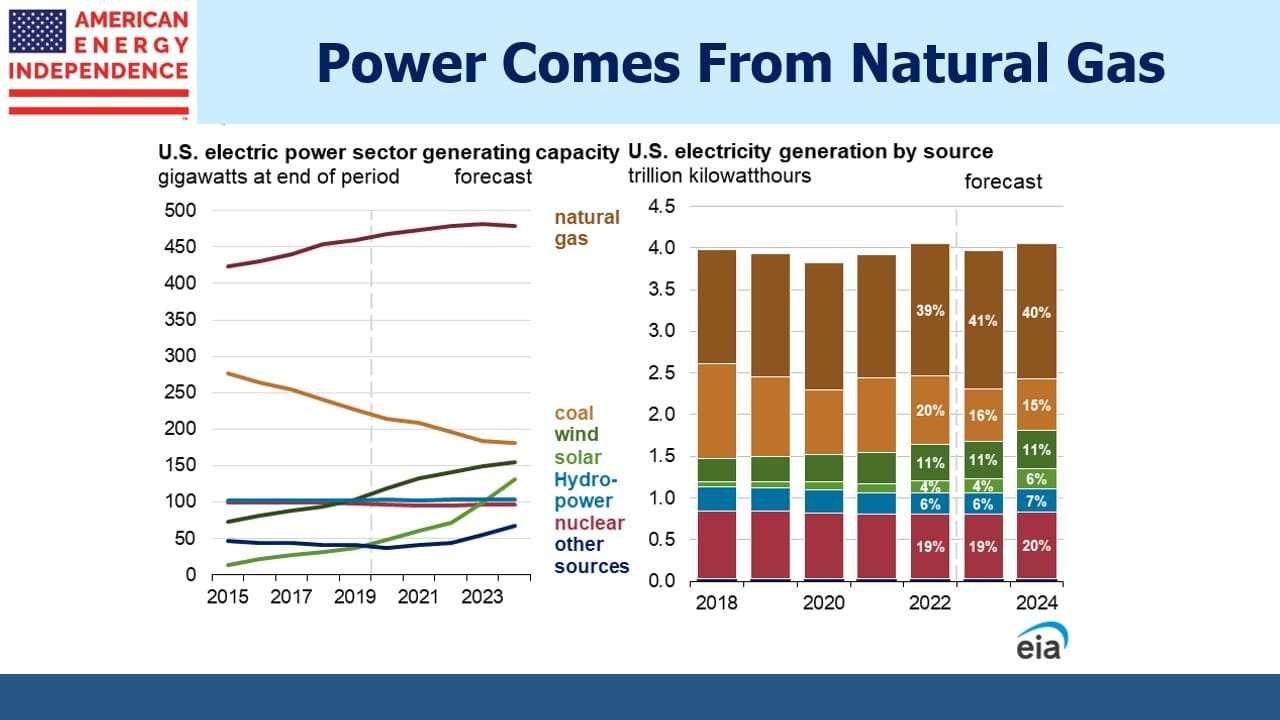
The US Energy Information Administration (EIA) recently announced that 24% of US electricity generation came from renewables during 1H22. It’s hard to share their enthusiasm for this milestone, since it comes with unreliability and higher prices (see California and Germany). The EIA noted that both hydro and wind, which are the majority of renewables, provide more output in the first half of the year than the second. In the case of hydro it’s because of melting snowpack. Wind evidently has its own seasonality as well. Over the past twelve months renewables are 16%, up 2% year-on-year.

Although it’s politically correct to celebrate increased use of renewables, the dominant story about US power generation for at least the past decade has been the switch away from coal. Since 2012 natural gas has gone from 28% to 38% of our electricity. Over the same period coal has dropped from 39% to 21%. Hydro and nuclear have each dropped slightly, by 1%, and renewables have increased by 10%.

It’s also interesting to see that electricity demand has barely grown over the past decade, reflecting improving energy efficiency across our economy.

The EIA has noted in the past that most of America’s drop in greenhouse gas emissions is the result of coal to gas switching. Natural gas remains the most interesting story in the energy markets.

We have three funds that seek to profit from this environment:

Energy Mutual Fund Energy ETF Real Assets Fund
Please see important Legal Disclosures.


image_pdfimage_print