Bullish News On Gas

SL Advisors Talks Markets
Bullish News On Gas
Loading
/

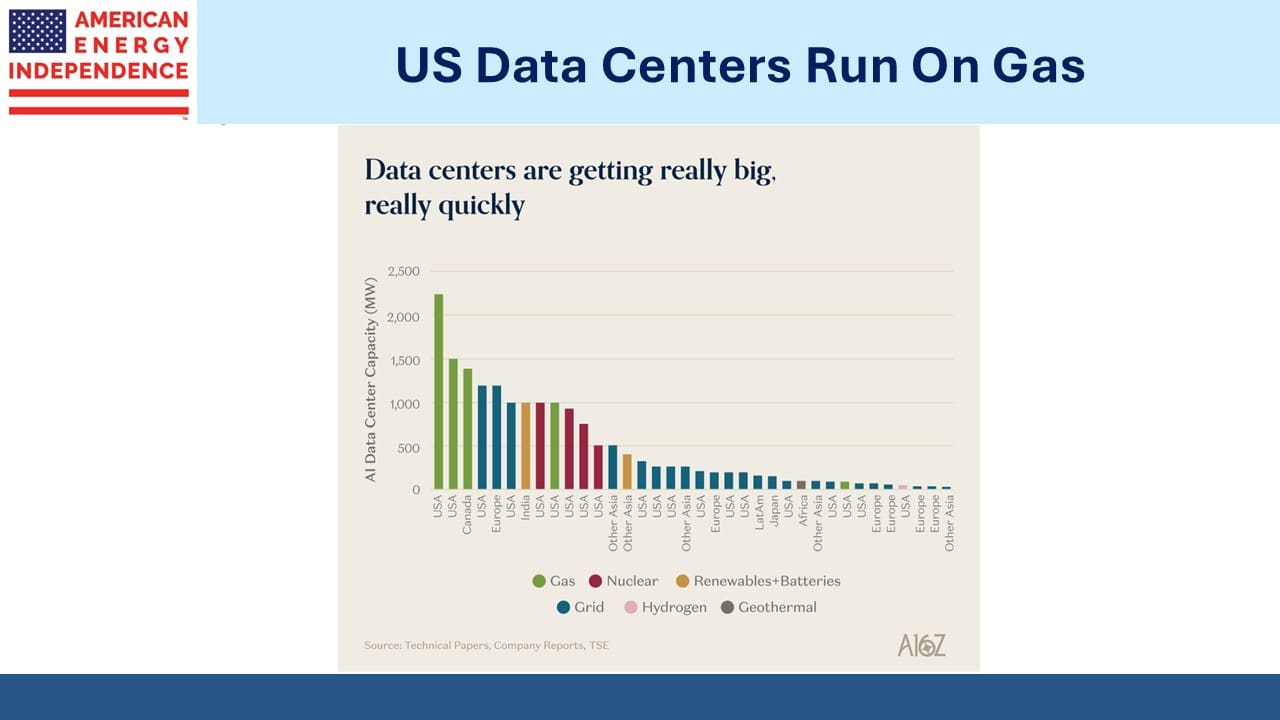
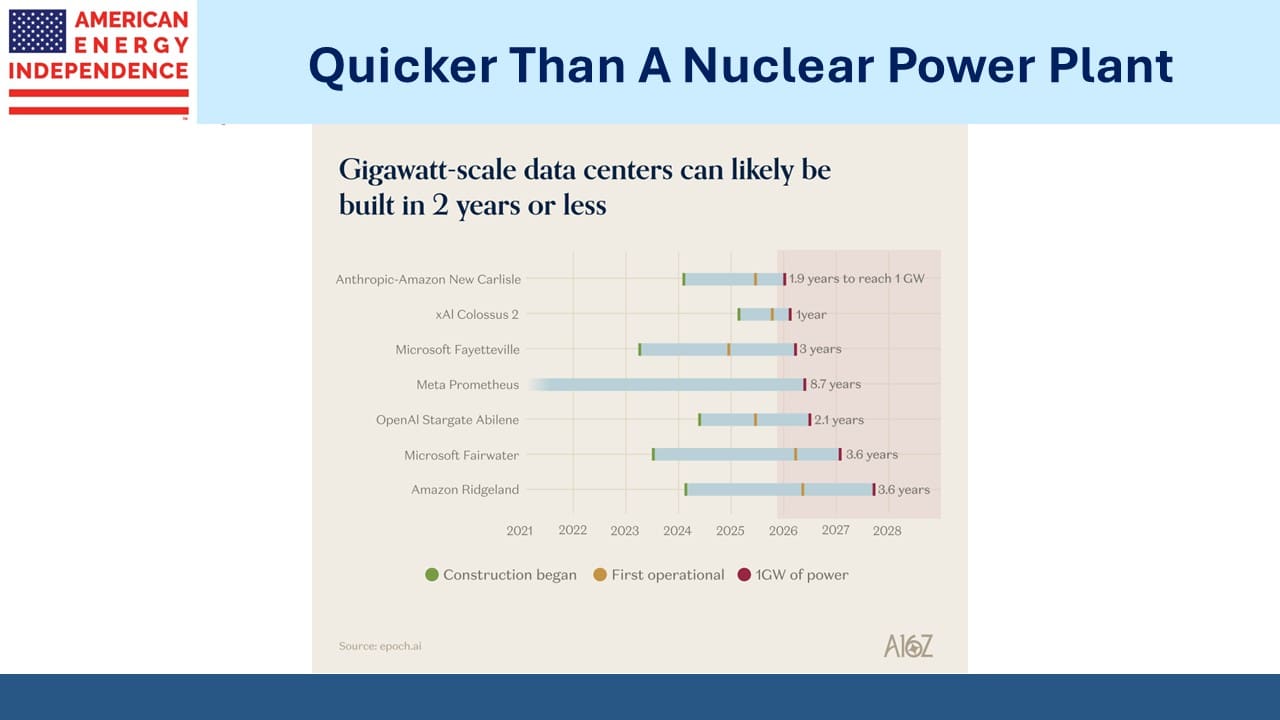
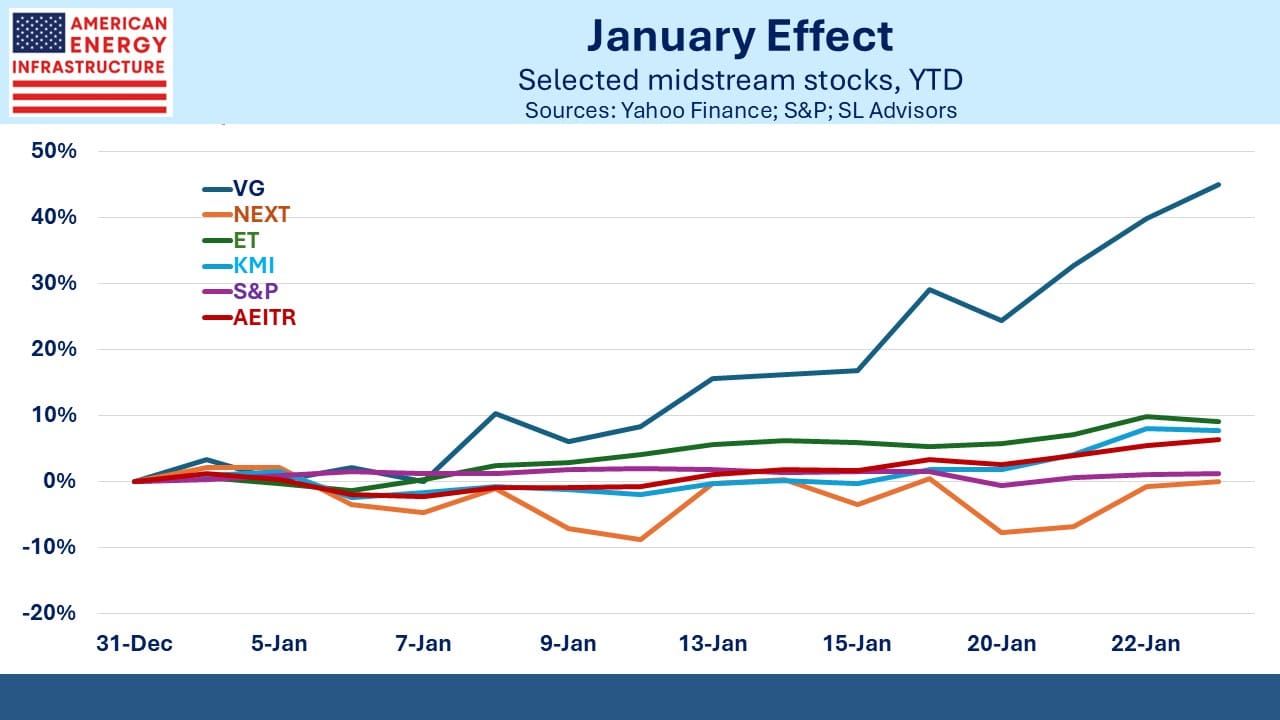
Last week there were two pieces of news that confirmed the bullish long term outlook for natural gas. On Thursday the WSJ reported on the Behind The Meter (BTM) arrangements that are becoming common (see AI Data Centers, Desperate for Electricity, Are Building Their Own Power Plants). This is faster than connecting with the grid and by allocating the costs directly to the data center avoids fueling the developing political debate about how hyperscalers are driving up household electricity prices.

There were some powerful statistics in the report: data centers are expected to represent 12% of US electricity consumption by 2028, up from only 2% in 2020. Texas expects peak load to be 62% higher by 2030. Natural gas will be the energy source of choice because it’s available, reliable and cheap.

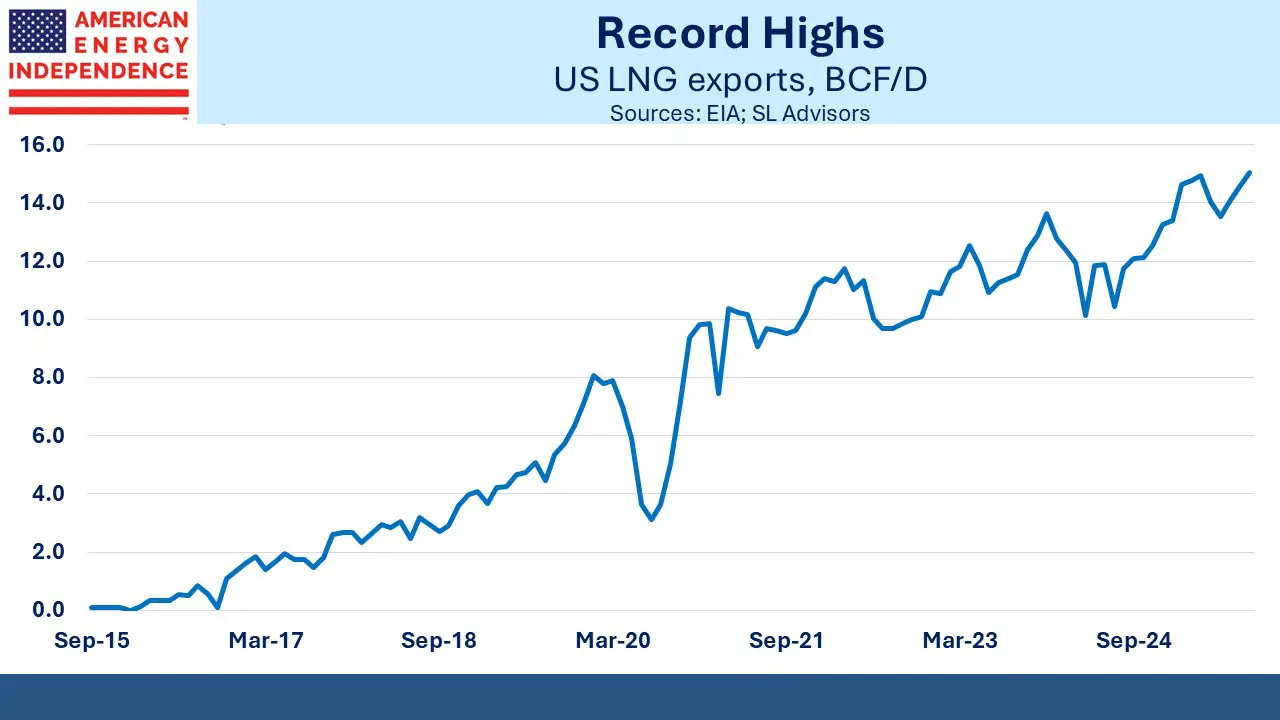
Also on Thursday the Energy Information Administration (EIA) updated their forecast for US Liquefied Natural Gas (LNG) export capacity, noting that it could double within four years.

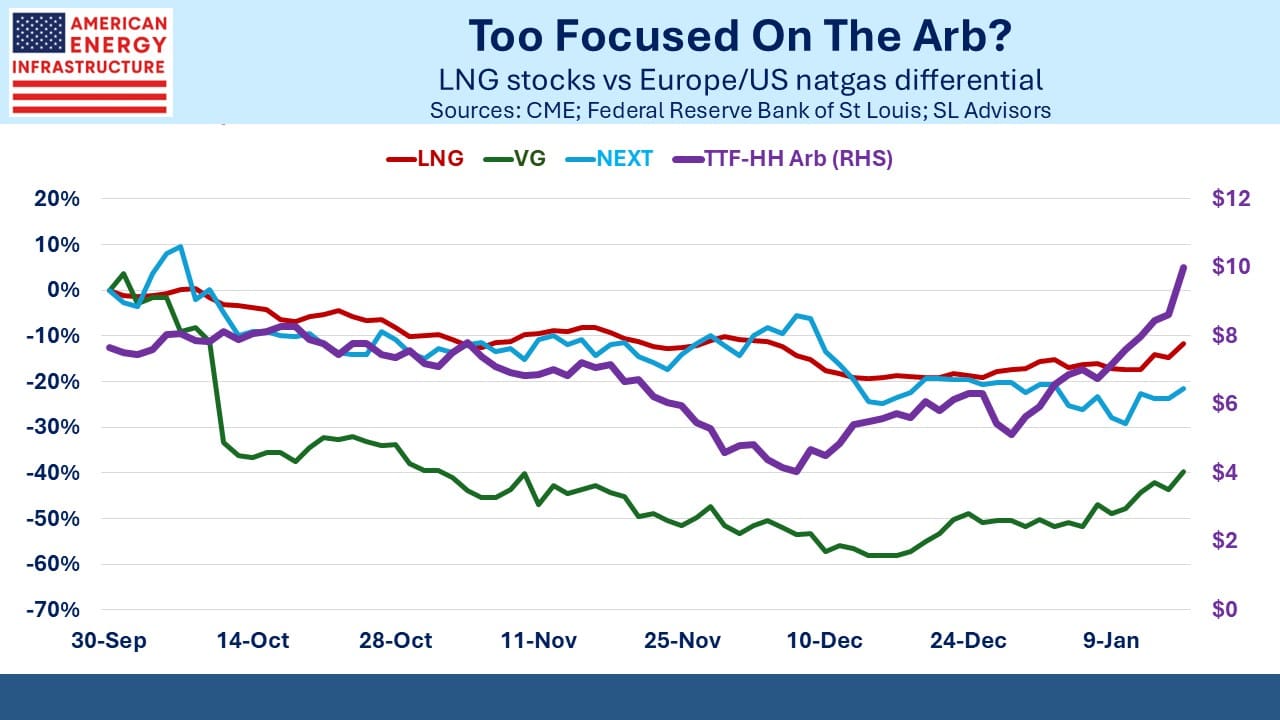
LNG names have been weak. Venture Global remains under a cloud following their loss in arbitration to BP (see Gassy Isn’t Happy). Witholding expected LNG shipments in 2022 to exploit high spot prices following Russia’s invasion of Ukraine netted a big windfall that’s now at risk to further adverse arbitration decisions (see Nothing Ventured, Nothing Gained). But in our judgment the market has more than priced in that worst case outcome.

NextDecade announced Final Investment Decision and the close of financing on Train 5 of their Rio Grande LNG terminal, notably without issuing any new equity. They expect to start shipping LNG by 2027 although Train 5 will be operational four years later. This will bring their export capacity to 30 Million Tonnes Per Annum (MTPA).

Market leader Cheniere has current capacity of 45 MTPA although this will likely increase by 30 MTPA within five years. Their market cap is $48BN. VG expects to reach 100 MTPA by 2030 and is worth $22BN. NEXT has a market cap of $1.6BN.

Nonetheless, five plus years is a long time to wait for full cashflows from NEXT and the stock, most of which isn’t publicly traded, will likely be subject to periodic swoons in the meantime as has happened twice this year. But we think ultimately the return will be attractive.

I’ve been traveling through the southeast US this week visiting clients, from DC via Richmond, and on to Fort Mill, Columbia and Charleston all in South Carolina. Sector performance has been disappointing, but I’ve enjoyed many interesting conversations with long-time investors, and I can report that this group is comfortable with their midstream investments with some considering adding.

We’ve also been doing a lot of calls with clients, answering questions they may have, and reinforcing that we believe current prices represent an interesting opportunity. One investor told me we communicate more than any other investment manager he knows, which was a nice thing to hear. If you’d like to learn more, feel free to reach out.

We also held a webinar on Thursday – if you missed it, here’s a link to the recording.

I once again joined U-Vest’s Financial’s annual conference, held this year in LPL’s offices in Fort Mill, SC. U-Vest are long-time investors with us and it’s been wonderful to watch their growth over the years as they add new advisors and offices across Florida, Texas, Georgia and South Carolina. Mike Davino, Dustin Johnson and Nick Brinson are building a terrific business.

Progressives have always argued that power generation should rapidly shift to renewables. But solar and wind struggle with intermittency, land use, and grid integration. The current Administration’s hostility to both has added to these challenges, on top of which costs have been rising. Political risk around the quadrennial presidential cycle will temper enthusiasm for renewables for many years to come.

Consequently, we often get questions on nuclear power and whether that can meet some of the new demand for electricity from data centers, reducing the demand for natural gas. We’d invest in nuclear power if it offered visible recurring cashflows comparable to hydrocarbon infrastructure. Today it doesn’t, and the costly delays on the Vogtle plant in Tennessee, which was finally completed last year, are enough to dissuade any full-scale projects for now.

There’s lots of R&D into small modular reactors, but the timeline for these initiatives doesn’t match the urgency of hyperscalers in the AI race. However, supportive executive orders and legislation in areas such as tax credits and streamlined permitting are improving the odds that nuclear power will eventually play a larger role.

The US Army announced last week it is planning to add small nuclear power generation reactors on its bases around the world. The US Navy has for decades operated nuclear-powered aircraft carriers and submarines. But this isn’t a model for the civilian sector because they use weapons-grade plutonium, which no country uses for civilian purposes because of the risk of terrorists. The Army will rely on non-weapons-grade uranium, and it’ll be encouraging if this plan offers lessons that eventually benefit civilian use.

The prospects for reliable US energy look good.

We have two have funds that seek to profit from this environment:

Energy Mutual Fund Energy ETF


Gassy Isn’t Happy

SL Advisors Talks Markets
Gassy Isn’t Happy
Loading
/

The last few weeks have been challenging for the bullish story on natural gas. On Thursday evening Venture Global (VG) disclosed that they’d lost an arbitration case with BP over their Calcasieu Pass LNG terminal. The International Chamber of Commerce (ICC) found that VG had breached its obligation to make a timely declaration of the start of commercial operations.

BP and other buyers had signed Sale and Purchase Agreements (SPAs) that would start delivering LNG once VG decided the terminal was “operational.” When Russia invaded Ukraine in February 2022, global LNG prices soared as Europe struggled to replace lost pipeline imports of natural gas from Russia.

VG interpreted their agreements as giving them enough latitude to delay fulfilling LNG shipments under their SPAs, which allowed them to sell the LNG the terminal was already producing into the high-priced spot market (see Nothing Ventured, Nothing Gained).

Shell, BP and other expectant recipients of LNG cried foul and took VG to arbitration, claiming that VG’s windfall gains of $3.5BN were rightly theirs. VG plowed the cash back into their business, building the Plaquemines terminal, reducing their reliance on debt markets.

In August, VG won a similar arbitration dispute with Shell, also before the ICC. It’s unclear how the same facts and circumstances were interpreted differently by the same tribunal. It seems arbitration can be arbitrary. Following the August victory, VG not unreasonably said they expected similar outcomes in other cases. In an SEC filing submitted just before the Shell ruling, VG warned of $6.7-7.4BN in exposure if all the arbitration cases were lost.

On Friday, investors reacted to the news by wiping over $7.5BN from VG’s market cap. Assuming the market was 100% sure of positive arbitration outcomes prior, this exceeds the worst case they warned of in August since the Shell ruling was found in their favor. Wells Fargo estimates the worst case including damages of $5.5BN. JPMorgan thinks $4.8BN.

VG is on track to generate over $6.4BN in EBITDA this year, growing by perhaps $300MM next year. If arbitration awards reduce EBITDA by $1BN annually over the next five years, the company is at around 11.8X Enterprise Value/EBITDA. Cheniere is at 12.4X. The ruling was a big surprise and disappointment, but it leaves the stock fully priced for the worst case.

We avoided buying at the January IPO and even after Friday’s collapse, the stock is only modestly below our entry point. Since its IPO VG is –60%.

I’m going to be traveling to see clients over the next two weeks. A year ago, at one client’s annual conference, I received applause before even beginning my presentation. Four years of sparkling returns were warmly received, but this year has been tough. This time around I anticipate a friendly but less exuberant welcome.

NextDecade (NEXT), whose Rio Grande LNG terminal should start shipping LNG in 2027, recently lost their CFO, an event that algorithms duly interpreted as a reason to sell. It’s been a volatile stock, losing almost half its value following Liberation Day in April. It recovered in the summer, then swooned again when it announced Final Investment Decision on Train 4 with a modestly lower projected EBITDA.

NEXT doesn’t generate any cash today, but $800MM of Distributable Cash Flow (DCF) in 2030 discounted to today at 15% pa is worth about $400MM, which is a multiple of around 4X on today’s $1.7BN market cap. It looks cheap.

YTD it is -16%.

Energy Transfer (ET) has disappointed the many financial advisors we know that own it directly. Its 7.8% distribution yield is almost 2X covered by DCF. YTD it is –12%. It looks attractive to us.

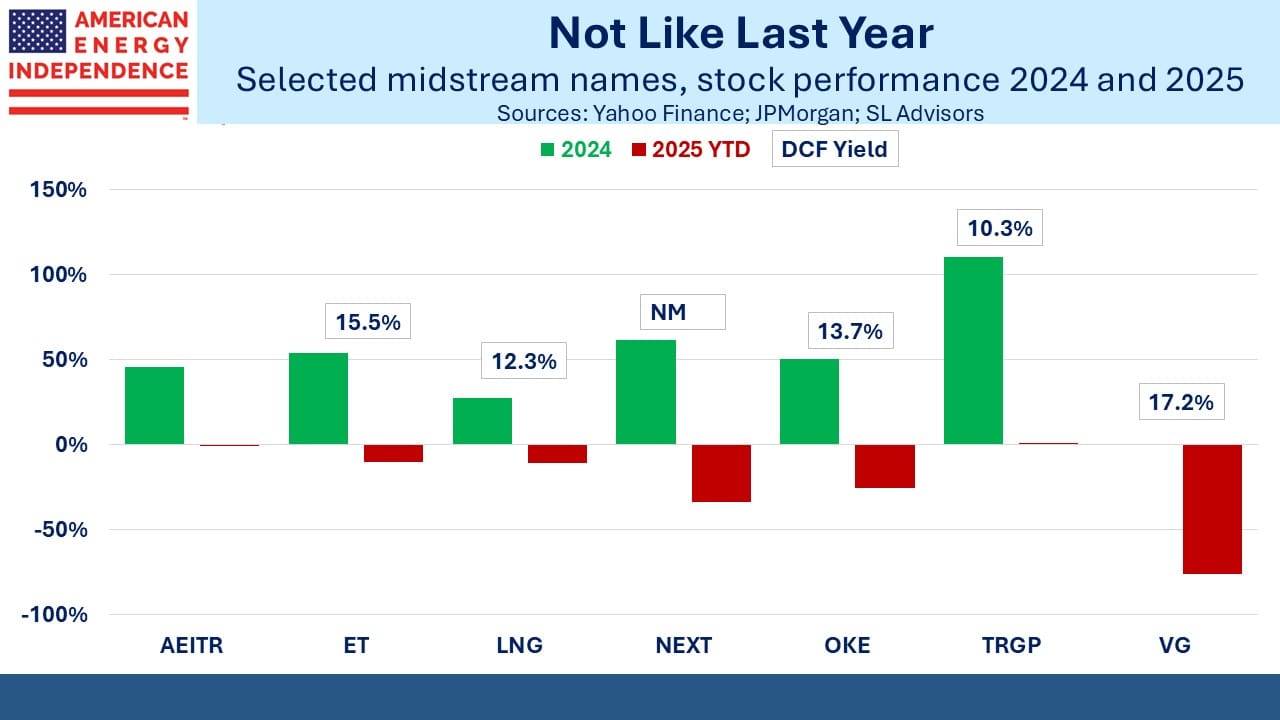
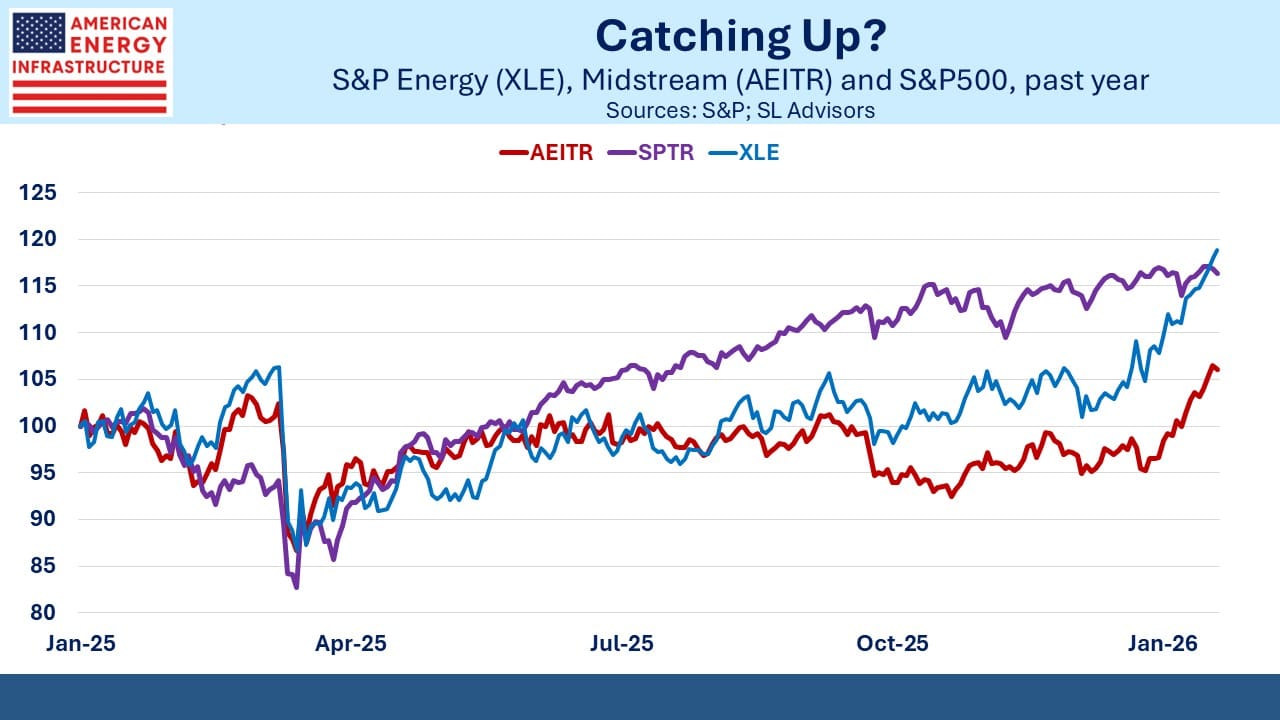
Midstream as defined by the American Energy Independence Index (AEITR) is –1% YTD. Natural gas exposed names have lagged. Gas demand for data centers was last year’s story. Concerns about excess LNG capacity have weighed on exporters this year. The AI-laden S&P500 is +13%.

Over the past twelve months relative performance is better than YTD, but the calendar year is typically how investors assess outcomes.

The possible resumption of a trade war with China dominated Friday’s news. Even Trump’s biggest critics have praised the peace agreement between Israel and Hamas. It looks as if we’re moving from that victory to more capricious “slapping” of tariffs.

The AI bubble is so commonly referenced that it’s hard to believe anyone is unaware of the circular deals identified by Morgan Stanley. As former Citigroup CEO Chuck Prince memorably said in 2007 shortly before the Great Financial Crisis, “As long as the music’s playing, you’ve got to get up and dance.” You’ll probably see that quote remembered elsewhere before too long.

If either or both of these stories cause a further unraveling, midstream infrastructure will still be generating growing cashflows, untarnished by the froth of this year’s market.

We have two have funds that seek to profit from this environment:

Energy Mutual Fund Energy ETF
 

BP Navigates Politics With Its Outlook

SL Advisors Talks Markets
BP Navigates Politics With Its Outlook
Loading
/

BP recently published their 2025 Energy Outlook. When big oil producers make projections about consumption it becomes a political document. Climate extremists are quick to accuse companies of opposing the energy transition and consigning the world to ruinous warming.

Yet capital commitments need to be based on rational expectations, not aspirational ones. Earlier this year BP slashed planned investments in renewables by $5BN because of poor returns. Its stock price has languished, leaving it vulnerable to a takeover from one of its less renewables-focused peers.

Unsurprisingly, BP protects itself from political fallout by saying in the opening paragraph that they’re not making predictions or stating what BP would like to have happen. The Current Trajectory scenario is where we’re likely going.

The Below 2 Degrees scenario plots what’s needed to reduce emissions enough to limit global warming by that amount (Celsius) by 2050. Most observers have given up on the original 1.5 degrees target. The main use of the Below 2 Degrees scenario is to show that reducing global energy consumption enough to reach it renders even this goal impractical as well.

Current Trajectory offers the more interesting slides. Forecasts of peaking oil consumption are built on increasing EV penetration. But the petrochemical industry is the biggest area of growth for oil, for production of plastics as living standards improve across developing economies.

Benjamin Braddock, the recent college graduate played by Dustin Hoffman nervously resisting Anne Bancroft’s attempts to seduce him in the 1967 movie The Graduate was told to dedicate his career to plastics. It’s not a new story.

One of the many implausible outcomes in the Below 2 Degrees scenario shows petrochemical feedstocks roughly flat out to 2050. Rising living standards across non-OECD countries will drive growth for decades. A peak in the global population will probably be required to trim energy consumption including petrochemical feedstocks.

An interesting recent article in The Economist (see Humanity will shrink, far sooner than you think) examined declining birthrates as living standards rise and suggested peak population could occur within a couple of generations by around 2060. That could finally spur a drop in energy consumption, helping drive emissions lower.

The EV chart assumes a sharp increase in EV penetration throughout the world. China may follow that path, but I’m skeptical that the US will see a tripling of EV usage within five years. 1H25 EV sales in the US were 607K, +1.5% year-on-year. The third quarter saw a big jump but with the Federal tax credit of up to $7,500 now ended we’ll see how much that ate into 4Q sales. GM recently cut EV production, citing weak demand.

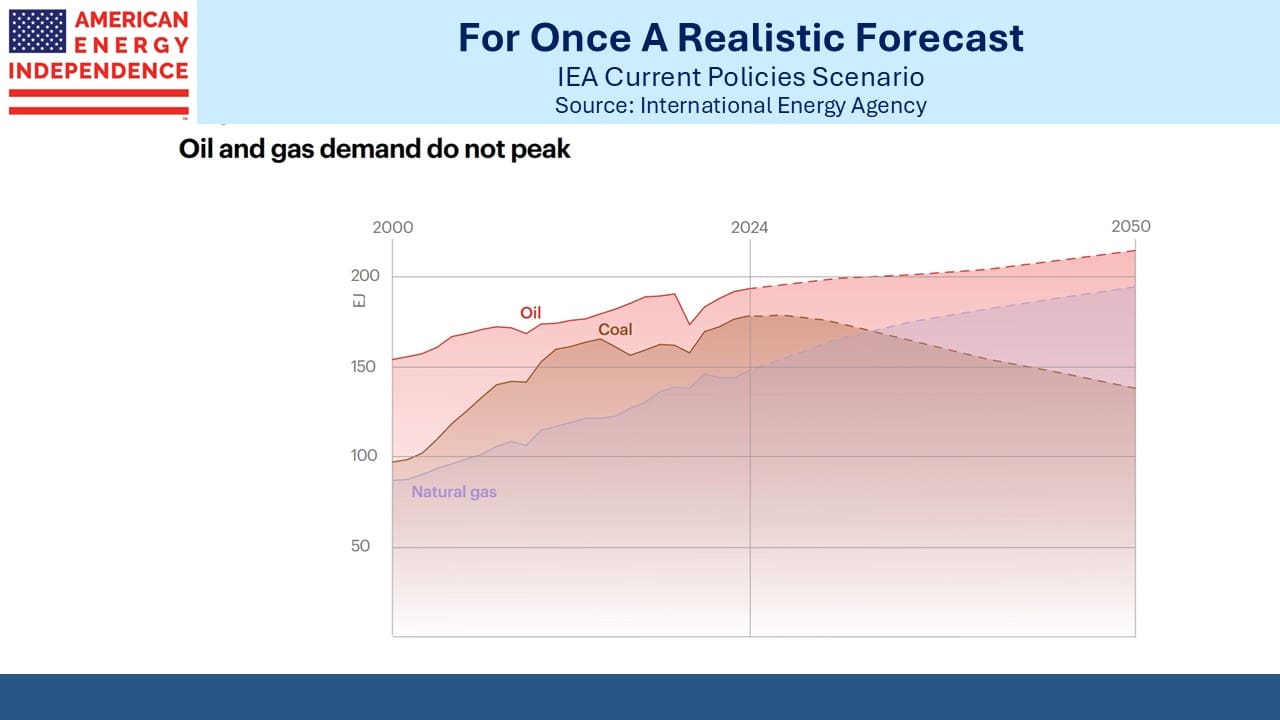
BP expects natural gas demand to keep increasing for the next couple of decades. LNG demand will soar in emerging Asia as regional production falls. As regular readers know, we are optimistic about the long term outlook for US gas exports.

Power demand from data centers is the other growth driver for natural gas. One impediment might be the availability of gas turbines, since demand is outpacing available production capacity.

Energy Transfer (ET) is the most owned individual pipeline stock among the investors we talk to. The MLP discount keeps it perennially cheap, but that’s no reason to avoid it. Like Williams Companies (WMB), it is well positioned to provide natural gas to data centers, especially through Behind The Meter (BTM) arrangements.

BTM takes gas directly to a power plant that’s dedicated to the data center. Avoiding the highly regulated grid speeds implementation. Both companies have reported dozens of such discussions are under way.

ET’s weak performance this year surprises us. Their 7.6% dividend yield is more than 2X WMB’s 3.1%. ET’s Distributable Cash Flow (DCF) yield is a whopping 14.5% vs WMB’s 6.4%. And yet YTD WMB is beating ET by 31%.

Moreover, ET’s exposure to Permian gas in west Texas is probably better than WMB’s in Appalachia, because adding takeaway pipeline capacity within the energy-friendly Lone Star state is a lot easier than building in blue states like Virginia to reach the world’s data center capital, for now anyway. The interminable delays and huge additional cost in building Mountain Valley Pipeline from West Virginia to Virginia will dampen enthusiasm for new pipelines in that region for years to come.

For ET to be down on the year shows investor preference for bubble stocks. Cash flow and valuation will return to fashion at some point. We like both ET and WMB but have roughly double the exposure to ET that we have to WMB reflecting the former’s superior prospects and valuation.

We have two have funds that seek to profit from this environment:

Energy Mutual Fund Energy ETF
 

Getting Cheaper By Moving Sideways

SL Advisors Talks Markets
Getting Cheaper By Moving Sideways
Loading
/

The energy sector is leaving investors unimpressed. YTD the American Energy Independence Index (AEITR) is +5% and seems to be marking time. The S&P500, increasingly dominated by tech and AI exposure, is +13%. Long-time clients, having enjoyed several strong years, hope the better days will soon return. More recent investors demand to know what’s gone wrong.

Time period matters. Roll the start date back three months, and the trailing one-year return for the S&P500 is +17% and the midstream sector is +19%. 4Q24 makes a big difference.

The perennially underperforming Alerian MLP ETF (AMLP) is only +8%.

Operating performance is beating sentiment. 2Q earnings contained few surprises and mostly confirmed the positive trend for cash flow growth. More recently, Hess Midstream revised their guidance lower but the outlook for crude, where Hess operates, is weaker than for gas. Upstream capex is declining because of soft oil prices (see The Energetic Outlook For Energy) while midstream capex is increasing to meet growing gas demand for data centers and LNG exports.

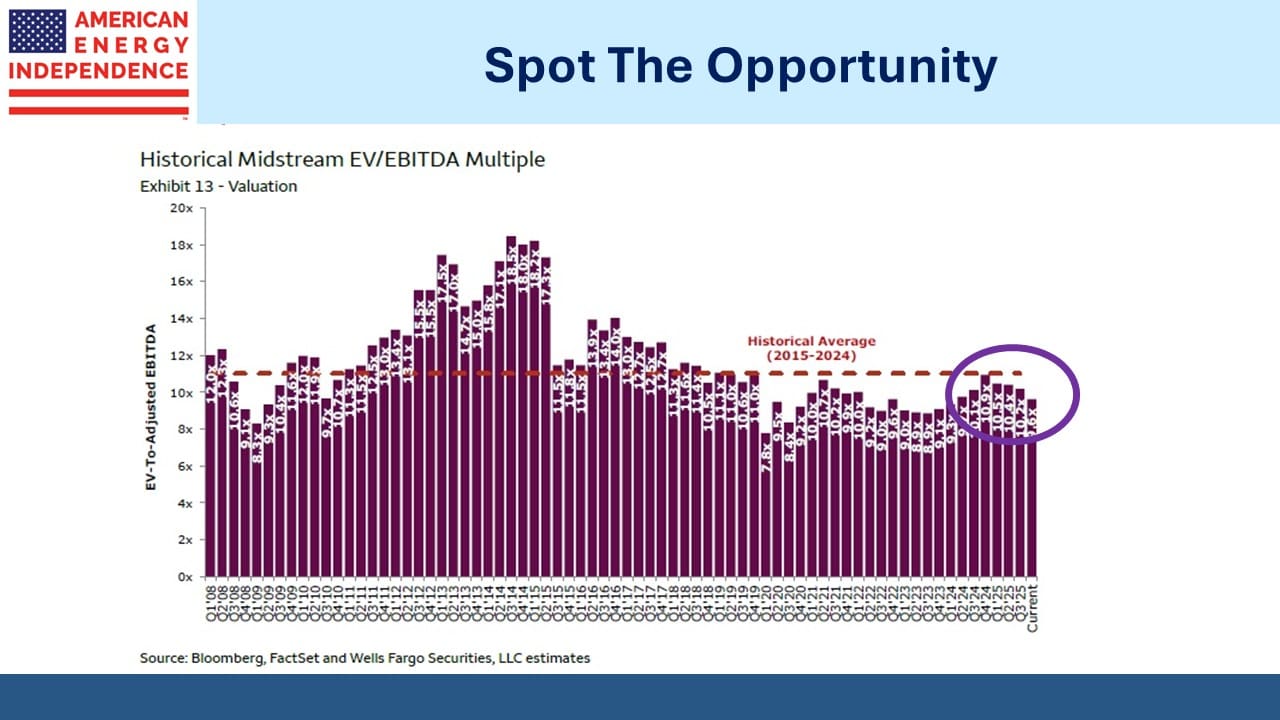
The contrast between moribund price performance and dynamic operating results is demonstrated by the Wells Fargo EV/EBITDA chart. The midstream sector has become cheaper, having pulled back almost halfway to the lows of late 2023, from which it delivered last year’s +45% total return. The problem, if a trailing one-year return of 19% deserves that characterization, is more with overly cautious investors than with how the companies are doing.

Modest price performance with growing EBITDA has left the sector more attractive than it’s been all year.

Leverage continues to drift lower with a median Debt:EBITDA of 3.5X according to JPMorgan, who also sees dividends growing at 5-7% next year. Distributable Cash Flow coverage ratios for the large cap names listed are at a median of 1.9X. We’ve omitted the LNG exporters Cheniere and Venture Global because they pay small dividends so would distort this metric higher.

The demand picture for natural gas remains robust, with hundreds of $BNs being invested in data centers that will need reliable electricity and LNG exports growing strongly. Below average sea temperatures in the Pacific near Peru meet the criterion for La Nina, meaning the odds of a warmer than average US winter are low. Natural gas prices rose accordingly on this news.

Although we’re rarely accused of insufficient enthusiasm towards pipelines, it does seem that for those underweight the sector, which would be most investors, current valuations offer an opportunity to rectify.

My wife and I were in Italy recently. When we travel, I’m always interested to learn more about how other countries use energy. Americans use more energy per capita than any other developed country except Canada, where the winters are long and cold.

The typical Italian uses only 37% as much energy as an American. There are many factors for this – Europeans rely less on air conditioning than we do in North America. They like to open the windows, since summer heat rarely matches the US.

The cars are smaller, with two-seater and even one-seater models that would fit in the back of a Ford F150. Hotels often require you to put your key in a slot to activate the room’s power, ensuring no wasted electricity when guests are out.

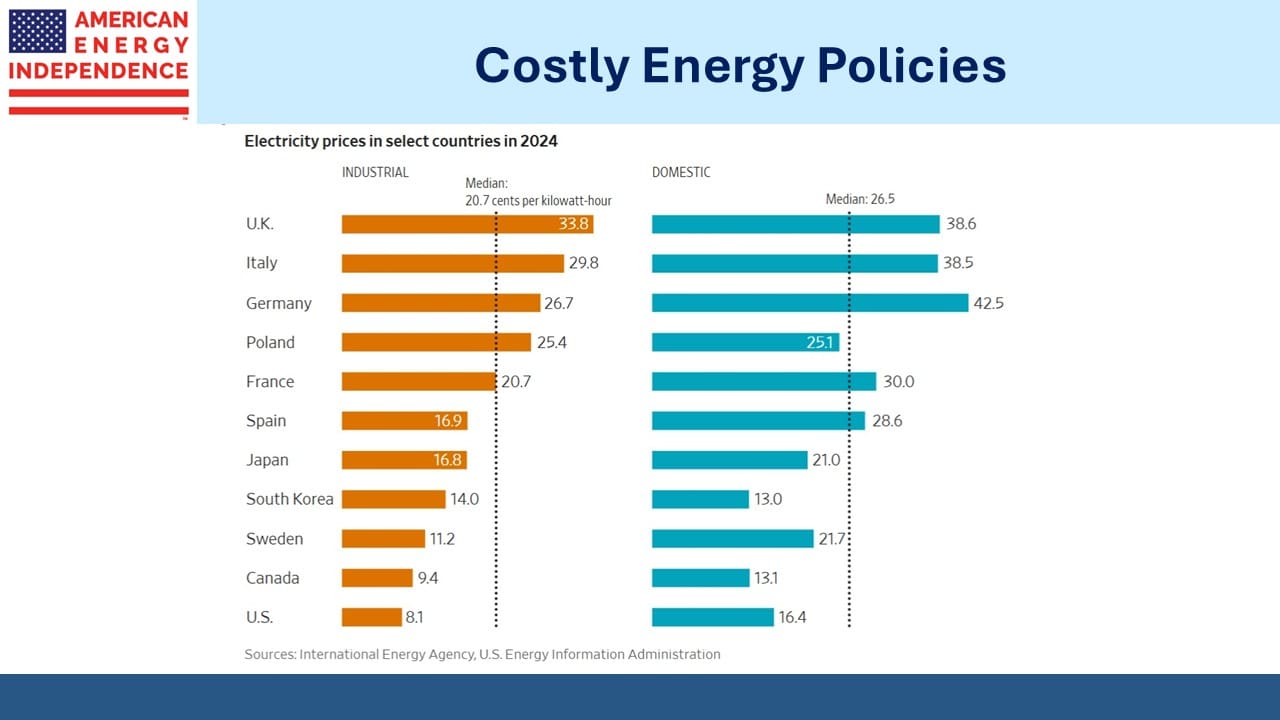
The EU is a leader in adopting policies to reduce greenhouse gases, which has led to some of the world’s highest electricity prices and a slow de-industrialization of the region. Living standards and energy consumption are symbiotically linked. Italian GDP per capita is only 71% of the US, down from 95% twenty-five years ago. Per capita energy consumption has declined 0.8% annually over the past decade, faster than the US at 0.5%.

The setting for Frances Mayes’ Under the Tuscan Sun is populated by many who care little for such analysis. It’s true that sharing a bottle of Chianti in a picturesque village overlooking rolling vineyards can generate thoughts beyond GDP. But to live like an American in Italy you need to have made your money elsewhere.

The inescapable conclusion is that relative living standards in much of Europe are sliding along with energy use. One can debate cause versus effect, but not the outcome. One of the saddest charts I ever look at is the ratio of UK to US GDP per capita, which has dropped quite sharply in the past decade. Brexit, no productivity growth and widespread use of expensive windpower have all contributed. But it does pain me to see my old country making bad choices while also confirming my 1982 decision to emigrate.

Trump’s jibe at the UN that European countries were “going to hell” in part because of energy policies was hyperbolic as usual but directionally correct. He’s wrong in denying the risks in elevated atmospheric CO2, but right in criticizing the belief that the world will run on renewables. It won’t. Fortunately, in America, we know that.

We have two have funds that seek to profit from this environment:

Energy Mutual Fund Energy ETF
 

Get Your Foreign Exposure In America

SL Advisors Talks Markets
Get Your Foreign Exposure In America
Loading
/

Investors are routinely advised to incorporate some international exposure into their portfolios. This can be to add diversification or, in the case of emerging markets, to participate in faster-growing economies. For a US-based investor, this is at best a waste of time. Worse, it can introduce unneeded complexity, cost and poor returns.

By investing in countries that are developing quickly, the hope is that faster growth in GDP and incomes will translate into higher equity returns. This approach has provided years of disappointing results. It’s been good for investment managers who charge high fees to provide specialized access to such markets, but not for their clients.

The first mistake is to confuse GDP growth with equity returns. Take those famous empty, unfinished apartment buildings across China. Their construction generated economic activity and boosted GDP, but they’re not generating returns for the capital that financed them. Capex that fails to generate a return above its cost destroys equity value and isn’t limited to profit-seeking enterprises. Governments are equally capable of poor investment choices.

In fact, for many countries the transmission mechanism linking GDP growth and equity market returns is weak. There is ample literature on this point, such as Triumph of the Optimists (2001) which examined a century’s worth of data. The analysis was updated in 2021 with similar conclusions. An academic paper from 2022 (What Matters More for Emerging Markets Investors: Economic Growth or EPS Growth?) provided confirmation.

Moreover, direct investing in foreign markets incurs risk to foreign concepts of property rights, disclosure, accounting standards and fair markets. Many countries aspire to American standards, but few achieve them. I remember visiting India years ago to meet with local hedge fund managers and being told by a regulator that there was no insider trading in their markets. In such cases the only plausible approach is to invest with inside information or not at all. We never invested in Inda.

Then there’s the quandary of which foreign markets to choose and what allocation to make. Done properly, this requires substantial research of relative valuations, investor protections and economic prospects. This level of analysis is way beyond all but the most sophisticated institutional investors.

The S&P500 contains most of the world’s biggest companies. Almost all of them do business overseas. Investors are often surprised at the portion of revenues these 500 companies generate outside the US, which Factset calculates at 41%. It’s not just the Technology sector either – all eleven sectors have some exposure outside the US, although not surprisingly it’s low for Utilities and Real Estate. But the figures should provide comfort to any S&P500 investor who fears his holdings are too parochial.

What’s the right allocation? 500 boards of directors and executive teams have considered the opportunities from Argentina to Morocco to Vietnam and have invested accordingly. Their blended exposure to different countries represents the aggregate best thinking of this group. It’s crowdsourcing – the result of so many independent opinions is likely to be better than the informed view of an individual investor.

In addition, these companies have navigated through local regulations, taxes, property rights, accounting standards and politics in making those choices. Put another way, if the American Widget Company listed on the NYSE decides to create a subsidiary in Brazil, you’re better off getting your exposure through them than trying to identify a Brazilian widget company listed in Sao Paulo.

Instead of trying to identify Indian companies that will give you exposure to that country’s growing middle class, why not let Apple do it for you.

The Wall Street Journal recently advised its readers to allocate around a third of their portfolios internationally. Ironically this is less foreign exposure than the S&P500 currently provides. An investor who followed this advice would wind up with more than half their exposure outside the US, an imprudent choice for someone living in America.

The WSJ article ignored the abovementioned research and instead noted that, “Overseas equities are beating domestic shares for one of the few times in 15 years…” Most of the market advice from the media is on trading. Investors don’t hop into a sector on the basis of a few good months. So much energy is spent on timing rather than strategy.

The S&P500 offers ample diversification and a more efficient, safer way to access investment opportunities beyond our borders. Shun the advice of the poorly informed adviser who wants to make your portfolio more complicated and therefore renders his advice harder to evaluate.

Simpler can be better.

We have two have funds that seek to profit from this environment:

Energy Mutual Fund Energy ETF


Thoughts On NextDecade

SL Advisors Talks Markets
Thoughts On NextDecade
Loading
/

I’m traveling in Italy and am not so distracted by the cultural and culinary delights to have overlooked the news on NextDecade (NEXT). I’ve watched the subsequent stock price fall with disappointment. They lowered EBITDA guidance on Trains 1-5 from $1.1BN (midpoint of prior $0.9-1.3BN) to $1BN, starting in 2030. Distributable Cash Flow (DCF) is estimated at $0.8BN according to Morgan Stanley, whose $15 price target is now $10.

The stock fell from $10.69 to $6.84 last week and is down 43% from its July 18 high of $12, ironically reached on the back of Morgan Stanley’s earlier upgrade. NEXT is a volatile stock, with no prospect of generating any cashflow for five years. It dropped 40% from its previous high of $9.43 in the Spring following Liberation Day and subsequently recovered.

This is not an investment for leveraged investors or for those seeking short term profits.

But $800MM of DCF in 2030 discounted to today at 15% pa is worth about $400MM, which is a multiple of around 4.5X on today’s $1.8BN market cap. This excludes any potential cashflow from further expansion of their Rio Grande LNG terminal, which we think is likely over the next couple of years, where their economics ought to be better than on Trains 1-5.

There’s a lot of optionality here.

NEXT is a cheaply priced investment with adequate compensation for the execution risk. It’ll remain a volatile stock and with a history of losing nearly half its market value at least once a year is not a holding for those who rely on skill at market timing.

We don’t count ourselves in that group and see attractive upside from here.

We have two have funds that seek to profit from this environment:

Energy Mutual Fund Energy ETF
 

Adapting To America’s Low Rate Policy

SL Advisors Talks Markets
Adapting To America’s Low Rate Policy
Loading
/

President Trump continues to heap pressure on the FOMC to cut rates, to the alarm of every economist and bond analyst. Central bank independence is the gold standard for western nations, the only way to assure that politicians don’t seek to juice growth synchronized with the election cycle.

Fed chair William McChesney Martin Jr, who served in that position longer than anyone (1951-1970), was credited with describing the Fed as, “…independent within the government, not independent of the government.”

Central bank independence really means immunity from short term political pressure. Few argue that cental banks shouldn’t be politically accountable. The Fed’s twin mandate of maximum employment with stable prices is set by Congress and could be changed by Congress.

Trump isn’t the first president to call for lower rates, but as with most issues that get him exercised he is a relentless opponent willing to break norms to achieve his goals. The market is beginning to price in a Trump-managed rate cycle. It seems likely to me that his steady pressure on the Fed will tend to force short term rates lower for the rest of his term, as he finds more ways to change some FOMC members and intimidate the rest.

We are heading into a period of increased inflation tolerance. Whether or not actual inflation moves sustainably higher, few would confuse Trump with a hard-money man. If you’re excessively worried about preserving your purchasing power, arrange your investments appropriately into sectors that will respond well to rising prices – such as midstream energy infrastructure. Don’t rely on the president to help.

I increasingly run into people who differentiate between Trump’s policies and their implementation. Tariffs have turned out to be a national sales tax on imports. The Congressional Budget Office estimates they’ll generate $4TN over the next decade. Everyone who wrings their hands over our fiscal outlook and criticized the deficit increase in the One Big Beautiful Bill should welcome this new source of revenue to the Treasury.

Taxes aren’t inflationary. The prices of affected goods undergo a one-time increase. Tighter monetary policy in response would be exacerbating the headwind to consumption. Most states have a sales tax, and you’ve never heard that a monetary policy response was required.

Tariffs may not be that bad. But their implementation has been tactical and capricious.

The conventional wisdom supporting central bank independence is that it promotes low and stable inflation. There’s nothing magic about 2%. The FOMC disclosed their 2% inflation target in 2012 but for years previously had gravitated towards that level without formally adopting it. Many economists have argued that stable inflation is more important than the actual level, since it aids long term capital planning. Stability is more easily achieved around a lower number. Barry Knapp of Ironsides Economics argues that capex has historically been strongest during periods of low inflation volatility, such as from the 1960s-90s.

Our dire fiscal outlook is beginning to intrude. When the Fed raised interest rates in 2022 to combat the inflation caused by the Biden Administration’s fiscally profligate pandemic response, it drove up the cost of financing our Federal debt. With $37TN outstanding, we can no longer be oblivious to interest expense, which will exceed $1TN this year.

Trump has repeatedly accused Fed chair Jay Powell of costing us “hundreds of billions of dollars” by not cutting interest rates. As with much of Trump’s policymaking, his approach is combative and violates conventional norms. But it is reasonable to consider the Fed’s appropriate mandate given our fiscal outlook, the improvement of which both parties have concluded offers no political upside.

Federal debt has an average maturity of around six years and an average rate of 3.3%. If the Fed slashed short term rates to 1% immediately, it would take several years to meaningfully impact our interest expense. But eventually it would. If we targeted stable inflation of 3% and funded ourselves at 2%, a –1% real (i.e. inflation-adjusted) cost of financing would, over time, lower the real value of what we owe.

Mild currency debasement is a time-honored way for governments to repay less than they borrowed when adjusted for purchasing power, as I wrote in Bonds Are Not Forever; The Crisis Facing Fixed Income Investors.

The right way to do this is for Congress to debate the Fed’s dual mandate, to hold hearings and consider whether it should be changed. The world being what it is, the Administration is pursuing a different approach.

It’s easy to criticize the threat to the Fed’s independence. It’s also likely that for the balance of his term Trump will get his way. Because he’s willing to take some risk with inflation, investors should position accordingly. Unsurprisingly, we believe midstream energy infrastructure, with its inflation-linked business model, can be part of the solution.

We have two have funds that seek to profit from this environment:

Energy Mutual Fund Energy ETF


Why Lower Oil Prices Will Boost Natural Gas

SL Advisors Talks Markets
Why Lower Oil Prices Will Boost Natural Gas
Loading
/

Many years ago, when we were researching silver mining companies, I was fascinated to learn how insensitive production and consumption were to prices. Unlike gold, which is mostly held as an investment, silver has many industrial uses. Consumer electronics represents over a third of demand. Silver has few good substitutes and is a comparatively small part of the total cost of the products it supports. So manufacturers just pay what they must.

Most silver is produced as a byproduct of either lead, zinc or gold. As such, the price of silver isn’t a major influence on output. The result is that silver volumes aren’t that sensitive to price, which is why its price volatility is generally higher than for other precious metals such as gold.

There’s an interesting analogy with oil and gas in the US. Price forecasts for crude are bearish. The Energy Information Administration (EIA) expects Brent to average $51 a barrel next year. Goldman Sachs sees oil in the low 50s by 2H26 (see The Energetic Outlook For Energy). Brent is currently around $67.

The EIA sees only a modest impact on production, with US output falling from 13.4 Million Barrels per Day (MMB/D) this year to 13.3 MMB/D in 2026. As we noted in last week’s blog post, the EIA’s forecast production drop looks optimistic.

Upstream companies are preparing for something more dramatic. ConocoPhillips says it may lay off up to a quarter of its workforce by the end of the year. Chevron expects to cut by 15-20%. Perhaps the analysts at the EIA are wary of publishing forecasts that will antagonize the White House.

Oil wells in the Permian basin in west Texas and New Mexico produce associated gas, which means the oil/gas combination that comes out of the ground has to be separated. The oil is what they want. The region has been chronically short of gas infrastructure for years, although demand from data centers and LNG export terminals has recently spurred several new pipeline projects.

This raises an interesting problem. If crude output drops farther than the EIA expects, natural gas output from the Permian will fall too. This will occur just as demand from data centers and LNG export terminals is ramping up. It’s why the EIA expects the Henry Hub natural gas benchmark to reach $5 per Million BTUs (MMBTUs) next year, compared to $3 currently.

In a quirk of the relationship between the two commodities, softness in crude oil could drive natural gas prices higher if E&P companies respond by cutting oil output, since in the Permian this would lower gas output too.

Just as silver production can be driven by the price of gold where they’re mined together, gas output in the Permian can depend on the price of oil.

This will create an opportunity for drillers in the Marcellus and Utica shales in Appalachia which is rich in gas and natural gas liquids, therefore responsive to gas prices.

Some have warned of a glut of US LNG supply, but importing countries are building regassification terminals too. The capacity of importers is on pace to be roughly 2X the world’s liquefaction capacity. So if every import terminal operated half the time, 100% of the world’s LNG export terminals would be in use.

EQT, a gas producer, just signed a deal with NextDecade. Normally it’s the buyers of LNG who contract for liquefaction capacity, but in this case a producer wants to lock in the ability to send their US-sourced natural gas overseas.

Weak oil prices have hurt sentiment across the energy sector. Even though midstream infrastructure has limited sensitivity to commodity prices, this has probably given some potential buyers pause before committing capital. The positive natural gas outlook hasn’t provided a sufficient counterweight, perhaps because regional gas prices vary widely since transportation costs can exceed the Henry Hub benchmark.

By contrast, moving oil costs a small fraction of the price of a barrel. There’s a global crude price that commands attention while movements in regional gas prices don’t resonate as much.

US natural gas prices are low by global standards. Even at $5 per MMBTUs the spread to European and Asian LNG benchmarks will sustain the economics of gas exports to those regions. As for data centers, the other source of demand growth, they’re most concerned with reliable power and how quickly it can be delivered. The newest data centers are seeking uptime of all but three seconds a year (i.e. to run 99.99999% of the time). Solar and wind, with their 20-35% capacity utilization, are hopeless in this respect.

Oil and gas prices in the US look set to diverge.

We have two have funds that seek to profit from this environment:

Energy Mutual Fund Energy ETF
 

The Energetic Outlook For Energy

SL Advisors Talks Markets
The Energetic Outlook For Energy
Loading
/

Goldman Sachs released a report last week forecasting that Brent crude will slip into “the low $50s” by late next year. It currently trades at around $66 per barrel, down $8 from its year-end level end and $11 over the past year.

The Energy Information Administration (EIA), in their most recent Short Term Energy Outlook (STEO) goes even further. They expect Brent to average $51 next year, $16 below their forecast for this year’s average. This suggests that it will spend some time in the $40s.

The reason is that supply is growing faster than demand. The EIA expects global inventories to swell by 2 Million Barrels per day (MMB/D) by the end of this year, up by 0.8 MMB/D from their previous forecast a month earlier. They do expect an impact on US production, which they see peaking at 13.4 MMB/D this year before slipping to 13.3 MMB/D next year. In good news for drivers, they see gasoline prices down 20 cents per gallon in 2026.

Over the near term, OPEC+ supply of liquids is forecast to be +1 MMB/D compared with 1H25, with non-OPEC supply led by the US, Brazil, Norway, Canada, and Guyana up by a similar amount.

Global demand is growing, just not by as much. The EIA expects consumption of petroleum and other liquids to reach almost 105 MMB/D next year. Growth is all in non-OECD countries. Interestingly, Indian consumption is expected to grow more than China’s, even though the latter uses 3X as much.

The EIA’s crude oil forecast is aggressive. If crude trades into the $40s next year, I would think US shale production will fall more sharply than the EIA suggests. Crude futures are priced around $15 above the EIA’s forecast for next year. If E&P companies think the EIA is correct, it should already be affecting today’s planned production. Upstream capex is falling but doesn’t reflect that type of price plunge.

It also seems likely that oil that cheap will stimulate demand. Consumption in China and India will probably grow faster. And surely OPEC+ would reinstitute their supply cuts in the face of such a glut.

Although the EIA forecast incorporates some supply response from producers, it’s mild and seems incongruent with their price forecast.

The White House wants more output and lower prices. They should be pleased with the EIA’s STEO. A conspiracy theorist might wonder if the analysts producing such work are at least subliminally aware that projecting high prices might draw the administration’s ire.

Perhaps that’s also the case at Goldman Sachs. President Trump recently called on CEO David Solomon to fire the bank’s top economist over his bearish and so far, wrong call related to tariffs. I doubt the EIA would project crude prices $15 above the futures curve. Who wants to be part of the news cycle and pilloried on Truth Social?

The EIA is supposed to be immune to political influence. In my experience they’ve made plenty of wrong forecasts, including for years being overly pessimistic about US crude output. But they always looked independent. Today, I’m willing to bet that their oil forecast is wrong, but less sure that it’s issued oblivious to any potential presidential feedback.

We’ll never know. Independent thinking is important.

The EIA’s natural gas outlook is more constructive. They expect production of around 117 Billion Cubic Feet per Day (BCF/D) next year including natural gas liquids, flat with 2025 but +3% on last year. Wells in the Permian basin in west Texas tend to become gassier over time, so falling crude production there is expected to trim associated gas output. However, growth in both the Haynesville in Texas and the Appalachia region in the north east will offset.

The EIA expects the natural gas price benchmark to move above $5 per Million BTUs (MMBTUs) by the end of next year, compared with under $3 per MMBTU at present. Gas demand for data centers and for growing LNG exports are the twin drivers.

Capex on data centers by companies such as Microsoft, Google, Amazon, and Meta is around $340BN this year. An interesting comparison is with US corporate tax revenue, which was $530BN last year and around 11% of total Federal revenue. It’s hard to overstate the size, and they’ll need natural gas power plants for electricity.

US electricity consumption is at the start of steady annual increases following decades of almost no growth. The EIA expects +2.2% this year and +2.3% next year. We expect natural gas to be the most important source of supply for this additional power generation.

We think the EIA is getting it right with its gas and power forecasts, but on the price of oil looks overly influenced by the White House. But in almost any scenario, energy consumption is going up.

We have two have funds that seek to profit from this environment:

Energy Mutual Fund Energy ETF
 

Midstream Is Better Under Trump 2.0

SL Advisors Talks Markets
Midstream Is Better Under Trump 2.0
Loading
/

Now that we’re more than six months into Trump 2.0, comparisons with Trump 1.0 are spreading. For energy investors, Trump’s first term was a huge disappointment compared with the high expectations held by many when he took office. A year ago, as investors pondered the impact of a Kamala Harris presidency, we were often asked if we worried about a progressive in the White House.

In fact, Joe Biden’s presidency was far better for energy investors. His antipathy towards hydrocarbons fostered cautious capex among energy executives, a sharp contrast with the exuberant spending plans that accompanied Trump’s 2016 victory. Trump 1.0 led to overinvestment and weak prices, compounded by the demand destruction of pandemic lockdowns. Financial discipline returned during Biden.

The result was a –6.2% annual return under Trump 1.0 and a +33.8% annual return under Biden. Left wing policies inadvertently enriched traditional energy investors. However, following Biden’s debate disaster on June 27, 2024 the midstream sector continued its strong performance when polls shifted towards Trump.

Trump 2.0 has been better for energy investors than before but more volatile. A regulatory environment that once again is supportive of hydrocarbons has helped, and companies have been more cautious about spending. Oil and gas prices have fallen this year as the new administration has made clear its desire for increased production. The president’s love for hydrocarbons favors volumes over profits.

Energy executives are being more cautious than eight years ago, and the top US shale producers have mostly been cutting capex as both oil and gas prices have remained under pressure. OPEC+ is abandoning their production cuts and Trump’s efforts to negotiate peace in Ukraine are regarded as likely to bring more Russian energy exports onto the market.

By contrast, midstream companies have been increasing their planned spending, with the biggest c-corps in the sector raising 2026 capex by 44% compared with plans a year ago.

The difference is oil versus gas. Growth in electricity demand for new data centers and additional feedstock for new LNG export capacity are the twin drivers of natural gas growth. Today’s data centers will tolerate only 3 seconds of downtime a year (i.e. 99.99999% uptime) which makes intermittent renewables a poor choice. Natural gas power plants are usually the best choice, which will drive the share of our electricity derived from gas above its current 43%.

Much of the new activity is centered in Texas. Gas pipelines are being built to connect with new data centers and to feed into the growing LNG export capacity. The map from RBNEnergy shows how much energy infrastructure is being added in Texas and the Gulf coast.

Takeaway capacity for gas is being added in the Permian in west Texas. Oil wells in that region also produce “associated gas”, which means it’s not what they’re drilling for but comes out of the ground anyway. Even though E&P companies have been trimming their budgets, mature wells become gassier as they mature, so gas production won’t be as affected by reduced capex.

LNG export capacity continues to grow – most recently Venture Global announced Final Investment Decision for Phase 1 of CP2 LNG, a $15BN project that is expected to become operational in 2027.

There’s also increased activity in the northeast centered around gas production in the Marcellus shale.

Some may identify parallels with 2016 when the energy sector geared up for more production and throughput, pulling back as investors soured on growth that wasn’t accretive. The big difference today is that long term commitments are underpinning both the new LNG terminals and the additional gas pipeline capacity.

Leverage of 3-3.5X Debt:EBITDA is lower than the 4-5X that was more common eight years ago. Kinder Morgan’s credit rating was recently upgraded by Fitch based on their expectation that leverage would remain below 4.0X.

2Q25 earnings across the sector generally came in as expected with no great surprises.

Many years ago pipelines were organized as Master Limited Partnerships (MLPs), free from corporate taxes in exchange for complicated tax reporting for those wealthy US investors so inclined. As most of them converted to a conventional corporate structure (“c-corps”), they accepted a corporate tax liability in exchange for accessing a broader investor base.

Helped by depreciation rules that understate the true useful life of their assets, taxes have remained low. For the selected US c-corps in the chart, their average estimated tax rate this year is only 5%. It’s not expected to increase meaningfully until 2028 and compares favorably with the average tax rate paid by S&P500 companies of 25%.

The One Big Beautiful Bill (OBBA) cut rates by an average of 4% for E&P companies and likely had a similar effect on midstream as well. Weak energy prices may have weighed on the sector this year, but at least tax policy is allowing investors to retain more of the profits.

It’s another reason we think midstream energy infrastructure offers attractive prospects.

We have two have funds that seek to profit from this environment:

Energy Mutual Fund Energy ETF


image_pdfimage_print