Can Pay Raises Keep Up With Inflation?

/
For the first time in history, nurses who work for Britain’s National Health Service went on strike last week. They’re demanding a 19% pay increase, to make up for current inflation as well as the “20 per cent that has been eroded” from pay over the past decade, according to union leader Pat Cullen.
Nurses in the UK occupy a special place in the public consciousness, evoking memories of Florence Nightingale who led a team of 38 to treat wounded soldiers during the Crimean War in 1854. Underpaid yet much loved is how many Britons feel towards them. In Germany, average pay for nurses is €33K ($35K). The US median is $78K. The average British nurse makes £26K ($32K). Some report relying on patients’ food at the end of the month while awaiting their paycheck.
Europeans are supportive of unions and tolerate strikes more than the US. Traveling by train from London to Paris last Friday, our daughter was advised to allow extra time to pass through Immigration, thanks to Brexit. The transit system faced another strike the following day, and her (perhaps over-protective) father reminded her not to get sick while the nurses were on strike.
The problem is that workers in many fields are getting pay raises less than inflation, imposing a drop in living standards. Congress shouldn’t have passed last year’s $1.9TN American Rescue Plan (ARP), and the Federal Reserve was at least a year late in shifting from its accommodative policy. These were two large mistakes. As a result, the Fed wants to drive unemployment higher, thereby pressuring real incomes. This is the consequence of the twin fiscal and monetary failures.
Pay that lags inflation requires workers to conclude no better alternative is available. There are signs of economic weakness. House prices are softening. November’s auto sales figure of 14.6 million (seasonally adjusted, annualized) is recession-like, with 15-17 million more typical when the economy is growing. Recession forecasts are common, but the jobs market remains strong.
In April 2021, CPI registered 4.2% year-on-year, just when Congress passed the ARP and checks started going out to tens of millions of Americans. We’re close to two years of above target inflation. It’ll increasingly figure in wage negotiations until there’s more slack in the labor market.
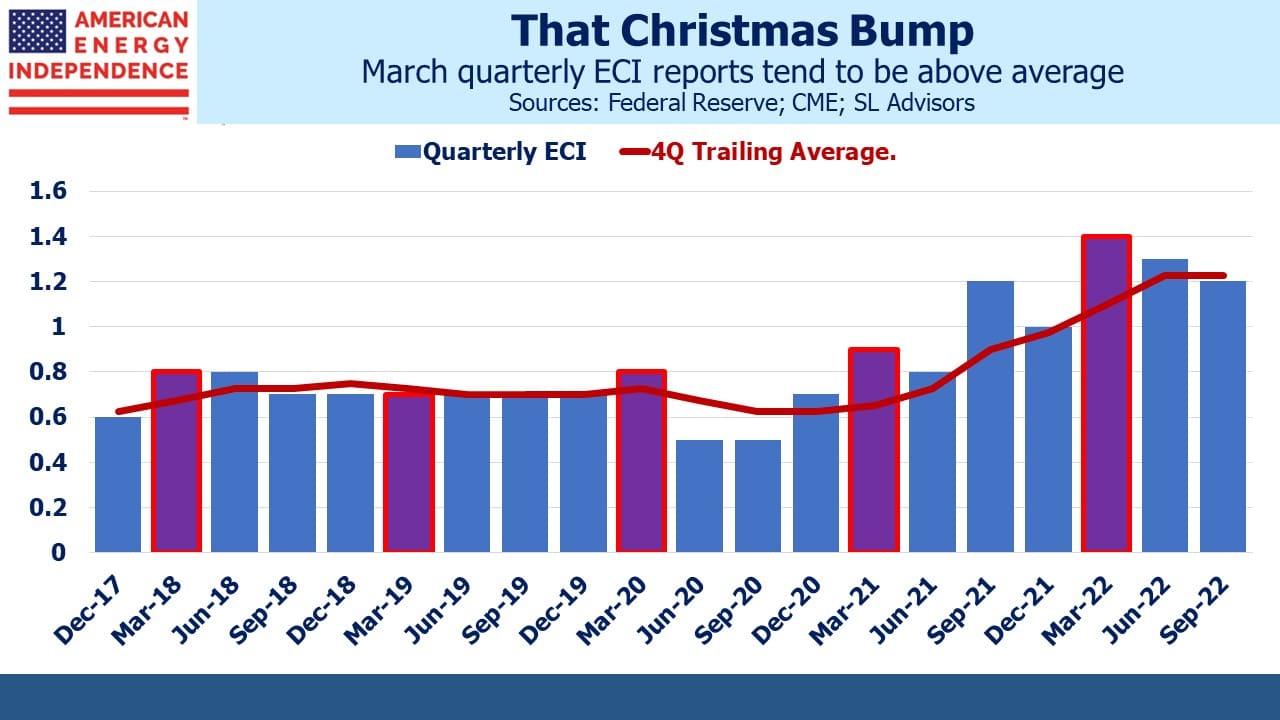
The Employment Cost Index (ECI) is rising at 5%, but adjusted for inflation is –2.9%. Year-end pay reviews are the norm across corporate America. For the vast majority of people who have held their current job for at least the last year, first quarter pay raises are common.
The ECI is seasonally adjusted, but the adjustment factors may be inadequate this time because annual raises will likely be bigger than usual. There are signs this is already happening. For several years the March ECI report has been above the trailing 4Q average. This bias has become more noticeable in the last two years. The seasonals haven’t caught up with higher annual pay raises to reflect increased inflation.
This suggests that wage inflation reported in the March ECI will be above trend and higher than the Fed would like. It’ll be published in April so is some way off – we’ll revisit this topic closer to the date. Some annual pay raises occur during the 4Q so will be picked up in January’s release, but so far there hasn’t been any visible anomaly in past releases of the December ECI.
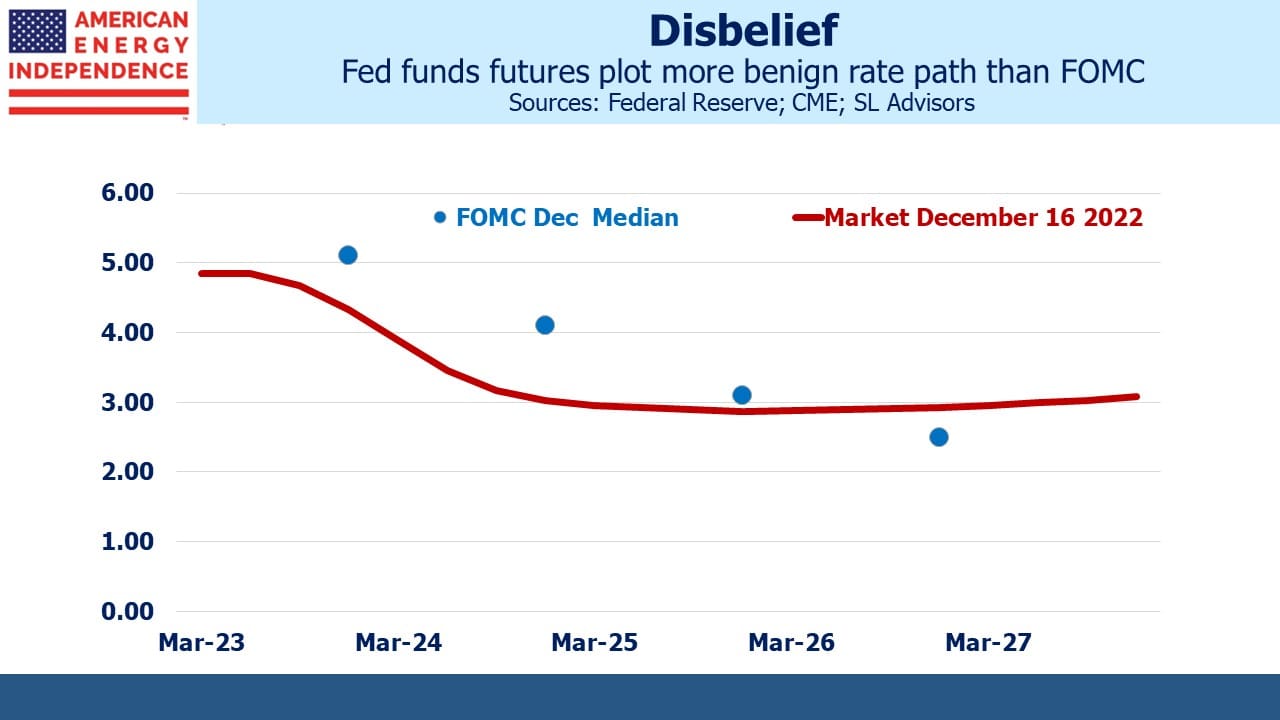
Last week the FOMC updated their Summary of Economic Projections (SEP). A more hawkish path for the Federal funds rate depressed stocks. The biggest discrepancy is with Dec ‘24 futures which yield 3%, 1% less than the SEP. The market thinks a recession is more likely than the Fed does, and therefore expects the Fed to cut rates next summer.
Inflation expectations remain well contained, which provides an exit ramp from tight policy anytime the FOMC wants to use it. But Fed chair Jay Powell doesn’t sound as if 4.6% unemployment (the SEP forecast for the end of next year) will be problematic. Economists debate what unemployment rate represents full employment. Its snappy title is the Non-Accelerating Inflation Rate of Unemployment (NAIRU). You only know where NAIRU is when falling unemployment causes inflation. Today’s 3.7% rate is well below it.
The St Louis Fed has a chart showing NAIRU at 4.4%. Some economists think it’s higher because of Covid-induced goods-inflation and reduced labor force participation. The Fed is unlikely to reduce rates until they’re sure the unemployment rate is above NAIRU, because they’ll be motivated to avoid yet another policy error. Once they start cutting rates, if inflation doesn’t keep falling, they’ll face no shortage of critics.
Jay Powell insists they’ll stay the course and maintain restrictive policy until inflation is clearly returning to 2%. When the blue dots on the SEP differ from the futures market, it’s usually resolved at the cost of the FOMC’s forecasting reputation. This time may be different.
We have three funds that seek to profit from this environment:

Important Disclosures
The information provided is for informational purposes only and investors should determine for themselves whether a particular service, security or product is suitable for their investment needs. The information contained herein is not complete, may not be current, is subject to change, and is subject to, and qualified in its entirety by, the more complete disclosures, risk factors and other terms that are contained in the disclosure, prospectus, and offering. Certain information herein has been obtained from third party sources and, although believed to be reliable, has not been independently verified and its accuracy or completeness cannot be guaranteed. No representation is made with respect to the accuracy, completeness or timeliness of this information. Nothing provided on this site constitutes tax advice. Individuals should seek the advice of their own tax advisor for specific information regarding tax consequences of investments. Investments in securities entail risk and are not suitable for all investors. This site is not a recommendation nor an offer to sell (or solicitation of an offer to buy) securities in the United States or in any other jurisdiction.
References to indexes and benchmarks are hypothetical illustrations of aggregate returns and do not reflect the performance of any actual investment. Investors cannot invest in an index and do not reflect the deduction of the advisor’s fees or other trading expenses. There can be no assurance that current investments will be profitable. Actual realized returns will depend on, among other factors, the value of assets and market conditions at the time of disposition, any related transaction costs, and the timing of the purchase. Indexes and benchmarks may not directly correlate or only partially relate to portfolios managed by SL Advisors as they have different underlying investments and may use different strategies or have different objectives than portfolios managed by SL Advisors (e.g. The Alerian index is a group MLP securities in the oil and gas industries. Portfolios may not include the same investments that are included in the Alerian Index. The S & P Index does not directly relate to investment strategies managed by SL Advisers.)
This site may contain forward-looking statements relating to the objectives, opportunities, and the future performance of the U.S. market generally. Forward-looking statements may be identified by the use of such words as; “believe,” “expect,” “anticipate,” “should,” “planned,” “estimated,” “potential” and other similar terms. Examples of forward-looking statements include, but are not limited to, estimates with respect to financial condition, results of operations, and success or lack of success of any particular investment strategy. All are subject to various factors, including, but not limited to general and local economic conditions, changing levels of competition within certain industries and markets, changes in interest rates, changes in legislation or regulation, and other economic, competitive, governmental, regulatory and technological factors affecting a portfolio’s operations that could cause actual results to differ materially from projected results. Such statements are forward-looking in nature and involves a number of known and unknown risks, uncertainties and other factors, and accordingly, actual results may differ materially from those reflected or contemplated in such forward-looking statements. Prospective investors are cautioned not to place undue reliance on any forward-looking statements or examples. None of SL Advisors LLC or any of its affiliates or principals nor any other individual or entity assumes any obligation to update any forward-looking statements as a result of new information, subsequent events or any other circumstances. All statements made herein speak only as of the date that they were made. r
Certain hyperlinks or referenced websites on the Site, if any, are for your convenience and forward you to third parties’ websites, which generally are recognized by their top level domain name. Any descriptions of, references to, or links to other products, publications or services does not constitute an endorsement, authorization, sponsorship by or affiliation with SL Advisors LLC with respect to any linked site or its sponsor, unless expressly stated by SL Advisors LLC. Any such information, products or sites have not necessarily been reviewed by SL Advisors LLC and are provided or maintained by third parties over whom SL Advisors LLC exercise no control. SL Advisors LLC expressly disclaim any responsibility for the content, the accuracy of the information, and/or quality of products or services provided by or advertised on these third-party sites.
All investment strategies have the potential for profit or loss. Different types of investments involve varying degrees of risk, and there can be no assurance that any specific investment will be suitable or profitable for a client’s investment portfolio.
Past performance of the American Energy Independence Index is not indicative of future returns.


NAIRU is really just the debunked Phillips curve hiding behind a different term. Employment is orthogonal to inflation. Always and everywhere.
Japan had decades of unemployment below 2% with no inflation. Argentina has decades of >20% inflation with 10% unemployment.
You compared average nurse salaries in Germany and the UK with the US median salary. Would it not have been more accurate to compare the US average salary as well?
Should be even more interesting if those idiots in DC pass the current $1.7BN spending bill recently proposed. Stupid just keeps getting stupider.