Discussing the Shale Revolution with Enlink Midstream

We thought it would be interesting to learn how the Shale Revolution has changed some of the midstream infrastructure businesses that support it. What have these companies learned, and how are their operations affected?

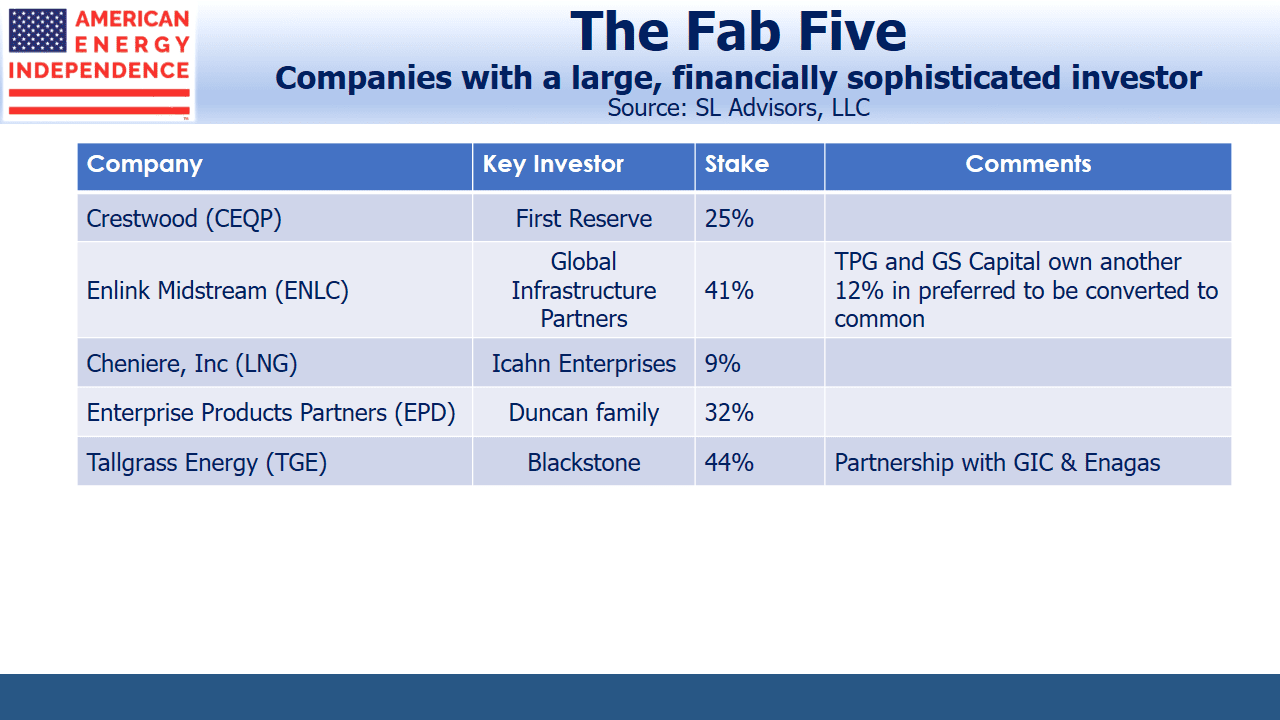
For the first in an occasional series on this topic, we chatted with Adrianne Griffin, Director, Investor Relations with Enlink Midstream (ENLK). Four years ago, ENLK was created when Devon Energy (DVN) combined its midstream infrastructure assets with those of Crosstex. Because DVN controls ENLK through its ownership of the General Partner (GP) Enlink Midstream, LLC (ENLC), the two businesses remain tightly linked. DVN can claim to own some of the original assets that led to the Shale Revolution; George Mitchell was an early pioneer of horizontal fracturing (“fracking”), and in 2001 DVN acquired its eponymous company which had unlocked natural gas reserves in the Barnett Shale, in north Texas. Without the Shale Revolution, it’s unlikely ENLK would have been created.

Like all energy infrastructure businesses, ENLK’s relies heavily on the activities of its oil and gas producing companies. Anticipating shifts in production is crucial to ensuring that pipeline and other capacity is available as needed. As the Shale Revolution has gained importance, companies like ENLK aim to align their capacity with customer demand. An under-utilized pipeline represents an inefficient use of assets, but no producer wants to find that output can’t be cheaply processed and transported. The alternatives are to move product by train or truck, both of which are more flexible but substantially more expensive and less safe.

Although the improvements in technology have largely been at the producer level, the resulting increased production certainly impacts the need for infrastructure. Ms Griffin discussed how multi-well pad drilling had dramatically boosted efficiency, since today it’s not uncommon to see a row of four pads with four rigs drill two dozen individual wells. She contrasted this with past practice of drillers poring over maps and selecting single well locations with a marked dot. Today, it’s increasingly common to see software engineers remotely guiding multiple drilling rigs from a central control station (see Drillers turn to big data in the hunt for more, cheaper oil).

Although the Barnett Shale was where the Shale Revolution began,  it was long eclipsed by prolific gas output from the Marcellus in the northeast and oil production in the Permian Basin in west Texas. Oklahoma’s “Scoop and Stack” is another high-producing region, and ENLK is well positioned to benefit from increasing production there. Techniques originally developed in Mitchell Energy’s original acreage have been successfully transferred from north Texas to Oklahoma. Although ENLK is slowly diversifying its customer basis, it’s no surprise that DVN is 50% of their business in that region.

Pressure is the name of the game. Ms. Griffin explained why “Keep the pressure low” is a constant refrain. If the pressure at which existing oil and gas are moved through the pipeline network is too high, it makes it harder for new production to enter the system. A key element of managing flow is to find the right balance between optimal management of the pipeline network that still accommodates additional supply coming on. Shale wells are characterized by high initial production rates that decline quickly. When you combine this with multi-well pad drilling, it can lead to producers quickly adding new supply that soon tapers off. In order to manage overall pipeline pressure, drillers often leave some wells as Drilled Uncompleted (“DUCs”), or choke back initial output, in order to deliver less variable flow to their midstream infrastructure provider. Drillers and their infrastructure providers are in constant contact.

On the processing side, ENLK have been investing in new, cryogenic processing plants, because the gas stream they’re asked to process is a lot “richer”. This means it contains Natural Gas Liquids such as ethane and propane, which must first be removed and sold separately before the methane can be supplied to customers as natural gas.

In an interesting twist, DVN recently announced plans to divest its acreage in the Barnett to focus on Oklahoma and West Texas.   However, technology has improved tremendously since George Mitchell’s day, and it’s allowing the re-exploitation (‘re-frack”) of wells that were previously regarded as having little remaining commercial value for new potential owners.

Since ENLK is an MLP with a GP, no discussion would be complete without asking about the financing model. Over the past couple of years most large MLPs have combined their GP and MLP. Euphemistically called “simplification”, it’s generally resulted in lower distributions and unwelcome tax consequences for investors. Although management teams typically blame the difficulty of raising equity capital with the GP/MLP structure, the problems are invariably self-inflicted as overly ambitious growth plans stretch distribution coverage and leverage covenants. NuStar’s recent combination with its GP, NuStar GP Holdings, is an example.

While ENLK has certainly benefited from a strong corporate sponsor in DVN, they’ve also maintained leverage at 3.5-4X Debt:EBITDA, and have managed their growth so as to retain an investment grade debt rating. More than three years since the peak in the energy infrastructure sector, it’s a prudent approach that is paying off.

We are invested in ENLC

Shale Leads Growth in Proved Reserves

On Thursday the U.S. Energy Information Administration (EIA) released updated figures on proved reserves as of 2016. In order to count as proved, companies must be reasonably certain that the reserves are recoverable under existing operating and economic conditions. Improvements in technology have increased the amount of recoverable reserves from some shale formations.

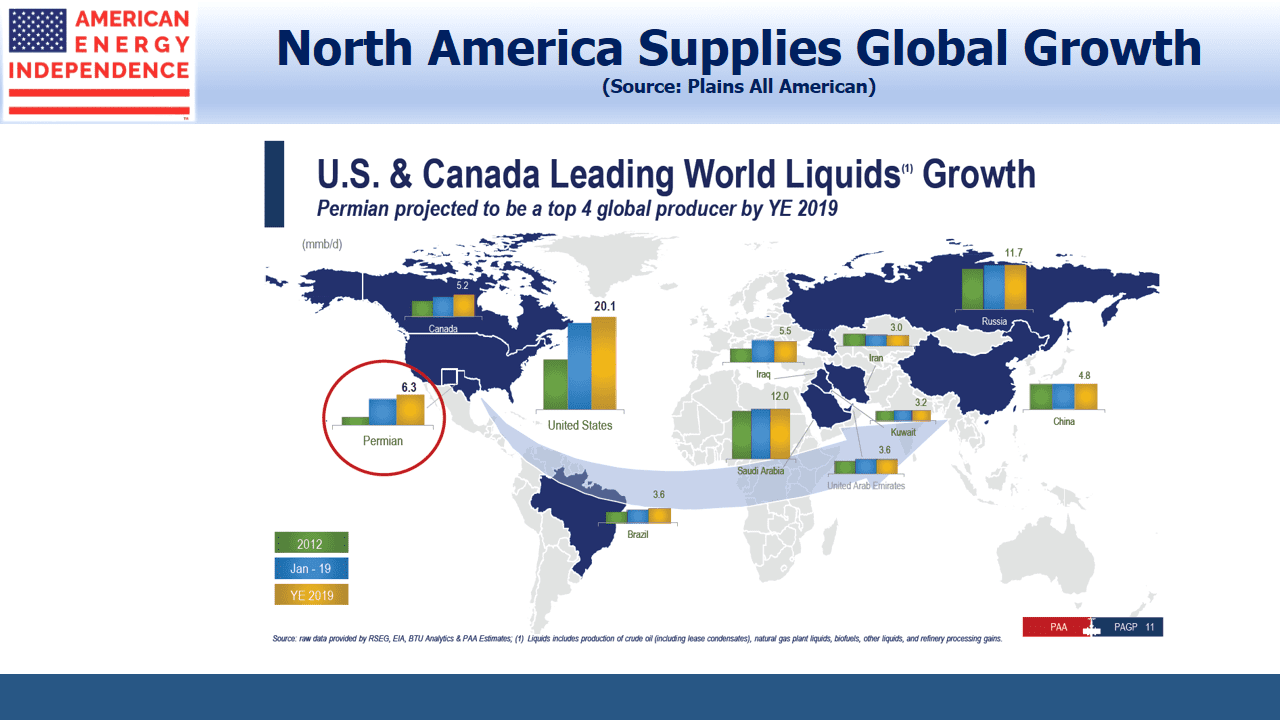
The dramatic increase in Permian reserves is driving increased production. As we noted (see Rising Oil Output Is Different This Time), Permian output is set to reach 3 Million Barrels per Day (MMB/D) in March. It’s increasingly looking as if pipeline demand is approaching capacity. JPMorgan recently said they expect pipeline bottlenecks to develop in 2H18 and into 2019, before additional capacity currently under construction is added. But they expect that by 2020 tightness will occur again. Permian production is expected to reach 3.5 MMB/D by the end of this year, and continue rising to 4.1 MMB/D through 2019 and 4.9MMB/D by 2020.

New takeaway capacity will be required by then. In recent years, midstream infrastructure businesses have rarely missed an expansion opportunity even if it led to stretched balance sheets. NuStar (NS) was the most recent firm to acknowledge such over-reach. The collapse of their GP/MLP structure and distribution cut announced ten days ago were caused in part by the failure of their early 2017 Navigator acquisition to ramp up cashflows quickly enough. The industry’s history of providing new capacity too readily has diverted cashflows from distributions to growth and debt repayment, frustrating traditional investors. They’ll be hoping that recent financial discipline sweeping across energy producers similarly afflicts pipeline operators, resulting in higher returns on future projects.

Overall U.S. proved reserves of crude oil and lease condensate were virtually unchanged in 2016 versus 2015 at 35.2 Billion Barrels. Gains in the Lower 48 states were offset by declines in Alaska and offshore. Proved reserves of natural gas rose 5% to 324 Trillion Cubic Feet, as total additions were 150% of production. The U.S. continues to enjoy a substantial cost advantage in natural gas production, with exports of Liquified Natural Gas (LNG) set to reach 10 Billion Cubic Feet per Day (BCF/D) by late 2019, 3% of global consumption.

Commodity prices affect proved reserves as they have to be commercially recoverable. The 2016 oil and gas prices used for these calculations were 15% and 6% lower than in 2015. When the 2017 figures are published they’ll be based on oil and gas prices 20-21% higher. U.S. reserves are likely to keep growing.

The American Energy Independence Index (AEITR) finished the week +2.7%.

Please click here for important legal disclosures.

Rising Oil Output Is Different This Time

Although we’re used to reading about growth in U.S. shale production, recent figures from the Energy Information Administration are still striking. Crude oil output from the Permian in west Texas is set to reach 3 Million Barrels per Day (MMB/D) in March, up by more than 70K from February. Output is growing at an increasing rate. Natural gas output is also growing – Appalachia (how the EIA refers to the Marcellus Shale in Pennsylvania, Ohio and West Virginia) is expected to produce around 27 Billion Cubic feet per Day (BCF/D) in March. The Permian represents close to a third of all U.S. crude output, and the Marcellus just over a third of natural gas.

In December, the EIA forecast Permian growth of 515K in daily output over 18 months from June 2017 to the end of this year, so the March 2018 increase is almost three months’ worth. The International Energy Agency is similarly optimistic, predicting that the U.S. will be the world’s largest oil producer by 2019. This seems like good news if you’re American and especially if you’re employed or invested in the energy sector. But the cloud on the horizon is whether this presages a repeat of the 2014-16 oil price collapse that was caused by surprisingly fast U.S. output. The WSJ noted that U.S. crude output looks set to outpace global demand in 2018, rekindling unpleasant memories. One observer tweeted “US shale firms remove pistol, aim at own foot, and fire.” However, crude prices barely dipped on the news.

U.S. oil and gas producers promise greater financial discipline following vocal investor feedback. Achieving an acceptable return on capital is now more fashionable than growing production. Chevron, Anadarko and ConocoPhilips have all recently announced dividend hikes, thoughtfully providing investors with a little Valentine’s Day love.

The bullish case for energy infrastructure rests on sustainable production growth, so although pipeline owners don’t drill for crude oil the financial health of their customers is important. Although U.S. output growth may exceed net new demand, existing oil fields experience aggregate global depletion of 3-4MMB/D, so new supply needs to cover this as well. In spite of the Shale Revolution, there’s still a need for other new sources of supply. If U.S. producers are sincere about their financial discipline, this should lead to more sustainable growth in output and good business for energy infrastructure.

Why Risk Parity Could Boost Energy Stocks

Risk Parity is a portfolio construction technique that seeks to allocate capital so as to maintain similar levels of risk from each asset. Some commentators are blaming it for the recent market turmoil, since superficially its practitioners are expected to reduce risk when it rises. That can often mean selling stocks. AQR is among the asset managers who employ this approach. In 2010 they published a paper explaining the theory, noting that traditional portfolios typically derive a larger proportion of their risk from equities than is implied by simply looking at percentage allocations.

A 60:40 stocks/bonds portfolio will incur more than 60% of its risk from stocks, because they move more than bonds. Risk Parity seeks to compensate for this, and the paper showed improved returns over a passive 60:40 approach. The paper goes on to describe a portfolio with less equity exposure than a traditional 60:40 portfolio and correspondingly less risk. Because it has a higher Sharpe Ratio (i.e. better risk/return) but lower return, leverage is then employed to raise the risk to the same as 60:40, at which point the return should be higher.

Since allocations under a Risk Parity regime target a given level of risk, changes in risk estimates will lead to a shift in allocations, and may also require changes to leverage. One popular measure of risk is volatility. For simplicity, we’ve defined it as the average percentage daily move over the prior ten days. Although Risk Parity is typically applied to asset classes, the concept can also be applied to sectors within an asset class. A strategy of achieving Risk Parity among asset classes can also be designed to achieve Risk Parity across sectors within an asset class.

In response to criticism that funds employing Risk Parity are behind the recent sharp moves, some managers of such funds have responded that such shifts are slow – their models are designed to recalibrate over longer periods than just a few days. It’s impossible to know the extent to which the critics are right — on Friday JPMorgan estimated that most of the “severe” unwind was over. However, we’ve noticed another shift, which is that risk in the energy sector is falling relative to the S&P500. This is partly due to correlations increasing, as they do during market dislocations. Sector differentiation becomes less important than overall market exposure, and sectors move up and down together. For example, the S&P Low Volatility Index is down 6.5% for the month, almost as much as the S&P500 itself (down 7.2%), even though Low Vol should be, well, less volatile.

Nonetheless, Risk Parity strategies that are deployed at the sector level could eventually increase energy exposure at the expense of other sectors whose relative volatility against the S&P500 has increased.

It can seem an arcane topic. But put simply, in a time of heightened volatility, the Energy sector is gyrating with the rest of the market whereas it was previously moving sometimes twice as much. The first chart compares XLE with SPY, where although average daily moves have increased in both cases, SPY moves have jumped by 150% while XLE moves have “only” doubled.

Many reliable trends have abruptly shifted, including persistent low volatility. The spectacular collapse of the Credit Suisse note (XIV) following the spike in volatility was extraordinary. Why would people hold a product that seems destined to eventually blow up?

The difference in volatility is more dramatic when comparing Energy Infrastructure (defined here by the American Energy Independence Index) with the S&P500. Their average daily moves are roughly the same. Until recently, energy infrastructure (including MLPs) was moving twice as much as the broader market. Domestic, midstream assets that support U.S. energy independence have experienced a comparatively modest increase in volatility compared to the overall market. Daily moves in the S&P500 and energy infrastructure are converging. At a time of increased uncertainty, if investors begin to value the more reliable cashflows these companies generate, further buying of the sector will follow.

The American Energy Independence Index (AEITR) finished the week -4.2%, outperforming the S&P500 which was -5.2%.

The Positives Behind Exxon Mobil’s Earnings

The sharp drop in equities since Friday is notable for missing any obvious catalyst. Interest rates have been headed higher, but they’re far too low to offer value and the Equity Risk Premium continues to strongly favor stocks over bonds. A sharp move higher in interest rates could shift relative valuations away from bonds, but we’d need to see rates 1-2% above where they are today.

Earnings have generally been good, but Exxon Mobil (XOM) disappointed with their report on Friday morning and duly dropped 10% over the following two trading sessions. They missed expectations across each segment. They have failed to make money in U.S. oil and gas production for over two years, and their refining margins were also squeezed.

However, XOM’s travails shouldn’t tarnish the outlook for energy infrastructure. First, they announced plans to invest $50BN in the U.S. over the next five years. CEO Darren Woods singled out the Permian Basin in West Texas and New Mexico as an important target for some of this capital investment. This is exactly what energy infrastructure investors should be excited about. It’s evidence that the world’s biggest energy companies recognize the value in the Shale Revolution. Unconventional “tight” oil and gas formations offer rapid payback for a small initial investment. Capital invested is often returned within two years, allowing price risk to be hedged in the futures market. In Why Shale Upends Conventional Thinking , we noted last year that XOM’s CEO expected a third of their capex to be devoted to such opportunities. In response to a question on their recent earnings call, VP Jeff Woodbury replied, “…While we continue to invest across all segments, this increase compared to 2017 is primarily driven by higher investment in short-cycle Upstream opportunities, notably U.S. unconventional activity and conventional work programs, both of which yield attractive returns at $40 per barrel.” Woodbury continued, “As I indicated before when we were talking about the five-year projection of $50 billion, that is a very attractive investment. We’ve got – at a low price forecast we’ve got returns in excess of 10% with a $40 per barrel…”

Other multinational energy companies reported good earnings, including Royal Dutch Shell (RDS) and BP.

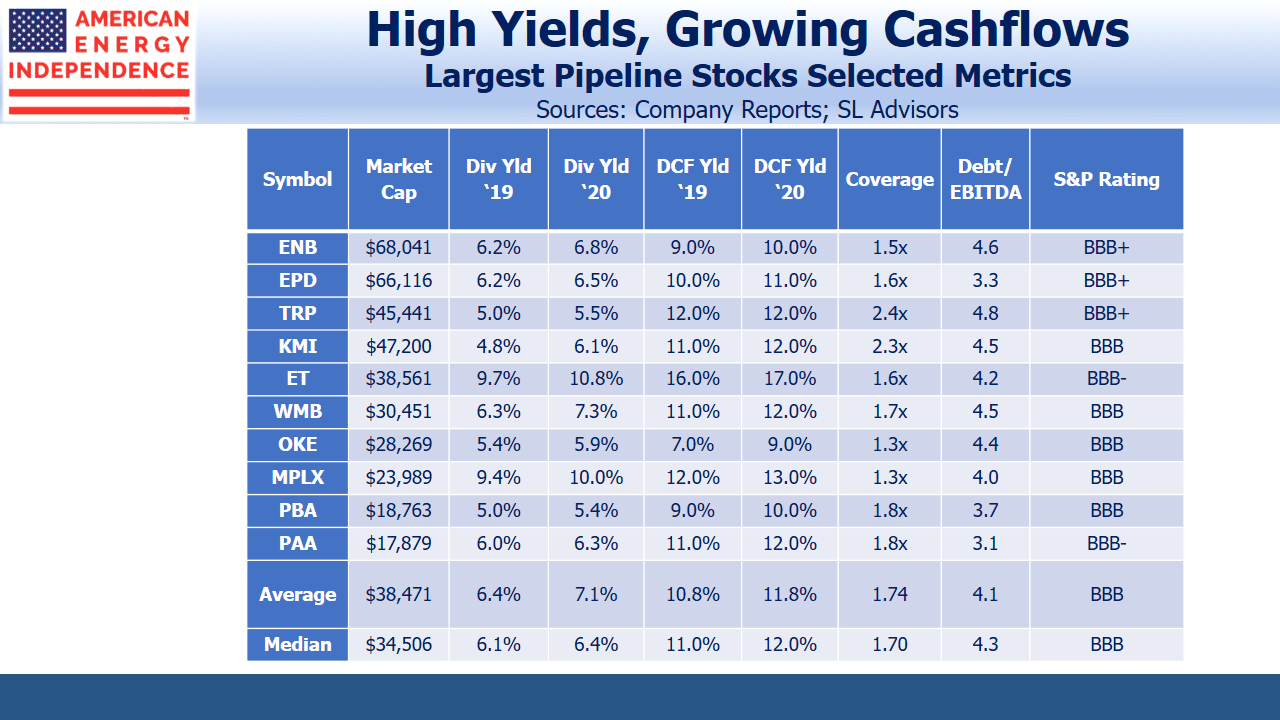
In addition to positive fundamental developments such as XOM’s future investments focused in the U.S., energy infrastructure was completely bypassed by last year’s strong equity rally. Few investors in this sector can be guilty of irrational exuberance, and there’s unlikely to be many panic sellers. We continue to see investors allocating new money, including yesterday in spite of the sharp drop in the market. This reflects the value that investors increasingly see in the sector. Energy infrastructure companies are valued at a 9% Free Cash Flow yield based on 2018 earnings, and 10% based on 2019.

By contrast, the S&P 500 Energy Corporate Bond Index yields only 3.8%. The truly overvalued sector is the bond market, especially long term government and high grade bonds whose yields remain too low to provide a reasonable return and show overvaluation compared with stocks (see Down’s A Long Way for Bonds). Fixed income investors should consider switching into energy infrastructure equities.

Down’s A Long Way for Bonds

In my 2013 book Bonds Are Not Forever; The Crisis Facing Fixed Income Investors, I forecast that interest rates would stay lower for longer than many people thought. The 2008 Financial Crisis was caused in part by excessive levels of debt. Interest rates below inflation are a time-tested way to gradually lessen the burden of a country’s unmanageable obligations. The book’s forecast was right, and more importantly the low rate strategy has succeeded. Household debt service costs have fallen as a proportion of income. U.S. GDP is growing solidly at 2.5% and possibly faster, and at 4.1% the Unemployment rate has fallen to levels that were previously associated with rising inflation. We are enjoying synchronized global growth. In short, regarding Low Rates: Job Done.

The Federal Open Market Committee (FOMC) has been unwinding its policy of extreme accommodation at a measured pace. Short term interest rates have been lifted from 0% to 1.4%. Bond yields have also been rising, with the Federal Reserve having announced last year the end of their bond buying program. Their balance sheet is close to $4.5TN, and although they’ll continue to reinvest interest income it will eventually start shrinking as their holdings mature.

Lastly, the 2017 Tax Cuts and Jobs Act was stimulative. Falling household debt service, synchronized global growth, no more Fed buying of bonds and tax stimulus are not likely to be supportive for bond prices.

It’s true that in recent years many forecasters have mistakenly expected rates to rise faster than they have. Although the FOMC is not known for frivolity, even they must have chuckled in embarrassment at their own forecasting errors. For several years now, the FOMC has issued forecasts for the Fed Funds rate (i.e. the interest rate they control directly) only to consistently undershoot. They correctly value achieving the right policy rate more than saving their blushes as forecasters.

The challenge for bond investors, as they contemplate the declining value of their holdings, is to identify their fair value. Using ten year treasury yields as a benchmark, what is its neutral level?

The news is not good. As we noted recently (see Rising Rates and MLPs: Not What You Think), the real return (i.e. the return above inflation) on ten year treasuries going back to 1927 is 1.9%. This means that today’s investors should require at least 4% (approximately, inflation plus the historic real return). A 4% yield would deliver the average real return assuming inflation averages 2% over the next decade. Although yields are rising, the current 2.8% ten year yield is inadequate on this measure.

Synchronized global growth and fiscal stimulus are both heading in the wrong direction for a bond investor. Although the FOMC is forecasting 2.5% U.S. GDP growth this year and 2.1% next, they maintain that the long run trend is only 1.8%. This is why they’re projecting higher short term rates over the next couple of years, as well as Personal Consumption Expenditures inflation (their preferred measure) creeping up from 1.5% last year to 2% next year. In a sign that a tightening labor market is stoking wage inflation, Friday’s Employment report included a 2.9% annual increase in hourly earnings, the biggest jump since 2009.

A few weeks ago we revisited the Equity Risk Premium (ERP), which shows that stocks are cheap, relative to bonds. The corollary is that bonds are expensive relative to stocks. Yields need to rise by around 2% to return the ERP back to its 50+ year average. Historical comparisons with real returns and relative valuation to equities both argue that today’s bond market is a poor investment. Although this has been the case for several years, now the fiscal and economic stars are aligned against fixed income. It means that, if yields move up through 3%, taking the prices of many other bond sectors lower, investors considering where valuation support might lie will find little of substance in their favor.

We’re not forecasting that yields will move sharply higher — but we are noting there’s nothing fundamentally attractive about today’s levels. Bear in mind also that few FOMC members can be regarded as inflation “hawks” (does anybody even remember the term?). They’ve been dovish, correctly, for years. If inflation does surprise to the upside, bond investors may need some visible reassurance from new FOMC Chair Jerome Powell that he possesses “inflation-fighting credentials”. Earning such credibility would require raising short term rates even higher.

In September, ten year yields were close to 2% before beginning their current ascent. The last time we saw a 2% increase in yields (i.e. what it would take to return to 4%, approaching long term fair value) was in 1999, when technology stocks were leading us into the dot.com boom and subsequent bust. A generation of market participants has not experienced a real fixed income bear market. As a retired bond trader friend of mine says, when you add all these factors up, for bond prices “Down’s a Long Way”.

Unlike fixed income, energy infrastructure does offer solid valuation support. Moreover, the correlation with bond yields is historically low and likely to remain that way. Few MLP investors expect stable, boring returns anymore and rising GDP growth is good for energy demand. Selling bonds that are substantially above fair value and switching into undervalued energy infrastructure aligns with the macro forces currently at work.

The American Energy Independence Index (AEITR) finished the week -6.5%. Since the November 29th low in the sector, the AEITR has rebounded 7.6%.

ETFs and Behavioral Finance

There are over three million stock indices in the world, more than 70 times as many as actual stocks. Before learning this startling fact in the FT the other day, I might have guessed wildly at 1% of this figure, thinking it way too high.

Although the growth in Exchange Traded Funds (ETFs) is not solely responsible for this index explosion, it’s certainly helped. The move away from active management has spurred the creation of indices into which passive funds can invest. At SL Advisors we recently made our own modest contribution to this thee million number by launching the investable American Energy Independence Index, in partnership with S&P Dow Jones Indices. Launching an index involves substantial work, but unlike an IPO there’s no 6% underwriting fee. Starting an index is cheaper than floating a stock.

The Shale Revolution has transformed America’s term of trade in energy, and created substantial opportunities for the infrastructure businesses who will help us towards Energy Independence. We identified a gap in the marketplace, since none of the available investment products offer exposure to this theme. A new index and associated ETF soon followed.

So it was that your blogger was at the Inside ETFs conference in Hollywood, FL last week. It’s an enormous event with (so we were told) a record 2,300 attendees. It’s a tangible measure of the growth in ETFs, marked by the S&P500 ETF (SPY) conveniently breaching the $300BN market capitalization threshold. The global ETF industry is over $4TN.

Non-investment luminaries such as Serena Williams and General Stan McChrystal added star power to the long list of finance experts giving presentations all day. We didn’t see any of them, because Inside ETFs is an enormous networking event. It’s become the can’t miss date of the year for everybody in the industry. Meetings with business partners and clients took up much of our planned schedule before arriving, and unexpected encounters filled the rest. You really can sit in the convention center lobby and enjoy serial, chance meetings with familiar faces.

The chatter is of success; of funds that generated strong early returns and have grown quickly. Of hot areas (Smart Beta), and underserved sector (European fixed income, believe it or not). It is Behavioral Finance in action. Positive results generate confidence, attracting more assets and more confidence. The winners keep winning. There’s no care for the unloved ETF. Efficient markets proponents hold that there ought to be no serial correlation in returns – in other words, no momentum. Prices reflect all available information, so short term moves are random. In the real world, rising prices attract more buyers, and falling prices draw more selling. This is why markets exhibit momentum, because like-minded people congregate to create a positive feedback loop.

Energy infrastructure endured the inverse of this for much of last year, as the growing divergence against almost all other sectors became self-reinforcing. Until late November, when the last frustrated tax-loss sellers exited stage left, signaling the beginning of a new trend.

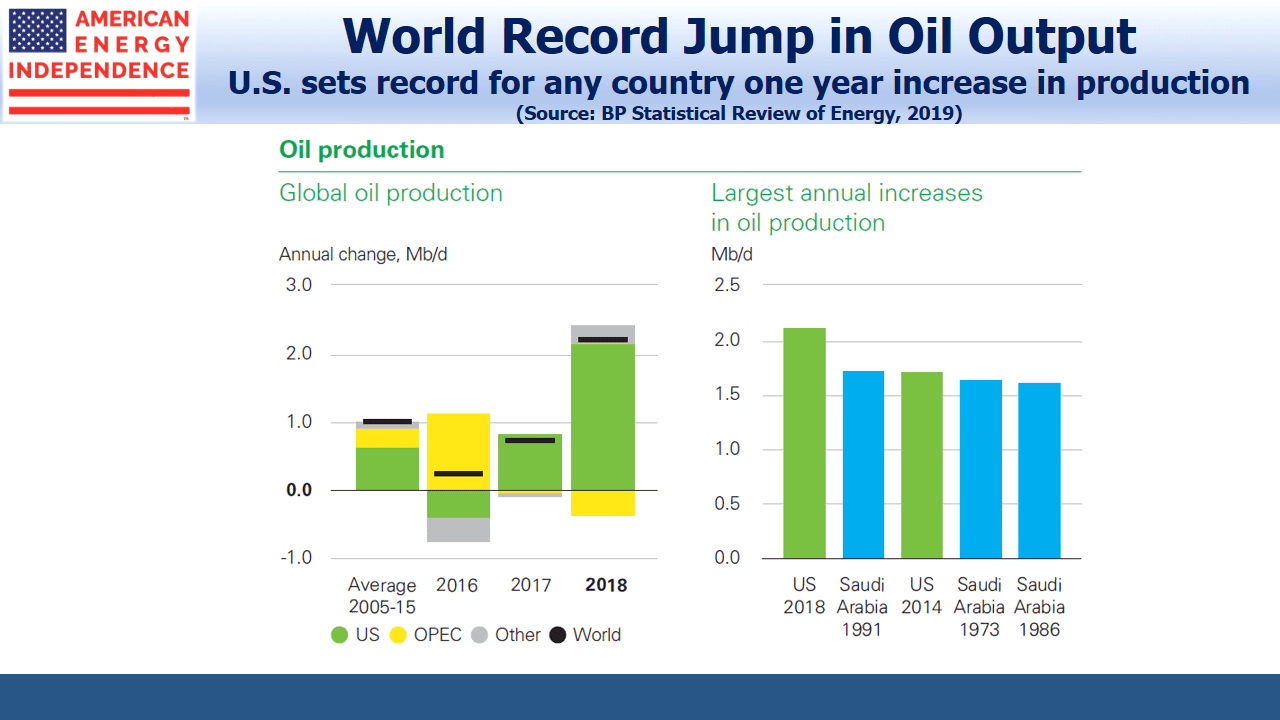
In other news, U.S. crude output is set to reach an all-time record in 2018. You’d think it’d be hard to turn this into bad news, unless you’re a Russian oil producer/ But apparently there is a Dark Side of America’s Rise to Oil Superpower, according to Bloomberg BusinessWeek. Problems include the high quality of shale oil, which is lighter than the heavy crudes it’s displacing from countries such as Venezuela. This means it needs less refining. Although refineries may find certain expensively built processes no longer needed, ultimately producing refined products from it is cheaper. This is bad? Sounds like fake news; maybe the Russians planted the story.

The investable American Energy Independence Index (AEITR) finished the week +2.0%. Since the November 29th low in the sector, the AEITR has rebounded 15.0%.


AMLP’s Tax Bondage

Tax Freedom Day is that point in the year when you’ve figuratively earned enough to pay all your taxes. For the rest of the year you can feel as if your income is your own. Naturally, it can never come soon enough. Investors in the hopelessly tax-burdened ETF, the Alerian MLP Fund (AMLP) face the contrary prospect: the point at which their investment returns are taxed at the fund level before anything is paid out. If the opposite of freedom is bondage. AMLP investors recently passed Tax Bondage Day.

This comes about because AMLP is not a conventional ETF, but is a tax-paying C-corp. Anecdotally, it’s clear few investors realize this, because most ETF’s are RIC-compliant and therefore not taxable at the fund level. Conventionally, you don’t stop to consider whether the ETF you own is taxed like a corporation. But AMLP is a C-corp, paying taxes on its earnings before paying out what’s left to holders.

The weakness in energy infrastructure last year wiped out unrealized gains for AMLP and many other tax-burdened MLP funds. Since you don’t owe taxes on losses, AMLP’s Deferred Tax Liability (DTL) was eliminated. However, the sector has been recovering since late November, and probably the only negative consequence of the rebound is that AMLP now has unrealized gains once more. Therefore, it has begun to owe corporate taxes again. As of January 16th it owed $93MM, a cost in addition to and approximately equal to their annual management fee. As the market rises, so will their DTL.

You can find further detail on this issue from past blogs. Hedging MLPs explained how AMLP is useful as short position, because the tax drag will limit its appreciation to 79% of the market’s whereas it can still fall 100% of the market. Some MLP Investors Get Taxed Twice and Are You in the Wrong MLP Fund both examine the implications of a tax-paying C-corp for investors.

The reduced corporate tax rate means the tax drag is less than it used to be – and it’s been substantial. Since inception, AMLP has returned less than half its benchmark, largely because of tax expense. The reduced corporate tax rate will help, but it’ll still represent a serious drag on returns. Many investors are expecting strong performance over the next couple of years. Valuations are attractive, and energy lagged the market substantially in 2017. Seeing your fund hand over 21% of a double digit return before paying distributions will represent a substantial cost, and an unnecessary one because there are correctly structured energy infrastructure ETFs around that aren’t subject to corporate tax. It is possible to invest in the sector via a RIC-compliant vehicle.

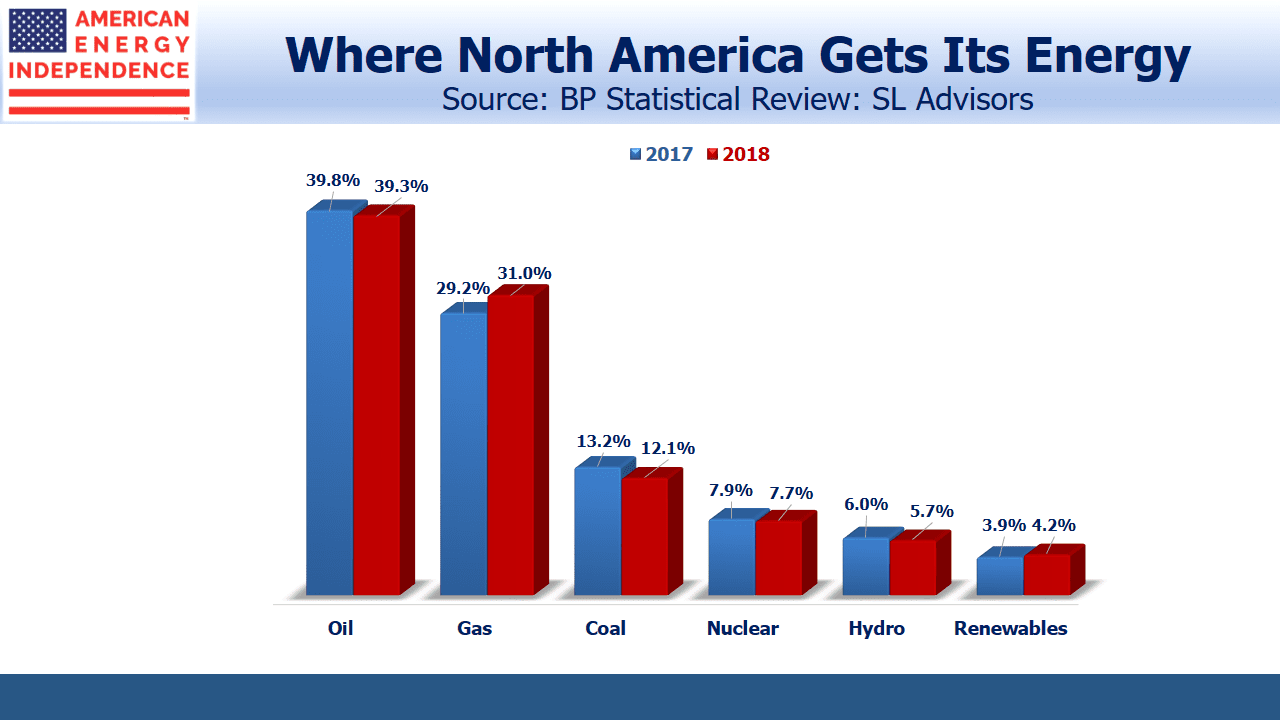
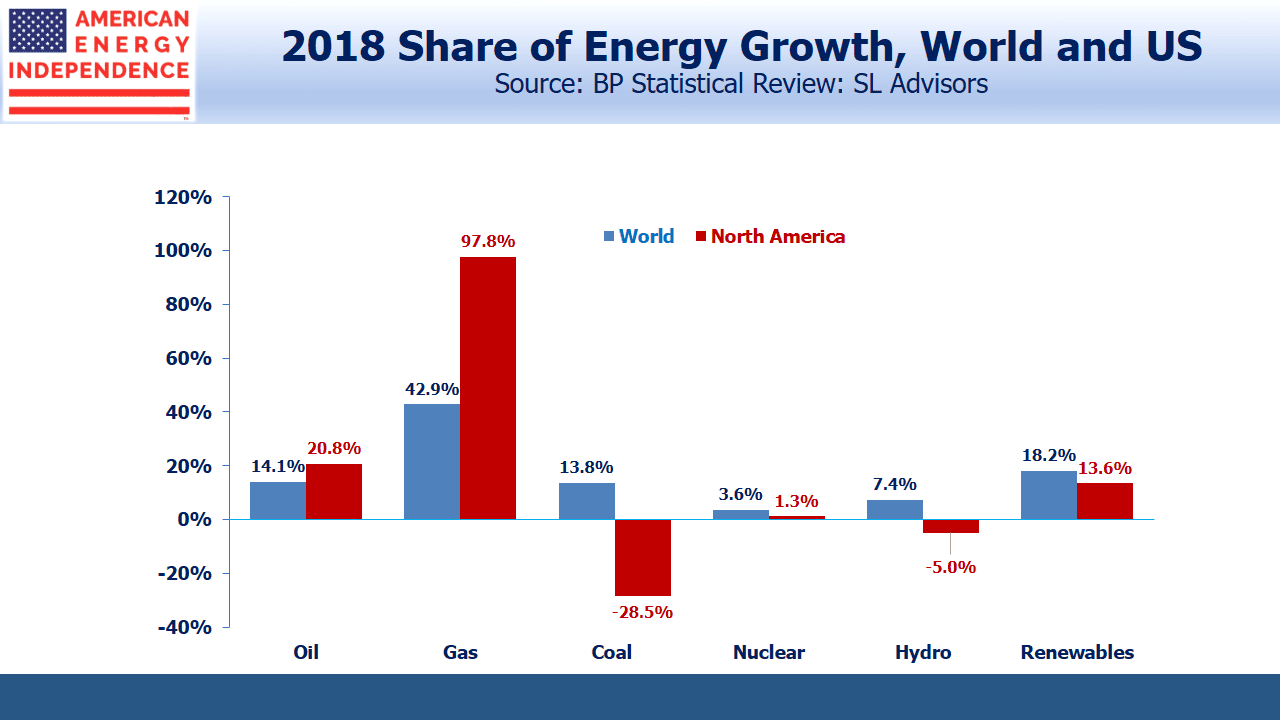
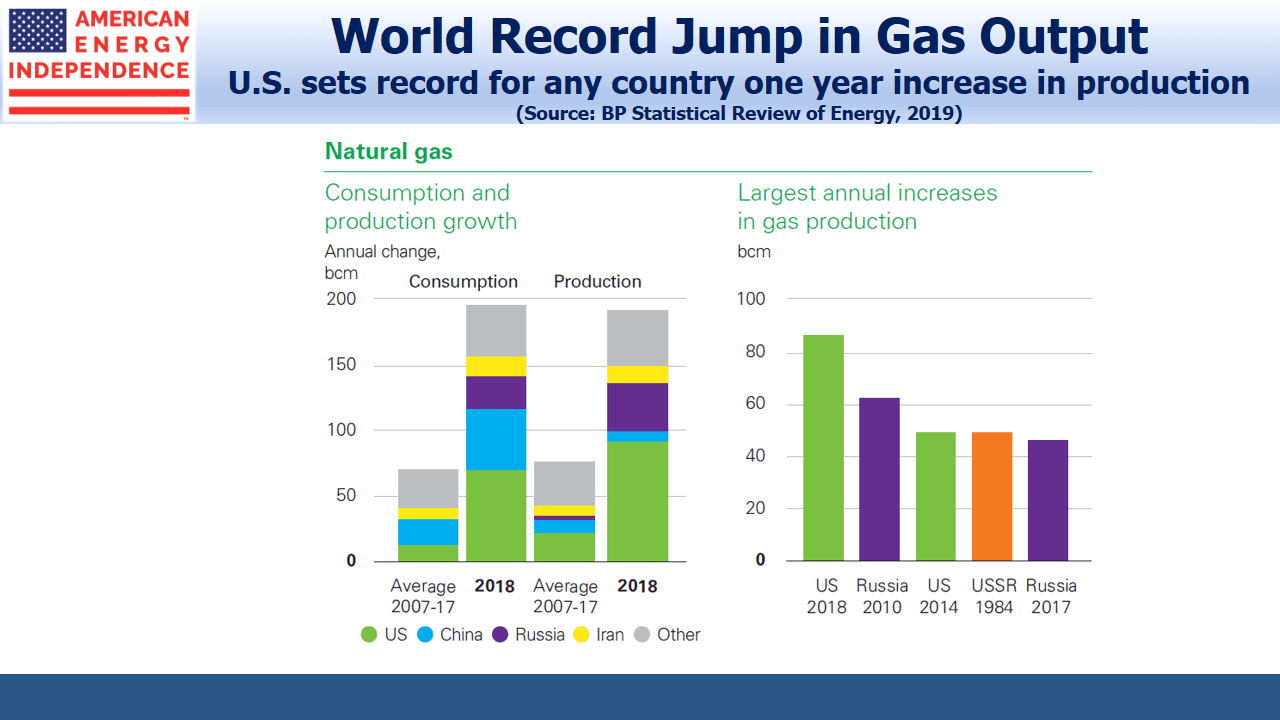
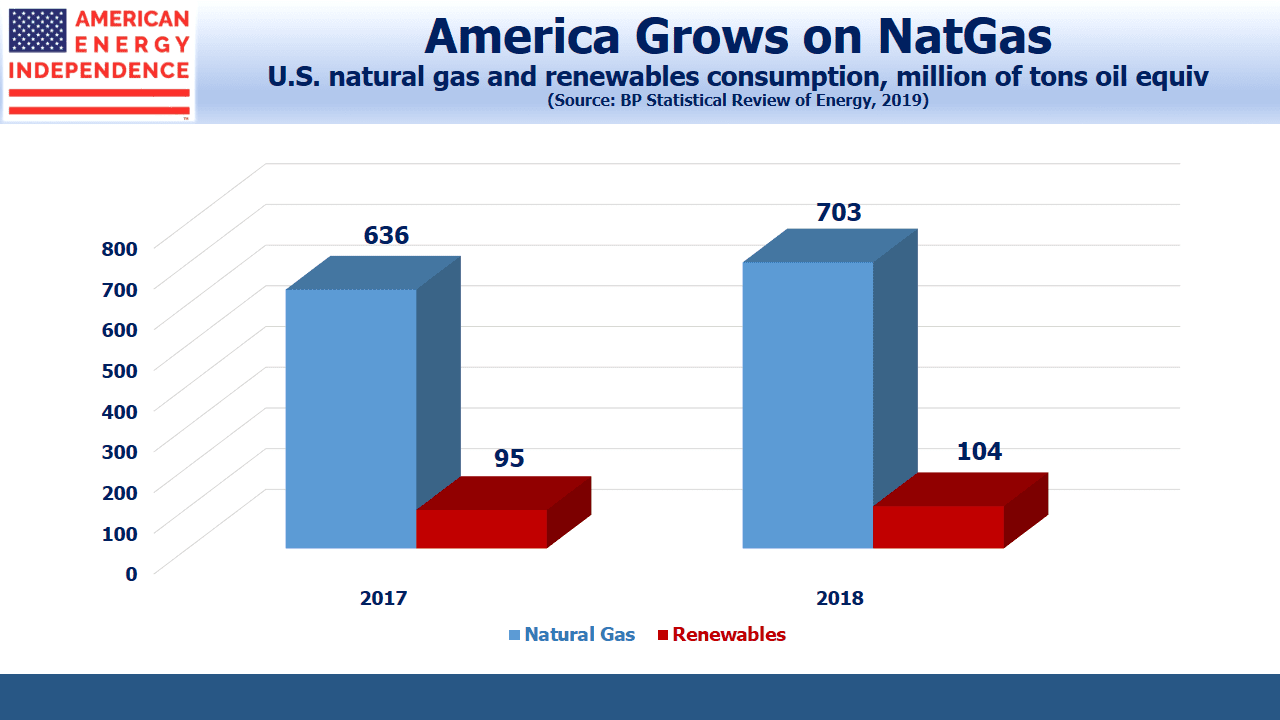
On a different topic, the U.S. Energy Information Administration confirmed its forecast of record hydrocarbon production in 2018. Natural gas and natural gas liquids broke records in prior years, but this year crude oil production will also breach a previous high. Moreover, the mix of hydrocarbons should please almost everybody because it’s moving heavily away from coal and towards cleaner-burning natural gas. America’s emissions are moving in a better direction, thanks to the Shale Revolution.

The investable American Energy Independence Index (AEITR) finished the week -1.5%. Since the November 29th low in the sector, the AEITR has rebounded 12.8%.

We are short AMLP

Rising Rates and MLPs: Not What You Think

Five years ago my book Bonds Are Not Forever; The Crisis Facing Fixed Income Investors argued that interest rates were likely to stay lower for longer. Excessive debt led to the 2008 Financial Crisis, and our thinking was that low rates were part of the necessary healing process, allowing the burden of debt to be managed down.

Rates have indeed remained low, helped by the Federal Reserve’s very measured steps to “normalize” the Federal Funds rate with periodic hikes. Most forecasters, including the rate-setting members of the Federal Open Market Committee, have consistently expected rates to rise faster than they have.

Nonetheless, ten year treasury yields have been drifting up and recently touched 2.6%. Unemployment remains very low if not yet inflationary. GDP growth and corporate profits are strong. The recent tax changes are fiscally stimulative. Bill Gross has declared that we’re in a bond bear market, and Jeffrey Gundlach sounds equally cautious. It’s likely that this will be an increasing topic of conversation among investors.

We have no view on the near-term direction of bond yields, beyond noting that current yields are too paltry to justify an investment. It’s been a long time since bonds looked attractive. As we noted in our 2017 Year-end Review and Outlook, interest rates are what make stocks attractive. The Equity Risk Premium (S&P500 earnings yield minus the yield on ten year treasury notes) favors stocks, but if rates rose 2% bonds would offer meaningful competition. Although a 4-4.5% ten year treasury yield is a long way off, the historic real return (i.e. yield minus inflation) going back to 1928 is 1.9%.  So 2% above an inflation rate of 2% that’s rising wouldn’t be historically out of line.

Energy infrastructure investors will begin considering how rising rates might affect the sector. Traditionally, MLPs were categorized as an income-generating asset class along with REITs and Utilities. Rising bond yields have in the past represented a headwind for all these sectors, although MLP cashflows are not that sensitive to rate movements. Debt is predominantly fixed rate, and certain elements of the business, such as pipelines that cross state lines, operate under highly regulated tariffs which include annual inflation-linked increases.

Fairweather Friends

But energy infrastructure has undergone substantial changes over the past three years. Although yields are historically attractive, the volatility of 2015-16 was inconsistent with the stable, income-generating asset class investors had sought. As we’ve noted before (see The Changing MLP Investor), the Shale Revolution created growth opportunities that upset the business model and led many MLPs to “simplify,” their structure, which in practice meant they cut distributions in order to finance new investments. Consequently, the path of U.S. hydrocarbon production growth is more important than in the past.

The long term relationship between MLPs and treasury yields is not a stable one. The correlation between rate changes and MLP returns has fluctuated over the years, reflecting that there’s a weak economic connection between the two. Initial moves up in rates have often led to short term weakness in energy infrastructure, probably due to competing fund flows as noted above with REITs and Utilities. However, recent bond market weakness has led to the opposite result. The correlation is becoming negative.

This is likely because the strengthening economy, which is driving up rates, is improving the outlook for the energy sector as well. Energy infrastructure is more sensitive to volume growth, since this increases capacity utilization of existing facilities as well as the likelihood of further growth. A stronger economy will, at the margin, consume more energy. The 12 month rolling correlation (through December 2017) is the most negative it’s been since the sector peaked in August 2014. In January this relationship has persisted, with rates and MLPs both moving higher. So far, the economic forces that are causing weaker bond prices have been positive for energy infrastructure.

The investable American Energy Independence Index (AEITR) finished the week +1.9%. Since the November 29th low in the sector, the AEITR has rebounded 13.9%.


An Expensive, Greenish Energy Strategy

Most of the U.S. has been unseasonably cold – enduring twelve consecutive days of sub-freezing highs in New Jersey while owning a home in SW Florida is your blogger’s self-inflicted wound. The pain is only slightly ameliorated by news of record natural gas consumption of over 140 Billion Cubic Feet (BCF), almost twice the annual daily average.

You’d think that would be enough to satisfy demand, but the extended cold weather has exposed gaps in New England’s energy strategy. The region’s desire to increase its use of natural gas for electricity production is not matched by enthusiasm for infrastructure to get it there. Consequently, prices reached $35 per Thousand Cubic Feet (MCF) recently, roughly ten times the benchmark. Even at that price sufficient quantities weren’t available where needed, with the consequence that burning oil was the biggest source of electricity generation during this period.

In many cases, environmentalists’ views on natural gas are self-defeating. As a replacement for coal it surely reduces harmful emissions, and the widespread switching of coal-burning power plants for gas-burning ones represents a great success for environmentalists — for all of us. U.S. electricity generation is cleaner than in Germany (see It’s Not Easy Being Green). The New England Independent System Operator (ISO) has increased natural gas usage from 15% of electricity generation in 2000 to where it’s the most used fuel (other than very recently).  They correctly note that natural gas supports increased use of renewables, since wind and solar power are intermittent.

It should be a good story, except that the ISO’s increasing reliance on natural gas is opposed by environmentalists blocking the necessary additional infrastructure. In the last couple of years Kinder Morgan (KMI) and Enbridge (ENB) both cancelled projects that would have improved natural gas distribution and storage in the region. This was because of adverse court rulings, and regulations that dis-incentivize utility customers from making the necessary long term purchase commitments, without which infrastructure doesn’t get built.

As well as enduring the highest natural gas prices in the country, Massachusetts also imports Liquified Natural Gas (LNG). New England relies on LNG for 20-40% of its natural gas needs during winter. The Jones Act is a Federal law which requires intra-U.S. shipping to be carried out on U.S. owned, built and crewed ships. It’s expensive, and although this point is not the fault of Massachusetts, it means they’re importing LNG from Trinidad, even though the U.S. exports some of the cheapest LNG in the world. There’s little natural gas storage in the region, because the geology doesn’t support underground storage and opponents have prevented construction of above-ground facilities. Consequently, LNG is imported to Boston when needed in the winter, as long as a winter storm doesn’t disrupt shipping.

The high prices for natural gas in New England aren’t the only problem though. The recent jump in oil use for electricity generation is hardly consistent with lowering emissions. Meanwhile, New England’s ISO is warning that infrastructure development is inadequate, which risks the reliability of the electricity supply and in extreme cases may result in “controlled power outages”. The U.S. Bureau of Labor Statistics reported that in November 2017 the Boston area paid 57% more for electricity than the U.S. average, compared with only 28% more five years ago. It’s not just a winter problem. For 2017 (through November) Boston prices were 175% of the national average. New England is a wonderful region of the U.S., but its residents are poorly served by a dysfunctional energy strategy.

On a different topic, global auto sales exceeded 90 million units for the first time last year. China was 25% of the total. 2018 is likely to be another record. This is why the International Energy Agency is forecasting a 1.3% increase in crude oil demand this year.

The investable American Energy Independence Index (AEITR) finished the week +2.7%. Since the November 29th low in the sector, the AEITR has rebounded 12.4%. For most of 2017 the strength in Utilities contrasted with energy infrastructure weakness. However, this relationship has sharply reversed, with the Utilities Sector SPDR ETF (XLU) falling 9.3% since the late November low in AEITR. In mid-November we highlighted the poor relative valuation of the Utility sector (see Why the Shale Revolution Hasn’t Yet Helped MLPs). As the Administration announced plans to open up most of the offshore U.S. for oil and gas exploration, Interior Secretary Ryan Zinke declared, “We’re going to become the strongest energy superpower.”

We are invested in ENB, LNG and KMI.

image_pdfimage_print