REITS: Pipeline Dividends Got You Beat
Long time MLP investors fondly recall the days before the Shale Revolution, when yield comparisons with REITs and Utilities made sense. This ended in 2014, when the energy sector peaked. Cumulative distribution cuts of 34%, as subsequently experienced by investors in the Alerian MLP ETF (AMLP), convinced income seeking investors that pipelines were a hostile environment.
During the 2014-16 collapse in crude oil, yield spreads on energy infrastructure blew out compared with sectors that were formerly peers. It might be the only period in history when companies have slashed distributions primarily to fund growth opportunities, and not because of an operating slump (see It’s the Distributions, Stupid!)
Several months ago, Bank of America published this chart showing that EBITDA for the sector grew steadily through the energy collapse, and leverage came down. Persistent weakness in the sector can best be explained by the betrayal of income-seeking investors. Distribution cuts were unacceptable to many, regardless of the reasons.
2019 should be the first year since crude oil bottomed at $26 per barrel that payouts will be rising (see Pipeline Dividends Are Heading Up). Because falling distributions are so clearly the reason the sector has remained out of favor, increasing payouts could provide the catalyst that will drive a strong recovery.
Income-seeking investors who return to the pipeline sector will find much to like. Funds From Operations (FFO) is a commonly used metric for REITs. It measures the net cash return from existing assets. The analogous figure for energy infrastructure businesses is Distributable Cash Flow (DCF).
We’ve found that comparing pipelines with real estate resonates with many readers. Differentiating between cash earned from existing assets and cash left over after investing in new assets is intuitive when applied to an owner of buildings.
As we showed in Valuing Pipelines like Real Estate, looking at Free Cash Flow (FCF), or net cash generated after new initiatives, doesn’t present an accurate picture if a company is investing heavily. And because dividends have been declining, it’s been hard for investors to get comfortable that current payouts are secure. Since neither FCF nor dividend yields have been enticing, capital has often avoided the sector.
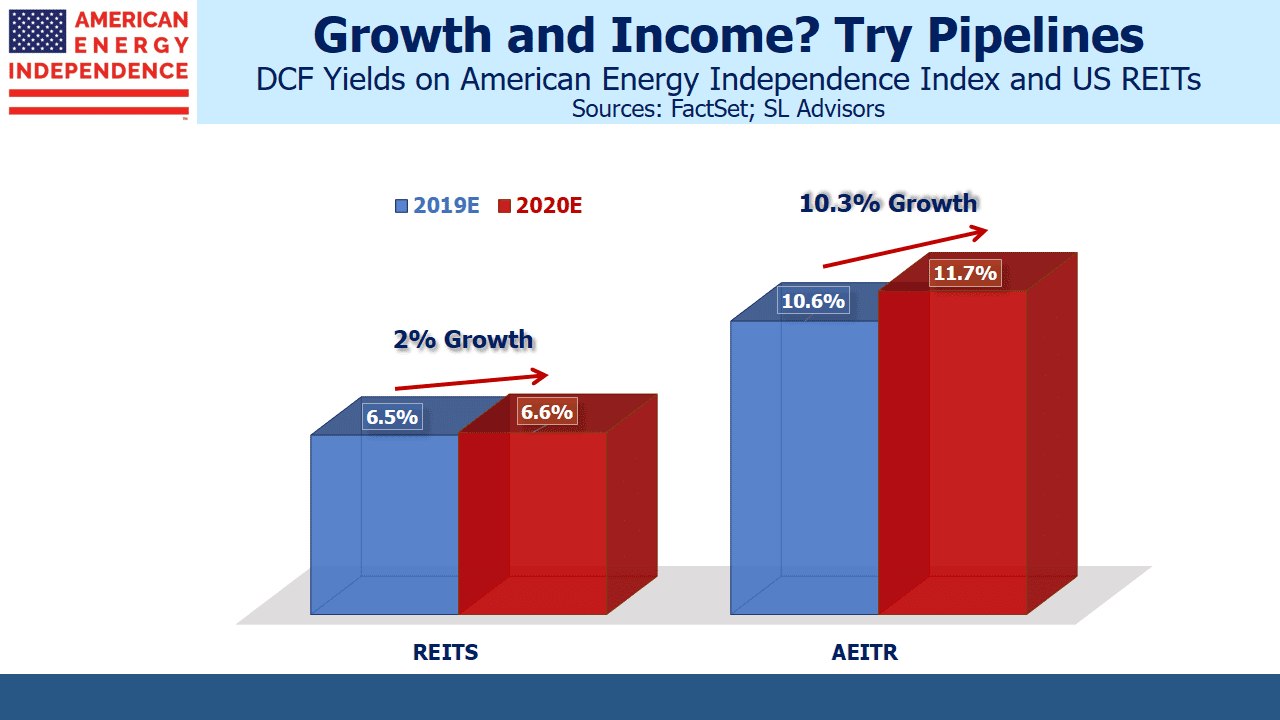
MLPs commonly paid out 90% or more of their DCF in distributions, which left too little cash to fund the growth projects brought on by the Shale Revolution. Attractive DCF yields drew scant attention when payouts were declining, but a consequence of the sector’s loss of favor is that 2019 DCF yields are two thirds higher than for REITs.
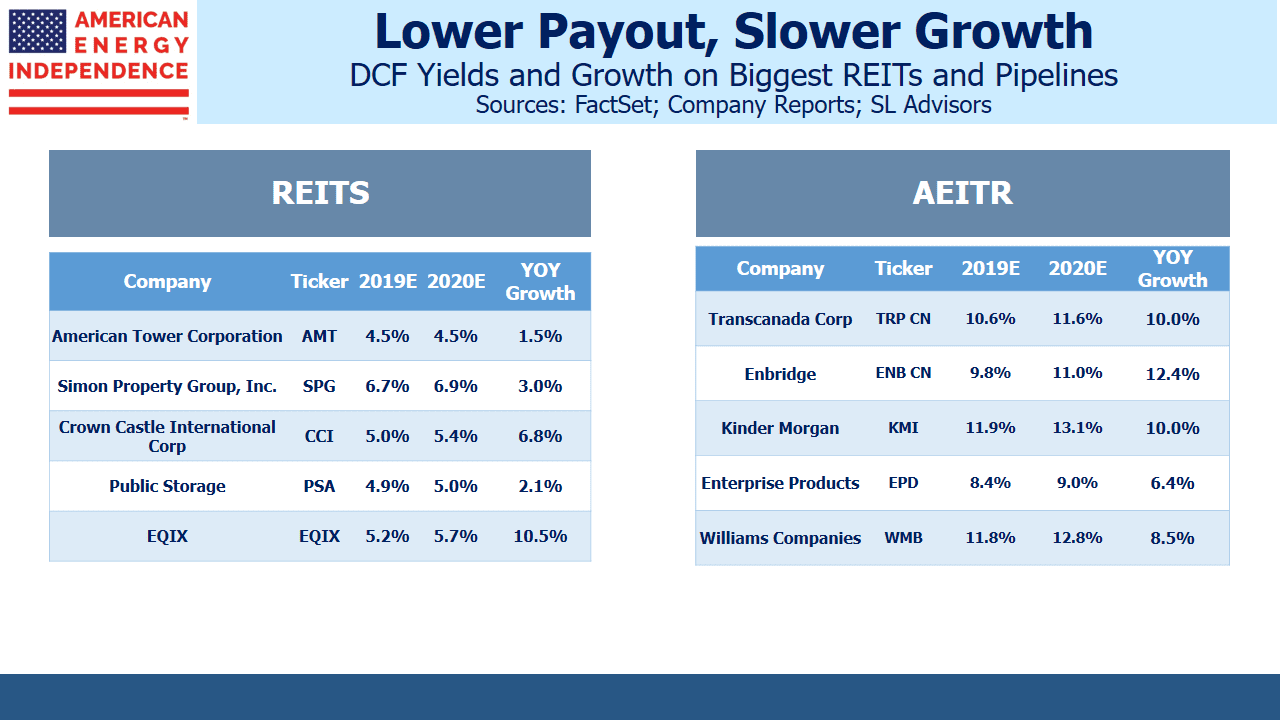
Moreover, they’re set to grow faster. U.S. REIT investors can expect only 2% growth in FFO on a market-cap weighted basis (data from FactSet). We expect 2020 DCF for the American Energy Independence Index to jump by 10.3%. Improving cash flow supports rising dividends, which we expect will be up 10% this year and next (see Income Investors Should Return to Pipelines in 2019).
Much of this is the result of growth projects being placed into production. A pipeline doesn’t generate any cash until it’s completed, so virtually all the expenditure occurs up front. MLP investors suffered the distribution cuts necessary to help fund this – we’re now starting to see the uplift to cashflows. It’s further helped by a likely peak in growth expenditures (see Buybacks: Why Pipeline Companies Should Invest in Themselves, chart #4).
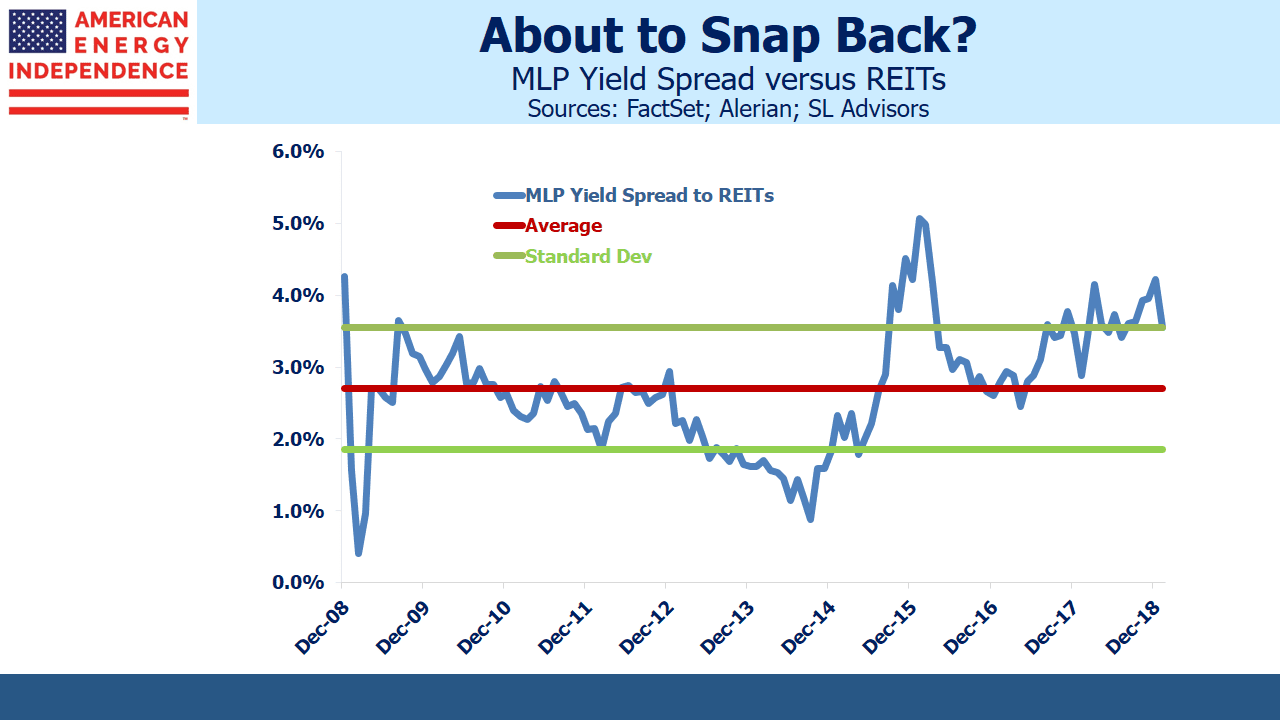
Once REIT investors return to comparing their holdings with energy infrastructure, they’re going to find strong arguments in favor of switching. They’ll find they can upgrade both their income and growth prospects by moving their REIT holdings into pipelines. MLP yields are historically wide compared with REITs, and 85% of the last decade the relationship has been tighter. Just remember to invest in broad energy infrastructure and not to limit your investment to MLPs (see The Uncertain Future of MLP-Dedicated Funds). Four of the five biggest pipeline companies are corporations, not MLPs, which nowadays represent less than half the sector.
The Shale Revolution is a fantastic American success story. The Energy Information Administration expects U.S. crude oil output to reach 13 million barrels per day (MMB/D) next year. The U.S. continues to gain market share. It’s estimated that Saudi Arabia needs a price of at least $80 per barrel to finance their government spending. To this end, the Saudis are cutting production to below 10 MMB/D. They’re slowly ceding market share in the interests of higher revenues.
Investors have little to show for allocating capital towards the Shale Revolution. That is about to change. The American Energy Independence Index is up 18% so far this year, easily beating the S&P500 which is up 10%. The sector is starting to feel the love.
Join us on Friday, February 22nd at 2pm EST for a webinar. We’ll be discussing the outlook for U.S. energy infrastructure. The sector has frustrated investors for the past two years, but there are reasons to believe improved returns are ahead. We’ll explain why. To register please click here.
We are short AMLP.
SL Advisors is the sub-advisor to the Catalyst MLP & Infrastructure Fund. To learn more about the Fund, please click here.
SL Advisors is also the advisor to an ETF (USAIETF.com)
Important Disclosures
The information provided is for informational purposes only and investors should determine for themselves whether a particular service, security or product is suitable for their investment needs. The information contained herein is not complete, may not be current, is subject to change, and is subject to, and qualified in its entirety by, the more complete disclosures, risk factors and other terms that are contained in the disclosure, prospectus, and offering. Certain information herein has been obtained from third party sources and, although believed to be reliable, has not been independently verified and its accuracy or completeness cannot be guaranteed. No representation is made with respect to the accuracy, completeness or timeliness of this information. Nothing provided on this site constitutes tax advice. Individuals should seek the advice of their own tax advisor for specific information regarding tax consequences of investments. Investments in securities entail risk and are not suitable for all investors. This site is not a recommendation nor an offer to sell (or solicitation of an offer to buy) securities in the United States or in any other jurisdiction.
References to indexes and benchmarks are hypothetical illustrations of aggregate returns and do not reflect the performance of any actual investment. Investors cannot invest in an index and do not reflect the deduction of the advisor’s fees or other trading expenses. There can be no assurance that current investments will be profitable. Actual realized returns will depend on, among other factors, the value of assets and market conditions at the time of disposition, any related transaction costs, and the timing of the purchase. Indexes and benchmarks may not directly correlate or only partially relate to portfolios managed by SL Advisors as they have different underlying investments and may use different strategies or have different objectives than portfolios managed by SL Advisors (e.g. The Alerian index is a group MLP securities in the oil and gas industries. Portfolios may not include the same investments that are included in the Alerian Index. The S & P Index does not directly relate to investment strategies managed by SL Advisers.)
This site may contain forward-looking statements relating to the objectives, opportunities, and the future performance of the U.S. market generally. Forward-looking statements may be identified by the use of such words as; “believe,” “expect,” “anticipate,” “should,” “planned,” “estimated,” “potential” and other similar terms. Examples of forward-looking statements include, but are not limited to, estimates with respect to financial condition, results of operations, and success or lack of success of any particular investment strategy. All are subject to various factors, including, but not limited to general and local economic conditions, changing levels of competition within certain industries and markets, changes in interest rates, changes in legislation or regulation, and other economic, competitive, governmental, regulatory and technological factors affecting a portfolio’s operations that could cause actual results to differ materially from projected results. Such statements are forward-looking in nature and involves a number of known and unknown risks, uncertainties and other factors, and accordingly, actual results may differ materially from those reflected or contemplated in such forward-looking statements. Prospective investors are cautioned not to place undue reliance on any forward-looking statements or examples. None of SL Advisors LLC or any of its affiliates or principals nor any other individual or entity assumes any obligation to update any forward-looking statements as a result of new information, subsequent events or any other circumstances. All statements made herein speak only as of the date that they were made. r
Certain hyperlinks or referenced websites on the Site, if any, are for your convenience and forward you to third parties’ websites, which generally are recognized by their top level domain name. Any descriptions of, references to, or links to other products, publications or services does not constitute an endorsement, authorization, sponsorship by or affiliation with SL Advisors LLC with respect to any linked site or its sponsor, unless expressly stated by SL Advisors LLC. Any such information, products or sites have not necessarily been reviewed by SL Advisors LLC and are provided or maintained by third parties over whom SL Advisors LLC exercise no control. SL Advisors LLC expressly disclaim any responsibility for the content, the accuracy of the information, and/or quality of products or services provided by or advertised on these third-party sites.
All investment strategies have the potential for profit or loss. Different types of investments involve varying degrees of risk, and there can be no assurance that any specific investment will be suitable or profitable for a client’s investment portfolio.
Past performance of the American Energy Independence Index is not indicative of future returns.


Leave a Reply
Want to join the discussion?Feel free to contribute!