Crude Climbs The Wall Of Supply Worries

SL Advisors Talks Markets
Crude Climbs The Wall Of Supply Worries
Loading
/

Crude oil has rallied recently, in a much delayed reaction to numerous analyst forecasts that have been bullish all year. A couple of months ago Goldman’s commodities head Jeff Currie, who is leaving the bank, cut his year-end forecast for Brent crude from $95 per barrel to $86 while maintaining his long term bullish outlook. He blamed ongoing releases from the US Strategic Petroleum Reserve (SPR) and “a more discerning approach to sanctioned oil,” meaning that Iran and Russia are exporting more than he expected.

Currie and other analysts have maintained a bullish long term outlook because they see a growing supply-demand imbalance. This has been delayed by the issues mentioned above, but there are signs that crude is entering a sustained uptrend.

Sales from the SPR have weighed on prices. Last year the Administration released crude oil prior to the midterms, leading to criticism that they were cynically risking our energy security in a short-term effort to buy votes. While this was likely the motivation, sales have continued and the SPR is at its lowest level in forty years.

The US consumes about 20 Million Barrels per Day (MMB/D) of crude oil and petroleum products, a figure that hasn’t changed much in over two decades. The sharp decline in the SPR means it covers just 17 days of consumption compared with the 30-40 days that was common for much of the SPR’s existence.

The 1975 Energy Policy and Conservation Act was passed in response to the 1973-74 OPEC oil embargo during the Yom Kippur War. America’s energy security is dramatically different nowadays, thanks to fracking and horizontal drilling. The White House is likely to dip into the SPR again in the run up to next year’s election. Doing so will be politically expedient, but perhaps we no longer need to keep oil in storage given our ready access to domestic supply.

OPEC+ has responded by limiting supply, since they want the highest price that can sustain current demand. OPEC expects global oil demand this year to set a new peak of 102.1 MMB/D and to rise further next year.

Meanwhile they see a growing supply shortfall, exacerbated by the Saudis and Russia extending their 1.3 MMB/D cut through year’s end. Other analysts agree.

The International Energy Agency (IEA) expects 2024 global oil demand growth less than half of OPEC’s. They see gasoline demand peaking over the next couple of years at 26.6 MMB/D as Electric Vehicles (EVs) continue to gain market share, especially in China. They see EV sales growing from 10.8 million last year to 25.9 million by 2028, at which point they’d represent more than a quarter of new car purchases. By then crude oil demand will be over 3 MMB/D lower than without EVs.

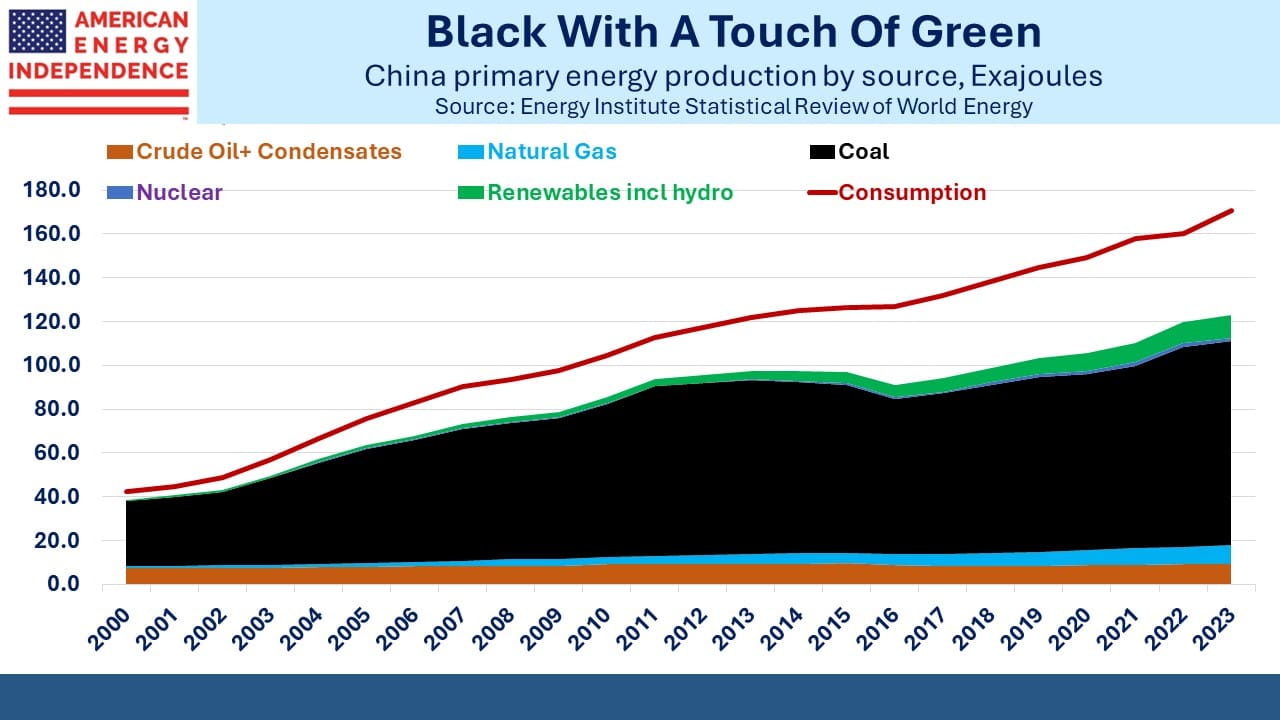
However, since China gets 60% of its total energy from coal and 71% of its electricity, the growth in EVs led by China hardly seems a cause for celebration. Given the greenhouse gas emissions and local pollution from coal, it’s quite possible the world would be better off if China stuck with internal combustion engines.

The Tesla owners I know love their cars, but they all have another conventional car for long trips. An Uber driver once told me that she was happy with the Tesla leased from the company but confessed to spending an hour recharging it in the middle of every day. EV sales have momentum, but I’m in no great rush to join. It’s bad enough worrying about recharging my iphone battery, never mind my wheels.

The IEA expects growth in jet fuel and petrochemicals (lubricants, solvents etc) will continue to push global oil demand higher at around a 1% annual rate. Nonetheless, they share the short term concern of others that low inventories, extended OPEC+ production cuts and increased demand from developing countries could push prices higher over the near term.

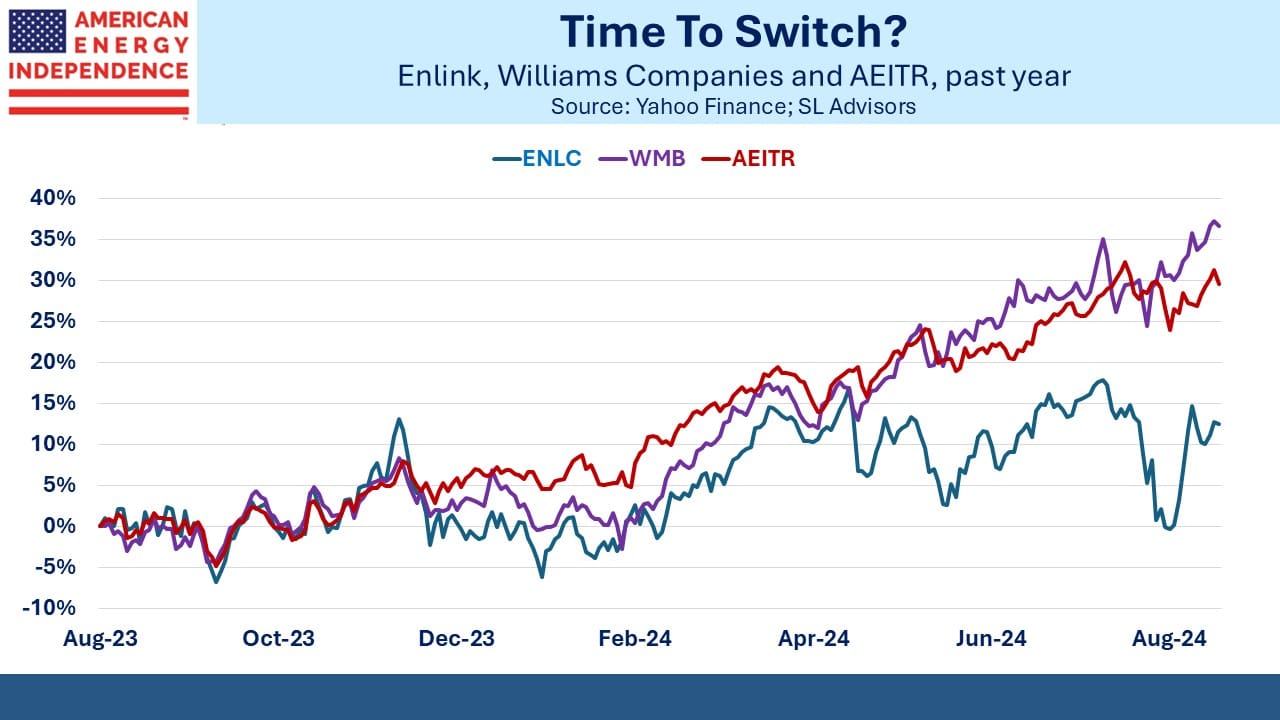
Discussion of the correlation between crude oil and midstream energy infrastructure is common when they’re both falling. We’ve written about this topic in the past. The relationship between pipeline stocks and commodities has been weak over the past couple of years (see Oil And Pipelines Less In Sync) However, over the last three months Brent crude has risen over $15 per barrel, coinciding with a run of market outperformance by the American Energy Independence Index (AEITR).

Pipeline companies are unlikely to revise earnings guidance, but there’s little doubt that this latest move shows sentiment towards the energy sector is improving. The fundamentals have been strong for a long time, so to us a rallying AEITR seems fully justified.

We three have funds that seek to profit from this environment:

Energy Mutual Fund Energy ETF Real Assets Fund


Pipelines Returning More Cash

SL Advisors Talks Markets
Pipelines Returning More Cash
Loading
/

The old MLP model rarely saw stock buybacks. Traditionally the General Partner (GP) would sell assets to the MLP it controlled in a non-arms-length transaction. The MLP would issue equity and debt to pay for them. MLPs were sellers of their own units, not buyers.

Today’s midstream energy infrastructure sector has left that model behind. Most companies are corporations and most have buyback programs in place. Of the names listed, 12 of 16 retired some stock last year and 14 are expected to do so this year.

The buyback yield (ie portion of outstanding shares repurchased) can be added to the dividend yield to give the total return to shareholders exclusive of price changes. By this measure, half the sixteen companies listed offer a return of 7.9% or greater, assuming they execute their buyback programs as JPMorgan projects through the remainder of the year.

This year’s median dividend yield + buyback yield of 7.9% is up from 7.4% last year, a 7% growth rate. Returns are increasing.

MLPs are repurchasing shares alongside their c-corp peers. Without a controlling GP poised to drop down assets they have more conventional growth capex opportunities of acquisitions and re-investing back in the business.

M&A activity has picked up recently, with Oneok’s (OKE) acquisition of Magellan Midstream (MMP) and Energy Transfer’s (ET) purchase of Crestwood. Investors worried that ET’s issuance of $2.7BN in equity to fund this purchase indicated that buybacks were a lower priority. But the company assuaged these fears with a presentation that earmarks up to 20% of distributable cash flow to buybacks once they’ve reduced their Debt:EBITDA ratio close to 4.0X.

The OKE/MMP deal looks likely to receive shareholder approval now that independent proxy firms Glass Lewis and ISS both recommended a yes vote.

The dealmaking reflects increased confidence in the sector’s outlook by management.

Many companies have revised up their 2023 EBITDA over the past year without seeing it reflected in stock price performance.

Valuations are still below where they were in 2019 before the pandemic, even though companies have de-risked by reducing leverage. Enterprise Value/EBITDA averaged 11.5X for the sector according to JPMorgan and is below 10.0X today. Leverage is coming down and dividends are growing. Capex remains well below the levels of 2018, partly because environmental extremists have turned the courts into a weapon against all kinds of infrastructure including renewables (see Windpower Faces A Tempest). This has helped improve free cash flow among pipeline companies.

Canada has similar problems. The TransMountain expansion from Alberta to British Columbia has quadrupled in cost since Kinder Morgan deftly sold it to the Canadian government in 2018. The ultimate tab might go even higher. Engineering difficulties have led the company to request a different route, but the indigenous community is opposed. Public hearings are scheduled, and the crude pipeline’s completion could be pushed back a further nine months to the end of next year. Unlike in the US, Canada’s native tribes never signed peace treaties with the European settlers. As a result they have greater legal rights including limited sovereignty over their land. Canadian construction projects often have to work around this, as TransMountain is having to.

Unexpected delays are common in pipeline projects, which is why it’s unattractive to build them. This makes the existing stock of infrastructure more valuable.

I used to think climate extremists were trying to put us out of business, but I have since developed a more subtle appreciation of their positive impact on free cash flow since there’s less spending on new pipeline construction.

Hug a climate protester and drive him to his next protest.

In spite of all these positives, after two very strong years the pipeline sector as represented by the American Energy Independence Index is lagging the broader market this year. It looks cheap to us.

US natural gas prices have been weak in recent months. Domestic demand isn’t growing fast enough to match production – the market needs more liquefaction capacity.

Fortunately, that’s coming. The US Energy Information Administration (EIA) expects gross LNG exports to reach 14 Billion Cubic Feet per Day (BCF/D) by the end of next year. The net may be smaller if Massachusetts imports LNG as they have in the past (see Why Staying Warm In Boston Will Cost You).

Based on projects under construction, we should be exporting 24 BCF/D by 2027, a doubling over five years. This will add upward pressure to cheap US prices and will enable other countries to reduce their use of coal for power generation.

The valuations, strong fundamentals and growth prospects make this one of the most overlooked sectors in the market.

We three have funds that seek to profit from this environment:

Energy Mutual Fund Energy ETF Real Assets Fund


Windpower Faces A Tempest

SL Advisors Talks Markets
Windpower Faces A Tempest
Loading
/

At the end of August Orsted, a Danish developer of wind turbines, announced they’d be delaying their first planned installation off the New Jersey coast until 2026. They blamed supply chain issues, interest rates and insufficient US Federal tax credits. The Federal government had only recently approved the project.

New Jersey Democrat governor Phil Murphy and the Democrat-controlled legislature are big proponents of the garden state switching to windpower. New Jersey has regrettably moved to the left in recent years, partly because Republican voters are leaving for southern states such as Florida.

But even though New Jersey is a solidly blue state, there is plenty of opposition to windpower along the Jersey shore, which tends to be more conservative. Cape May county, opposite which the wind turbines are planned, is both especially conservative and opposed. Turbines already in place are blamed for a jump in whale deaths although this is disputed. It’s also feared that they will spoil the view. Protect Our Coast NJ is adopting some tactics from the environmental extremists’ playbook in using court challenges to impose costly delays. Treasurer Frank Coyne said, “The objective is to hold them up and make the cost so overwhelming that they’ll go home.”

The cost of installing windpower is going up. Orsted said it may take a $2.3BN writedown on its US projects. New Jersey Democrats even passed legislation redirecting Federal tax credits from residents to Orsted in order to make the economics more appealing. The delay until 2026 means the project won’t be completed before Phil Murphy leaves office, casting further doubt over its ultimate viability. Orsted has said it considered abandoning the project but for now intends to proceed, which is likely to encourage opponents to keep up the pressure. So far they’ve invested $4BN in US offshore wind projects including Montauk point at the tip of Long Island, and Rhode Island. They plan to make a final investment decision on all three by early next year.

Orsted is not alone. Spain’s Iberdrola canceled a planned wind farm off the coast of Massachusetts. Sweden’s Vattenfall backed out of a project off the coast of Britain, citing cost inflation. Siemens is expected to lose up to $5BN in its wind turbine manufacturing unit.

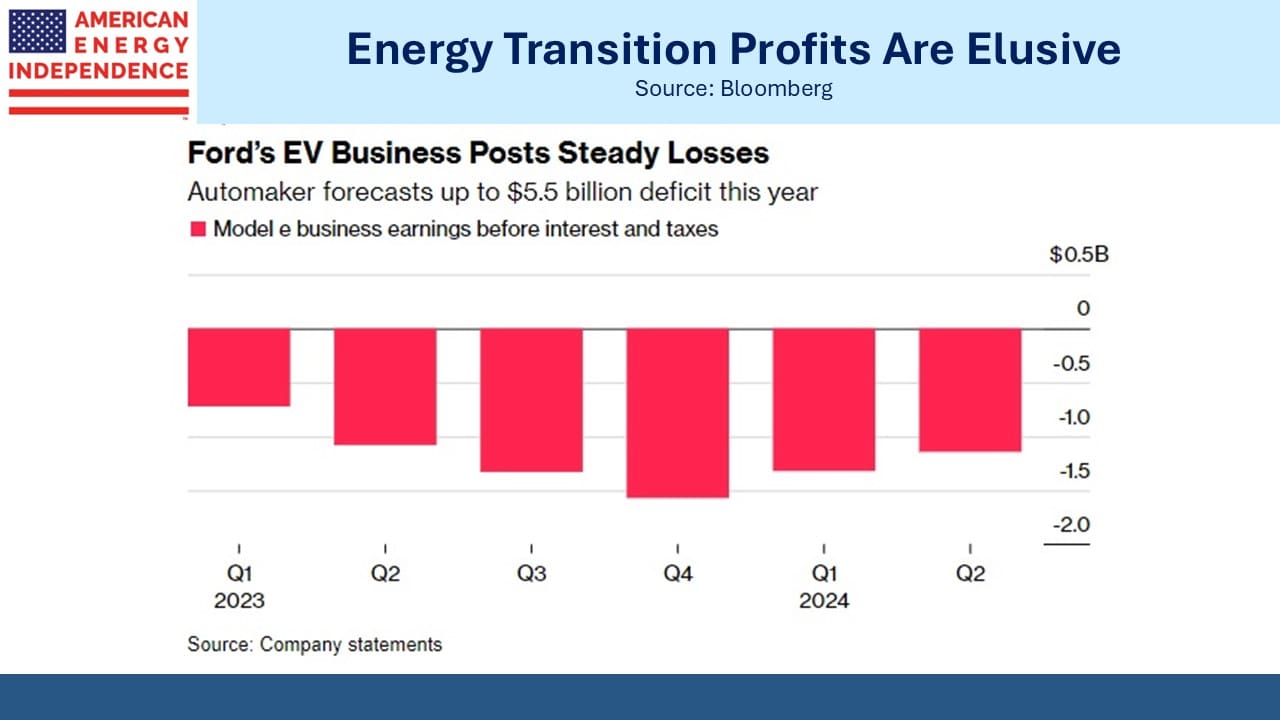
It’s tough to make money in renewables.

Then there’s NextEra Energy (NEE) and its MLP NextEra Energy Partners (NEP). NEE is “an industry-leading clean energy company” and is building its renewables capability as fast as it can. Four years ago we wondered if rapid depreciation in its asset base would ultimately hurt earnings (see Is NextEra Running in Place?). At the time the company was depreciating 5.5% of its Property, Plant and Equipment (PP&E), higher than other utility companies and suggesting a useful life of under twenty years.

Rapidly improving costs for renewables power generation cause older equipment to depreciate more quickly. And solar always faces the challenge that if a region is sunny enough a utility might find its customers investing in their own solar panels and batteries, disconnecting from the distribution network which means the fixed cost of transmission lines is spread across fewer users. It still doesn’t look like an appealing business to us.

NEE pulled ahead of the American Energy Independence Index (AEITR) for the next three years following our 2019 blog post, and its depreciation as a % of PP&E fell back to its peer group. In recent weeks it’s lagged and is now behind the AEITR over that time period. Over the past year NEE and NEP have substantially underperformed the AEITR.

An investor asked me last week what I thought of NEP. It is an old-fashioned MLP, with a controlling General Partner (GP) that can drop down assets. Midstream energy infrastructure, still known colloquially as the MLP sector, used to have many similar structures. The GP, in this case NEE, has a similar position to a hedge fund manager with respect to her hedge fund, in this case NEP.

When MLPs were controlled by a GP, we always favored the GP, just as you’d rather be the hedge fund manager rather than a hedge fund client. In 2012 I published The Hedge Fund Mirage: The Illusion of Big Money and Why It’s Too Good to Be True which revealed how investors had in aggregate done poorly in spite of hedge funds being wildly profitable, because fees had siphoned those returns over to the manager.

We recognized the analogy with MLPs and their GPs. NEE is NEP’s GP. They retain the old model but are in new energy. So we would avoid NEP and favor NEE because we always prefer the GP.

Nonetheless, it’s easy to see why both stocks look attractive especially if you want exposure to solar and wind. Within three years NEE is planning to have more renewable generation capacity than total installed capacity for any other US company. NEP is planning to sell its natural gas pipeline business and be 100% renewables.

NEP yields 7.6% and is guiding for 12% annual distribution growth. Its one year total return is –40%, probably dragged down by the challenges faced by Orsted and others.

NextEra’s wildly bullish outlook on renewables runs counter to the experience of the windpower manufacturers. They are a pureplay bet on renewables profitability, contrasting with writedowns being taken elsewhere in the industry.

It’ll be fascinating to see how this plays out.

We three have funds that seek to profit from this environment:

Energy Mutual Fund Energy ETF Real Assets Fund
 

Why Are Real Yields Rising?

SL Advisors Talks Markets
Why Are Real Yields Rising?
Loading
/

The members of the Federal Open Market Committee (FOMC) could be forgiven for feelings of quiet satisfaction. They’ve raised short term rates higher than most observers expected, and odds of the consequent recession have been receding. The increase in the unemployment rate to 3.8% on Friday leaves it still well below full employment. Yet inflation expectations remain well contained. The University of Michigan survey reports a five year outlook of 3%. Republicans (3.3%) are more pessimistic than Democrats (2.7%), but members of the White House’s incumbent party are generally more willing to think things will work out.

Inflation expectations from the bond market tell a similar story, with ten year inflation derived from TIPs at 2.3%. All this is consistent with a Personal Consumption Expenditures (PCE) deflator of 2%, since its construction means it tends to run a little lower than the CPI that most people rely on. Fed credibility remains intact.

But there’s always something to worry about. Because the ten year treasury yield has drifted up to 4.25% while the inflation outlook hasn’t changed, it means real yields have risen to almost 2%. As recently as eighteen months ago real yields were negative. The distorting effect of central banks and other return-insensitive investors was sufficient to guarantee a loss of purchasing power on buyers. The current 2% real yield is close to the long term real return on treasuries.

Near term SOFR futures have barely moved over the past few weeks. Contracts five years out and longer have borne most of the upward adjustment caused by the increase in treasury yields.

JPMorgan revised up their 3Q23 GDP forecast to 3.5%. A few months ago they were among those forecasting a mild recession by year’s end, something they no longer expect. Factset bottom-up earnings forecasts have started to edge higher. It’s just as well, because the Equity Risk Premium (ERP), defined here as the difference between the yields on S&P500 earnings and ten year treasuries, makes stocks look as expensive as at any time in the past two decades.

The corollary to an expensive equity market is that bonds are cheap. It’s not something you see often on this blog, but treasuries look more attractive relative to stocks than in a long time. We wouldn’t suggest switching, because the poor US fiscal outlook makes inflation a long-term risk and fixed income investments won’t offer much protection.

Interest expense on the US federal debt is forecast to more than double as a percentage of GDP over the next 25 years, according to the Congressional Budget Office. Publicly held debt will rise from 100% of GDP to 169% over the same period. One of the mysteries of finance is how long term US interest rates have maintained levels seemingly oblivious to our helpless profligacy. Thirty year bonds at 4.4% can only be justified by substantial demand from buyers willing to ignore that. As well as central banks, there are sovereign wealth funds with hundreds of $BNs to invest satisfied simply with the assurance of getting their money back. Add pension funds with inflexible mandates that continued to require a fixed income holding even when yields were below 1%.

Even US banks adopted the same behavior during QE, which is why Silicon Valley Bank failed and why the industry had $515BN in unrealized losses on securities in the first quarter, albeit with an improving trend since 3Q22.

However, there are signs that the appetite for bonds among those that care least about the return may be waning, which is allowing real yields to rise. Kevin Coldiron is a long-time friend and retired hedge fund manager who is now a finance lecturer at UC Berkeley and co-authored The Rise of Carry. Kevin writes thoughtfully on financial markets, and a recent blog post Inflation in the Twenty-First Century Part III: A Circular Flow No Longer addresses this issue.

For decades the US has run a trade deficit. In aggregate, this leaves the world’s exporters with more US$ than they need, and some of them get reinvested back into US treasuries. It’s often pointed out that a trade deficit requires financing by foreigners, through asset sales or debt issuance, because our exports don’t generate enough foreign currency to pay for our imports.

Kevin neatly displays this in the first of his two charts. But he goes on to suggest that this happy state of affairs may be ending. China is reducing its holdings of US treasuries. Perhaps the sanctions imposed on Russia following its invasion of Ukraine was a factor. A $1.1TN investment in US government bonds doesn’t look like a smart move for a country pledged at some point to reunify with Taiwan.

The Federal Reserve is also shrinking its balance sheet, albeit ponderously.

There’s little reason to expect real yields to stop rising. 2% is simply the long run average. It’s only high compared with the past few years. The factors causing China and the Fed to cut back will remain indefinitely. Maybe the bond market, which is far bigger now than in 1994 when Jim Carville famously said it could “intimidate everybody,” is about to command more of our attention.

We have three funds that seek to profit from this environment:

Energy Mutual Fund Energy ETF Real Assets Fund
 

The Growing LNG Trade

SL Advisors Talks Markets
The Growing LNG Trade
Loading
/

Nearly three years ago, French utility company Engie pulled out of negotiations with NextDecade (NEXT) to buy Liquefied Natural Gas (LNG). Concerns about leaks during the production of natural gas (methane) were the reason. Methane is a GreenHouse Gas (GHG) that is many times more potent than CO2 over a decade or so at trapping heat in the atmosphere. Over longer periods it decomposes, whereas CO2 remains for a century or more.  

Energy sector methane leaks are far from the biggest source. The International Energy Agency (IEA) estimates that natural gas related leaks are only 7% of the total. A third of methane emissions occur naturally in wetlands. Agriculture is responsible for a quarter, mostly from ruminants (cows and sheep) belching and farting. Several companies are developing a seaweed-based animal food additive that would alter the digestive process of such animals.  

Last year I met Steve Turner, CEO of Australian company Sea Forest at a wedding. Usually a Brit and an Aussie talk trash about each other’s national cricket teams upon meeting for the first time, but I quickly learned Steve’s company was turning asparagopsis into a solution to agricultural methane emissions (see How Seaweed Can Fight Global Warming). It’s an area worth following. 

Anyway, Engies’s conclusion in 2020 that US natural gas was harming the planet was a big setback for NEXT, which was trying to line up enough buyers of LNG from their planned Rio Grande terminal in Brownsville, TX to justify making a Final Investment Decision (FID) to go ahead. The company responded within a few months by launching NEXT Carbon Solutions to develop Carbon Capture and Storage (CCS) at Rio Grande. Recognizing the sensitivity of European buyers like Engie to the environmental impact of their product, they committed to provide “responsibly sourced gas” that is certified as being produced with minimal leaks, and to ensure their liquefaction process is GHG emission-free, by using a combination of renewable energy and CCS.   

NEXT negotiated agreements with other buyers to provide environmentally friendly gas. In April 2022 Engie returned and signed a 15 year deal for 1.9 Million Tonnes Per Annum (MTPA). Russia’s invasion of Ukraine dramatically changed Europe’s access to natural gas, but the changes NEXT had implemented addressed Engie’s earlier objections. FID on the Rio Grande LNG project came in July.  

Bechtel Energy has the contract to build the facility, having been Cheniere’s longtime construction partner for their Sabine Pass, LA and Corpus Christie, TX terminals. Recently Bechtel Energy’s President, Paul Marsden, and NEXT’s CEO Matt Schatzman, held a videotaped mutual lovefest during which each emphasized the climate-friendly features of the project. Climate extremists should be supportive, because by displacing coal in the world’s biggest emitters such as China and India, US LNG is a most effective counter to rising GHGs.  

NEXT’s FID in July was poorly received by the market because they were left with 20.8% of the economics in Trains 1-3 (Phase 1), less than the approximately one third investors had been led to expect. Global Infrastructure Partners and the sovereign wealth funds of Singapore and Abu Dhabi share 62.5% in exchange for $4.75BN of equity capital. France’s TotalEnergies took 16.7% in exchange for $1.1BN and a 20 year commitment to buy 5.8 MTPA. The $6.1BN in equity plus $11.8BN in debt financing makes Rio Grande Phase 1 the largest greenfield energy project financing in U.S. history. 

The modest 20.8% stake retained by NEXT looked as if they’d been out-negotiated.  

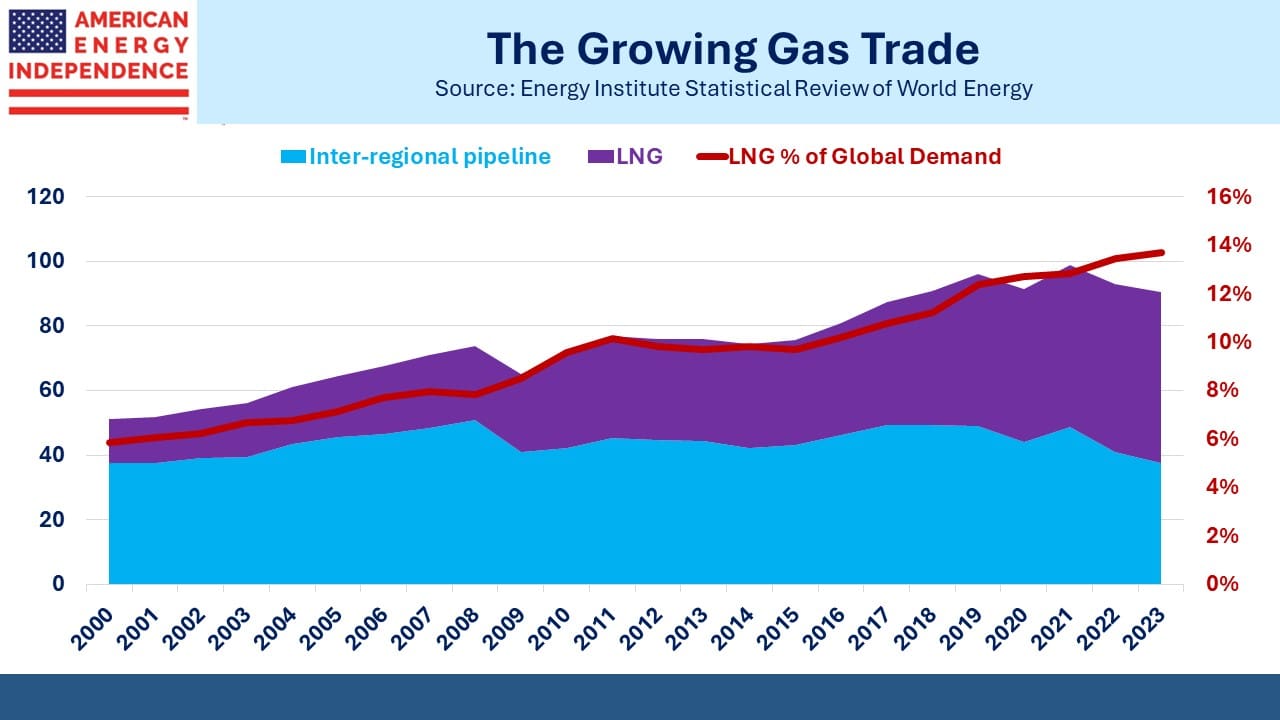
Global LNG demand is rising. Research firm ICIS Analytics expects the US to increase its market share from 22% to 31% over the next five years. Germany, the Philippines and Vietnam all began importing LNG for the first time earlier this year. More countries are expected to follow. The EU continues to buy LNG from Russia, as they try and impose sanctions that don’t drive energy prices up. Belgium and Spain are the world’s second and third-biggest importers of Russian LNG this year. They aim to stop completely by 2027. 

NEXT currently trades at the low end of the $6-8 per share valuation range sell side analysts ascribe for Phase 1. The upside potential for the stock relies on the completion of Trains 4-5 (Phase 2). The Rio Grande project is estimated to work out at $700-800 per tonne of capacity for 17.6 million tonnes per annum. Qatar’s expansion is estimated to cost $900 per tonne. Total’s Mozambique LNG project has faced many problems and is reported to cost $1,500.  

Rio Grande Phase 2 will benefit from the site preparation done for Phase 1, and as a result could cost under $500 per tonne. What’s unknown is what NEXT’s percentage ownership of Phase 2 will be. The market currently places minimal value if any on Phase 2. NEXT should be able to negotiate a much bigger stake, because Total already has an option on 32% of its capacity. Timing is uncertain, but the odds of Phase 2 ultimately going ahead look good to us. NEXT will be part of America’s increasing share of global LNG.  

We have three funds that seek to profit from this environment:

Energy Mutual Fund Energy ETF Real Assets Fund
 

Growth Is Gassy Not Oily

SL Advisors Talks Markets
Growth Is Gassy Not Oily
Loading
/

We’ve been critical of Magellan Midstream’s (MMP) proposed sale to Oneok (OKE) for months (see Oneok Does A Deal Nobody Needs), mostly because it forces MMP unitholders to pay taxes now that didn’t need paying and for some may never be paid. But we do agree with MMP CEO Aaron Milford that the growth opportunities in crude oil and refined products where they operate are not as attractive as in natural gas and natural gas liquids. Of course, MMP investors didn’t need him to sell the company because of that, anymore than a merger to create a more diversified business is justified. Investors can create their own diversification or high growth portfolio without M&A by management. But Milford’s not the only energy executive with the conviction that growth is more gassy and less oily.

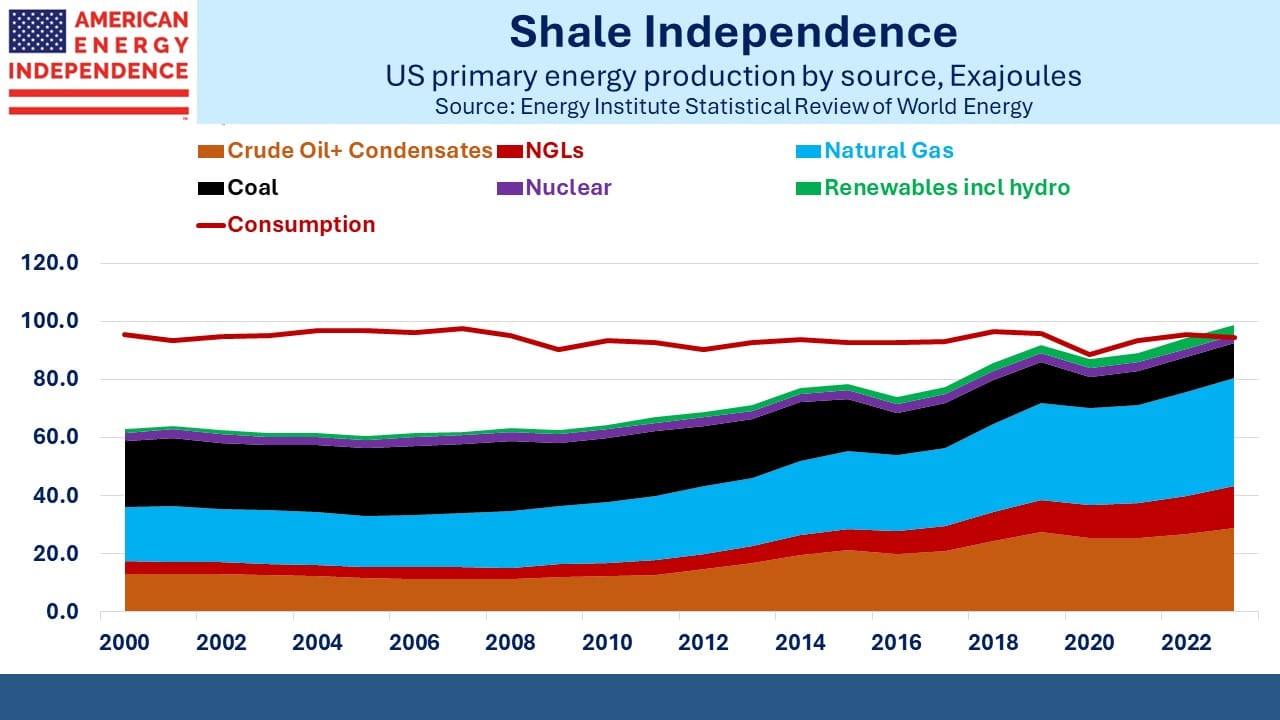
Energy Transfer’s acquisition of Crestwood brings natural gas gathering and processing assets and reduces crude oil transportation to 20% of ET’s cash flows. This deal also doesn’t create any tax issues for owners.

TC Energy (TRP) recently announced they’re spinning out their liquids business to a be a standalone entity, leaving them to be an “opportunity-rich, growth oriented natural gas and energy solutions company.” They expect their liquids business to offer “incremental growth and value creation opportunities.” This doesn’t sound very exciting. TRP had been lagging its peers because of its high capex. The spinoff announcement wasn’t well received because it caused investors to think a little more about the liquids business and its low growth prospects.

Blackrock and KKR recently sold their stake in an Abu Dhabi crude oil pipeline for $4BN.

Most long term energy forecasts are political documents nowadays. If your projections don’t show a rapid transition away from fossil fuels, climate extremists accuse you of destroying the planet. BP struggled with this in recent years. They handed off their Statistical Review of World Energy to the Energy Institute last year. In 2022 their projections had the Orwellian names Accelerated, Net Zero, and New Momentum. The third was the realistic one showing current trends – the other two were useless for capital allocation.

The US Energy Information Administration (EIA) makes long term forecasts that fortunately remain apolitical. Forecasts of crude oil demand become increasingly tenuous over time because the transportation sector dominates and public policy can more easily impact the move to electric vehicles. But natural gas is harder to replace, especially in the industrial sector where the EIA sees Incremental growth for the next three decades.

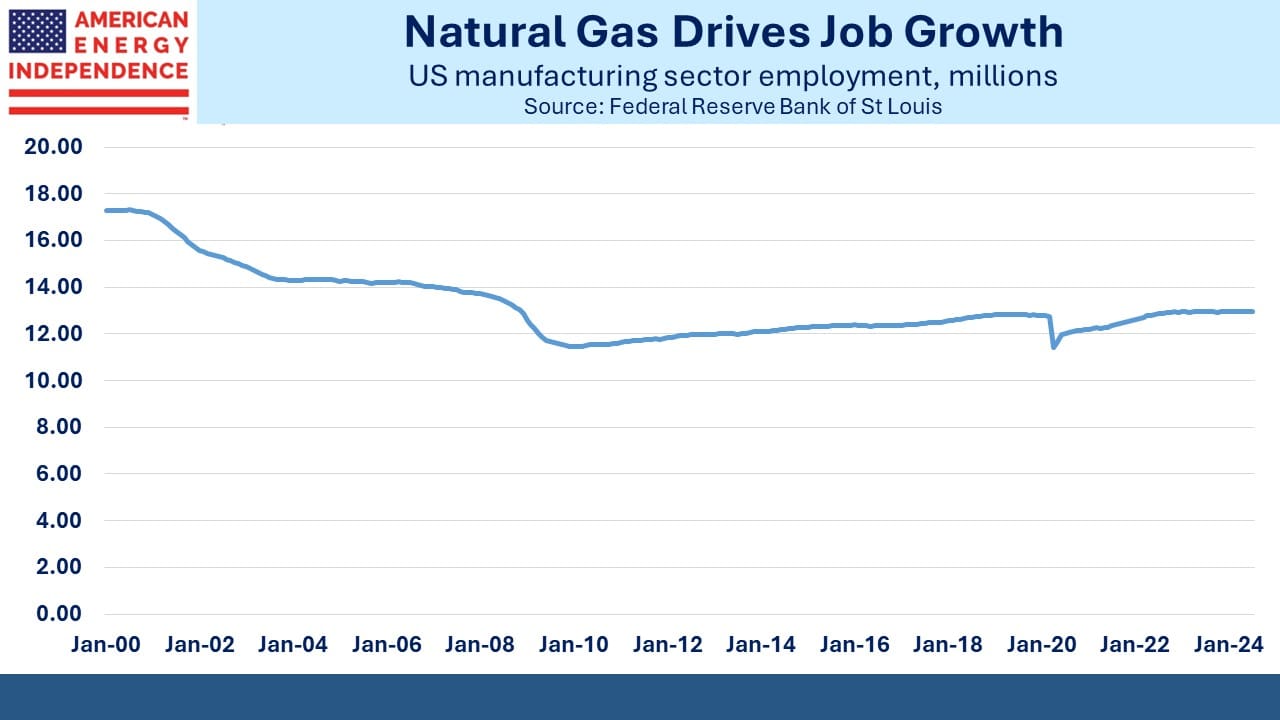
The Inflation Reduction Act is encouraging Foreign Direct Investment (FDI). Dutch fertilizer company OCI is investing $1BN to produce ammonia, a key fertilizer input, in Texas. Europe’s declining energy consumption following Russia’s invasion of Ukraine is in part due to de-industrialization caused by high energy prices. Chemical, metallurgic, glass, paper and ceramic industries have been closing factories across Europe. In a recent survey of 3,500 German companies, more than half felt the transition away from Russian natural gas and towards renewables was “very negative or negative” for their business. Some of these companies are transferring output to America. Since 2021 the US has been the world’s biggest destination for FDI.

US exports of Liquefied Natural Gas (LNG) are almost certain to enjoy strong growth as the US adds LNG terminals to send cheap US gas to foreign markets. Industry and LNG exports are the two main drivers of growth for US natural gas.

Construction of new pipelines for both crude oil and natural gas in the US is far below past years and is unlikely to recover anytime soon. We have what we need. This is why growth capex is down more than half from its peak, boosting cash flow and making the stocks attractive.

The only major crude oil pipeline project under construction in North America is the expansion of the Trans Mountain Pipeline which Kinder Morgan wisely sold to the Canadian Federal government in 2018 (see Governments And Their Energy Policies). Getting its oil to international markets is regarded as being in Canada’s national interest. But the same environmentalist activism and cost inflation that delay private sector projects have similarly hurt this one now owned by the public sector. The estimated cost has increased 4X since KMI’s sale.

Recently engineering difficulties in an approximately one mile stretch of tunnel through a mountain in British Columbia have triggered a request for regulatory approval to alter the route. The indigenous population is opposed. Further delays look likely, risking “significantly increased construction costs.”

Gas is a growth business. Capital and M&A decisions are starting to reflect that.

We have three funds that seek to profit from this environment:

Energy Mutual Fund Energy ETF Real Assets Fund
 

The Sunshine State Runs On Natural Gas

SL Advisors Talks Markets
The Sunshine State Runs On Natural Gas
Loading
/

If you google “Florida solar” or “Florida natural gas”, both searches return around 150 million results. NextEra Energy, which owns Florida Power and Light (FPL), the utility that covers much of the state, is targeting zero emissions by 2045. Their 2022 ESG report says FPL expects to quadruple its solar generation capacity by 2031. They currently operate 63 solar sites across the sunshine state. 

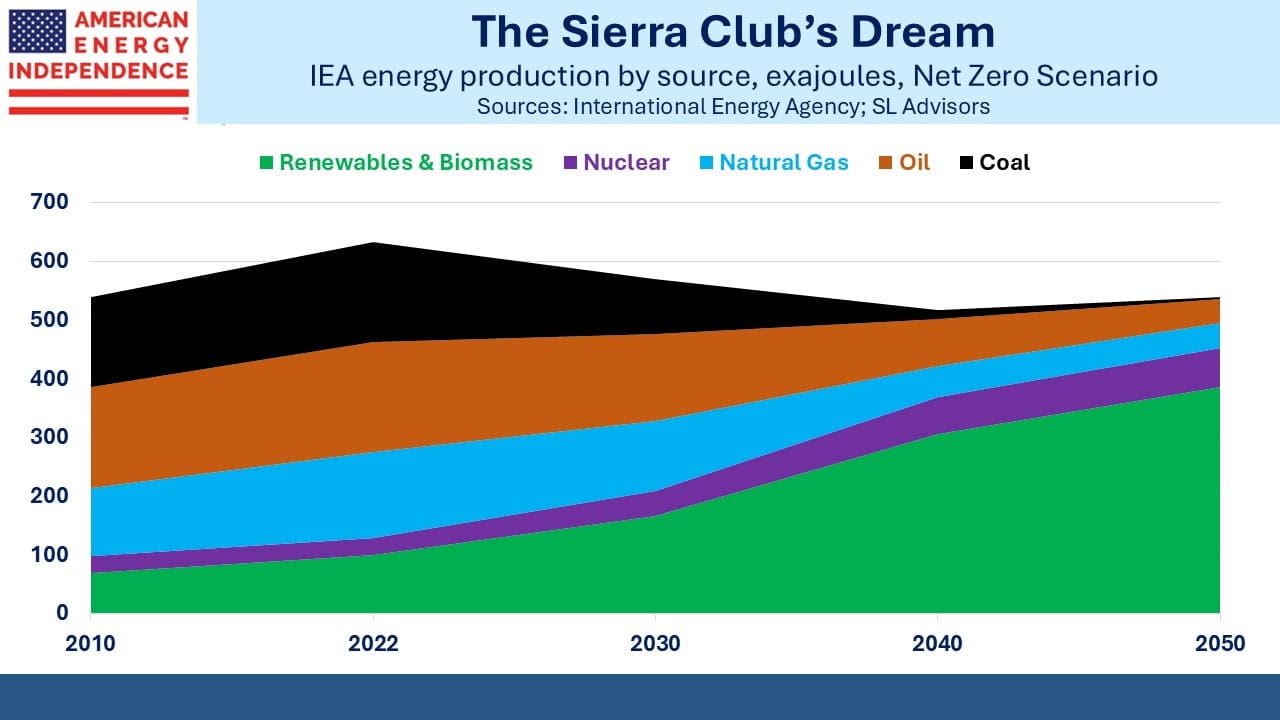
As its nickname suggests, Florida is well situated for solar power. Casually following the announcements of new solar installations and battery centers to back them up, one might think the state is largely powered by the sun. But as the Energy Information Administration (EIA) recently noted, 75% of Florida’s electricity comes from natural gas.  

The biggest change in Florida’s sources of power generation over the past decade has been the increase in its use of natural gas, which generated 191 Terrawatt hours (TWh) last year, 53 TWh more than in 2012. This 2.6% annual growth rate pales against solar’s 50.3% annual rate over the same time. But growth rates starting with a very small base number often look deceptively high. Renewables fans use this mathematical sleight regularly to overstate their impact. Last year solar power generated 11.4 TWh for Floridians. Even the year-on-year increase of 2.4 TWh was less than a quarter of the jump in natural gas. And it’s safe to say that solar growth rate will not sustain anything close to 50%. 

Florida relies on solar power for 4.5% of its electricity, a little higher than the US at 3.4%. Generation over the past decade has grown at a 1.6% annual rate, three times the US at 0.5%. As a Florida homeowner I think FPL is getting it right. They’re delivering reliable power at a reasonable price. Their mix of sources roughly matches Florida’s, since they’re the states’s biggest provider. Also note that solar is 11% of capacity but only 5% of supply. Solar and wind tend to run at 20-30% of capacity (offshore wind can be higher). Florida’s solar may run higher because it is usually sunny, but after each glorious sunset those solar panels stop working.  

NextEra’s ESG document is fortunately not being implemented in a way that’s harming consumers, because adding nuclear’s 12% share means 87% of the state’s electricity comes from reliable sources.  

Liberal states have higher electricity prices, partly because they are adopting more stridently anti-fossil fuel policies. More renewables mean more costly power. New York won’t let new buildings connect to natural gas. Massachusetts has high prices even though their reliance on natural gas rivals Florida. This is because they’ve blocked the new pipelines and storage facilities that they clearly need, limiting their benefit from low domestic prices. Instead, they import liquefied natural gas (LNG) and therefore have to compete on the global market at much higher global prices.   

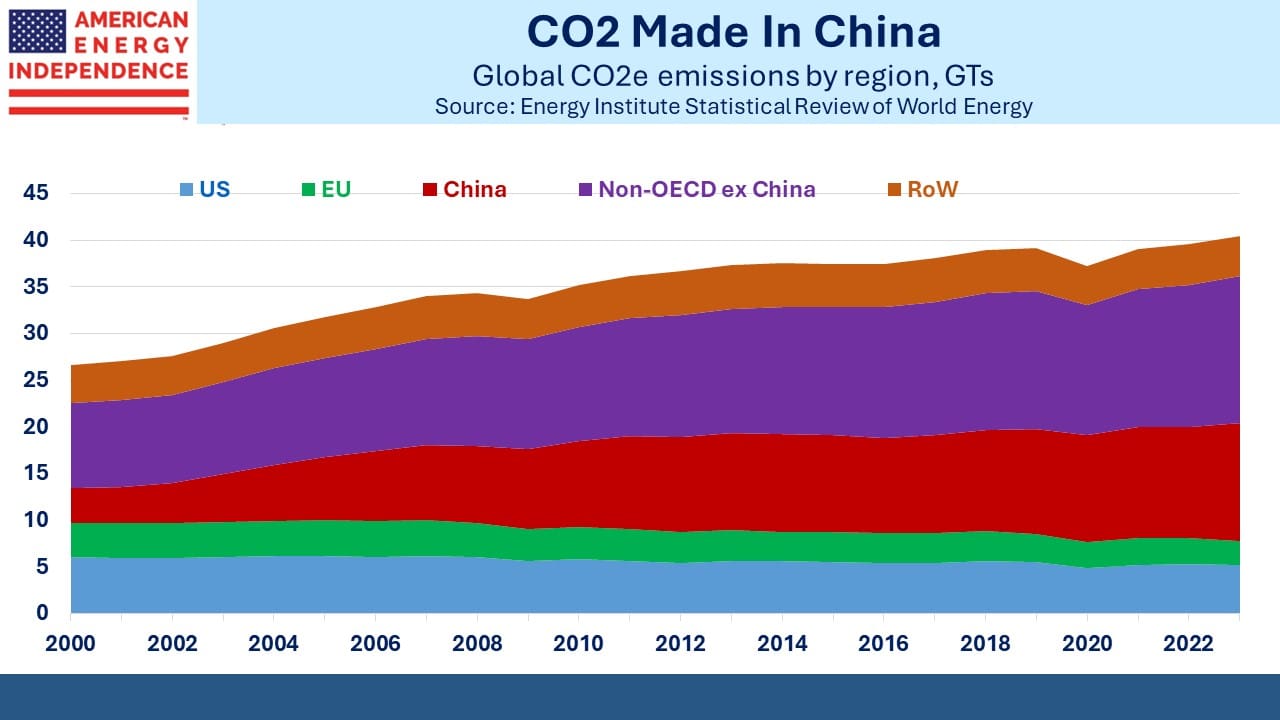
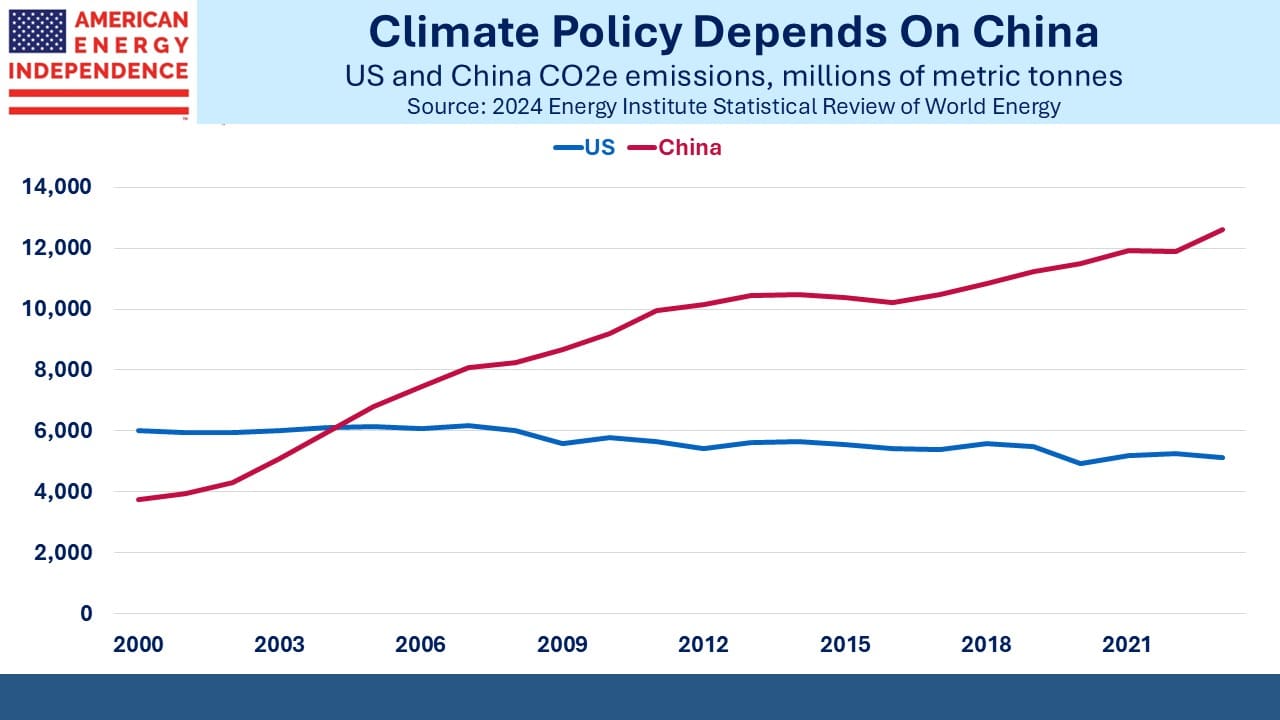
Florida’s use of coal has dropped by two thirds over the past decade. China plows ahead with new coal burning power plants at the rate of around two per week. They’re building six times as many as the rest of the world. Climate extremists in liberal states drive energy policies that impose higher costs on their own citizens and any modest benefit in reduced emissions is swamped by China’s actions. 

US residential solar is losing momentum, because of higher interest rates as well as a sharp drop in the rebates California residents can earn for sending surplus solar power back to the grid. Wells Fargo estimates installations this year will be up only 3% versus last year and is forecasting a 13% drop next year. The EIA expects cheap natural gas to cause a slight drop in electricity prices next year. Florida should benefit more than most. Massachusetts probably won’t. 

Tesla offers installation of photovoltaic roof tiles that don’t look like ugly solar panels arrayed on top of your house. The WSJ recently interviewed two homeowners happy in spite of long delays. But volumes are far below the company’s forecast of five years ago and the story suggests Tesla severely underpriced the jobs. Solar really isn’t that cheap, especially in northern states.  

Job growth in Florida is double the rate of New York and New Jersey, and 50% faster than Massachusetts and California. Remote work is allowing Americans to spread out, and they’re choosing Republican states because they’re generally better run and more pro-business.  

Long-time Florida residents often express the fear that “northern liberals” will turn Florida blue. The opposite has happened, because political conservatives are generally the ones that move. My golf club in NJ has seen an increase in members moving to Florida. Few voted for Democrat governor Phil Murphy. This is why migration south has created a liberal shift in states like New York and New Jersey instead. Energy policies are starting to reflect this.  

We have three funds that seek to profit from this environment:

Energy Mutual Fund Energy ETF Real Assets Fund
 

Fewer MLPs And American Exceptionalism

SL Advisors Talks Markets
Fewer MLPs And American Exceptionalism
Loading
/

The diminishing number of MLPs has started to draw attention from sell-side analysts. Morgan Stanley’s Robert Kad wrote in his Midstream Weekly that consolidation was likely to, “impact active manager mandates that have been dedicated to the sector.” The shrinking pool of MLPs and its impact on MLP-dedicated funds has been a developing problem for years. The changed business model during the height of the shale revolution favored growth over distribution stability. The subsequent downturn saw cuts in payouts that soured the traditional investor base of wealthy individuals (see The Disappearing MLP Buyer from March 2020).

Many MLPs responded by rolling up into their c-corp GP parent, sometimes with adverse tax consequences for their holders. This began in 2015 (see Kinder Shows The MLP Model is Changing). The Oneok combination with Magellan Midstream is similarly imposing an unwelcome tax bill on long-time unitholders of the latter.

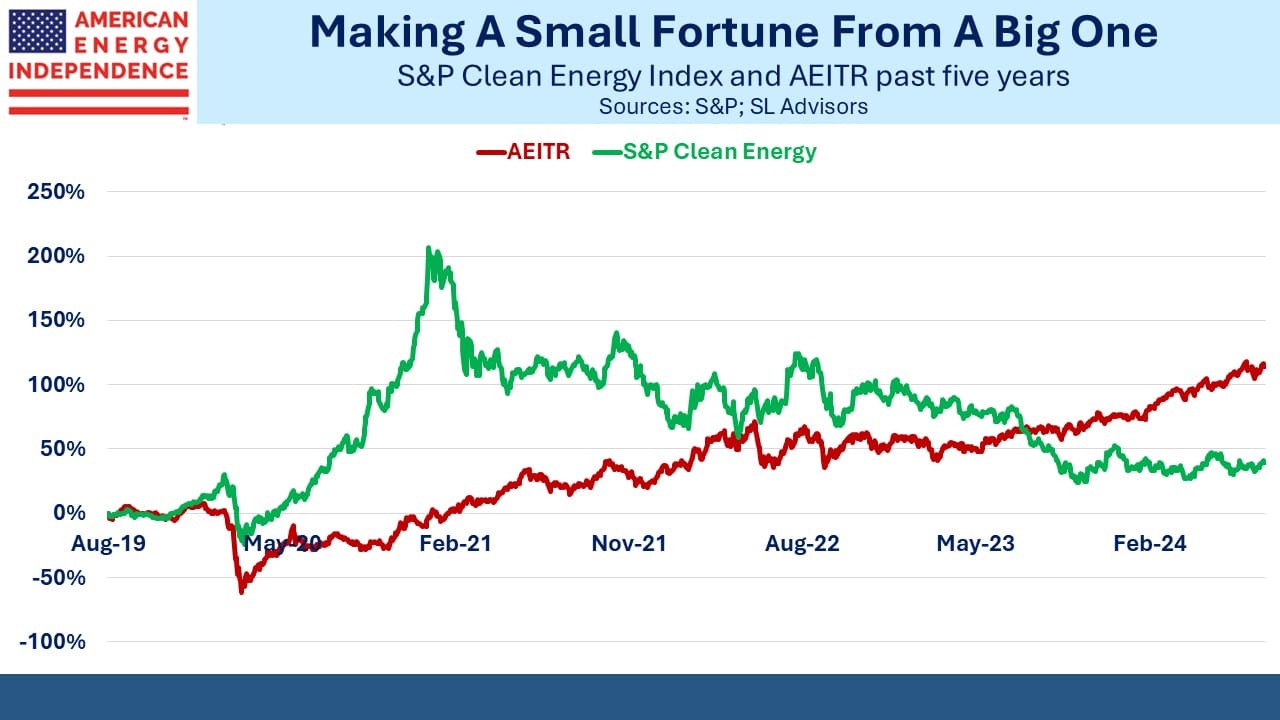
Robert Kad goes on to suggest that MLP-dedicated funds may adopt broader mandates, perhaps to broad infrastructure or the energy transition, although attractive opportunities in wind and solar are rare in our opinion. Windpower mandates are being renegotiated because the suppliers are losing money (see Why Aren’t Renewables Stocks Soaring?).

Kad notes that diversifying away from MLPs will create selling pressure. Keeping MLP exposure below 25% avoids the tax liability faced by MLP funds such as the Alerian MLP ETF (AMLP). It’s a binary rule – 26% exposure to MLPs still renders the entire fund liable for corporate taxes.

As we’ve noted before, investors in MLP-dedicated funds should worry about whether and how their funds modify their portfolios (see Why MLP Fund Investors Should Care When They Change from October 2020).

Slowly switching into c-corps would impose triple taxation on those holdings because the fund would remain taxable until MLPs fell below 25%. A gradual switch could lessen the market impact at the expense of additional taxes. There’s an advantage to being a first mover, so the managers of the Invesco Steelpath family of MLP-dedicated funds and AMLP are probably watching each other warily, wondering what the other will do.

AMLP updates its unrealized tax liability every day. As of August 21 it was $357MM. AMLP is once more a taxpayer, so its NAV will only appreciate by around 79% of its index (1 minus the corporate tax rate). It’s a terribly inefficient structure. Earlier this year Vettafi, publisher of AMLP’s benchmark, sought stakeholder input on potential changes to the index.

The pressure for change is growing. Investors in MLP-dedicated funds, many of whom have tax-deductible losses, have little upside in staying invested during the process.

Midstream energy infrastructure has been quietly outperforming the market recently. So far in August the American Energy Independence Index (AEITR) is ahead by 3.5%. The extreme low of Covid in March 2020 provides a flattering point of comparison. But even over the past three years the AEITR is ahead by 15% pa.

Strong performance in 2021-22 inevitably ran out of steam, and this year a small number of stocks with an AI angle have made diversification look pedestrian. But every trend ends, and the release of 2Q earnings has coincided with energy infrastructure gaining momentum.

It helps that earnings were generally good. Results +/- 5% of consensus were the norm, apart from Cheniere which seems to reliably “beat, raise and repeat” to quote JPMorgan’s Jeremy Tonet. The broader pattern has been in evidence for several quarters. The positives are well known to investors – reduced growth capex is supporting growing free cash flow which is leading to improved dividend coverage (1.7X in 2022) and falling leverage (<3.5X Debt:EBITDA by YE 2023).

This is supporting dividend increases and stock buybacks.

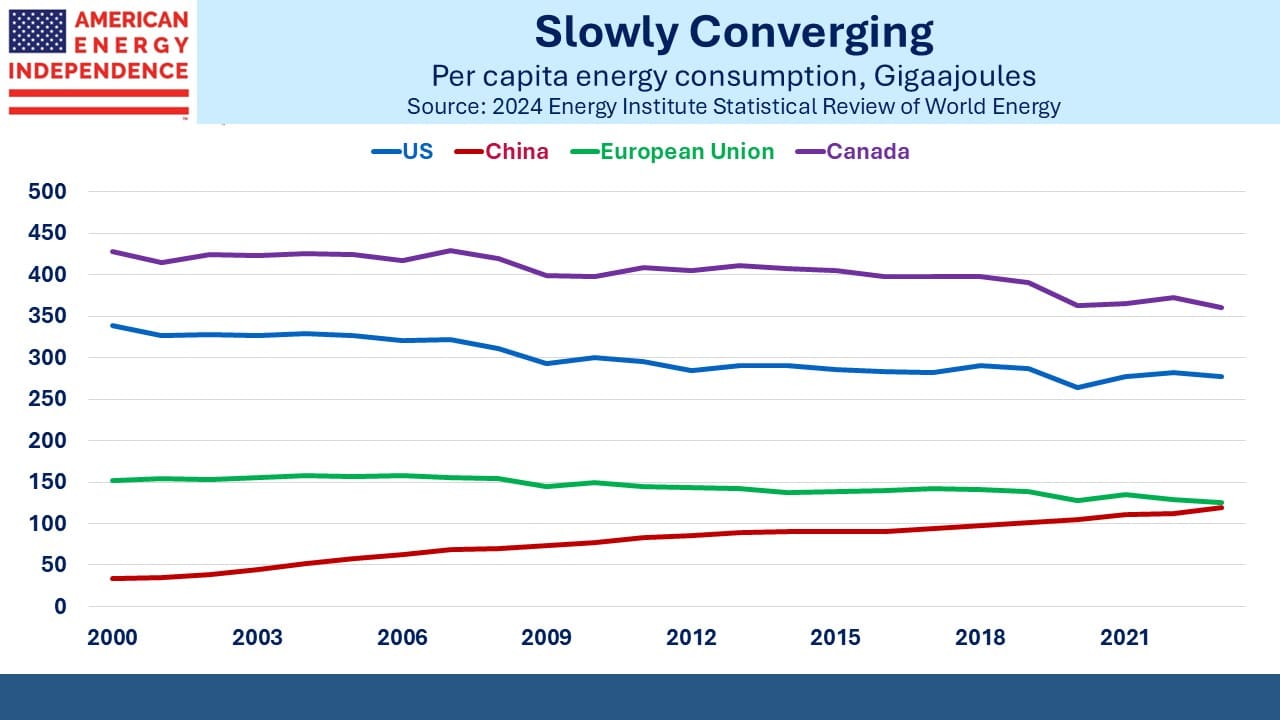
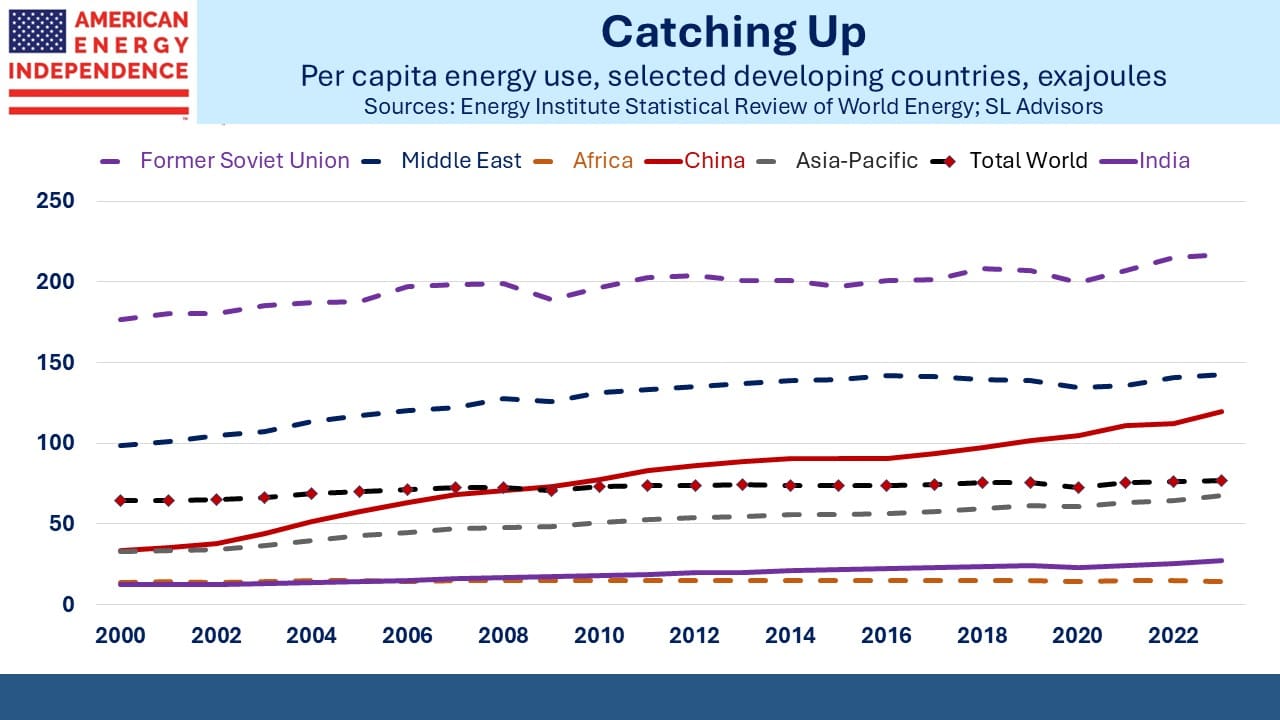
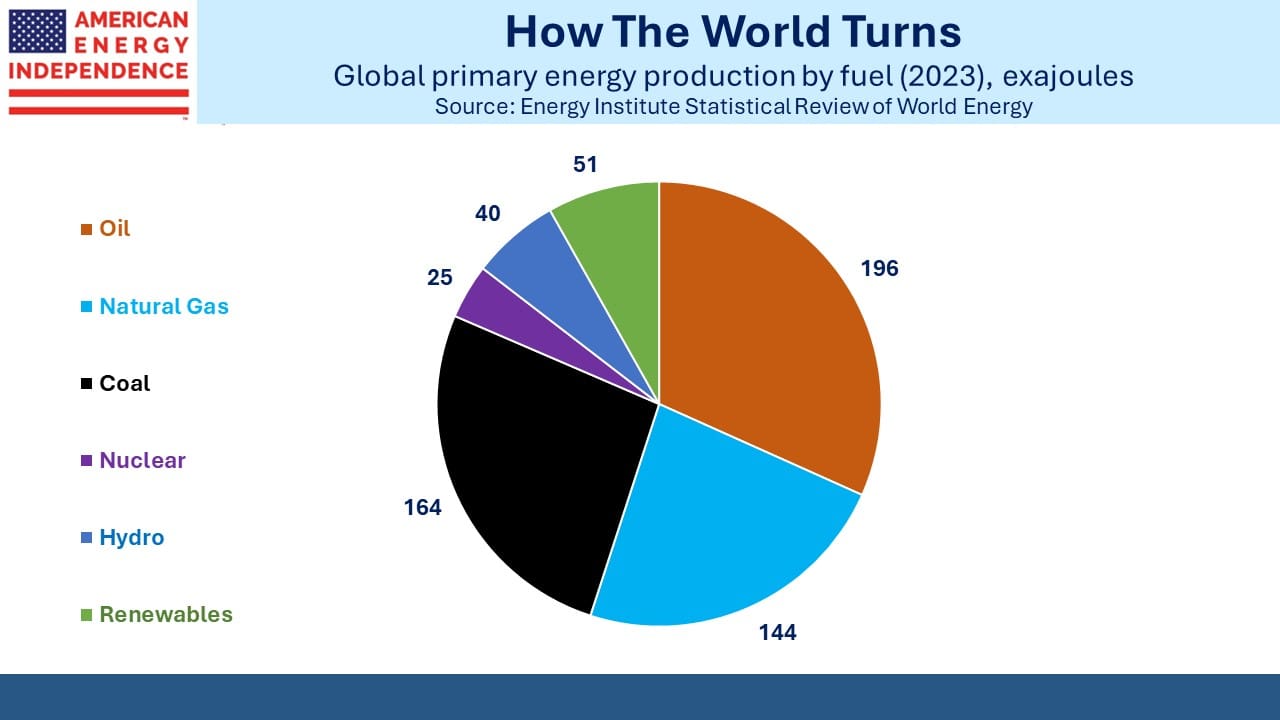
The energy transition and climate change put two competing visions at conflict; rich world countries want lower emissions, while developing countries want higher living standards, which require using more energy.

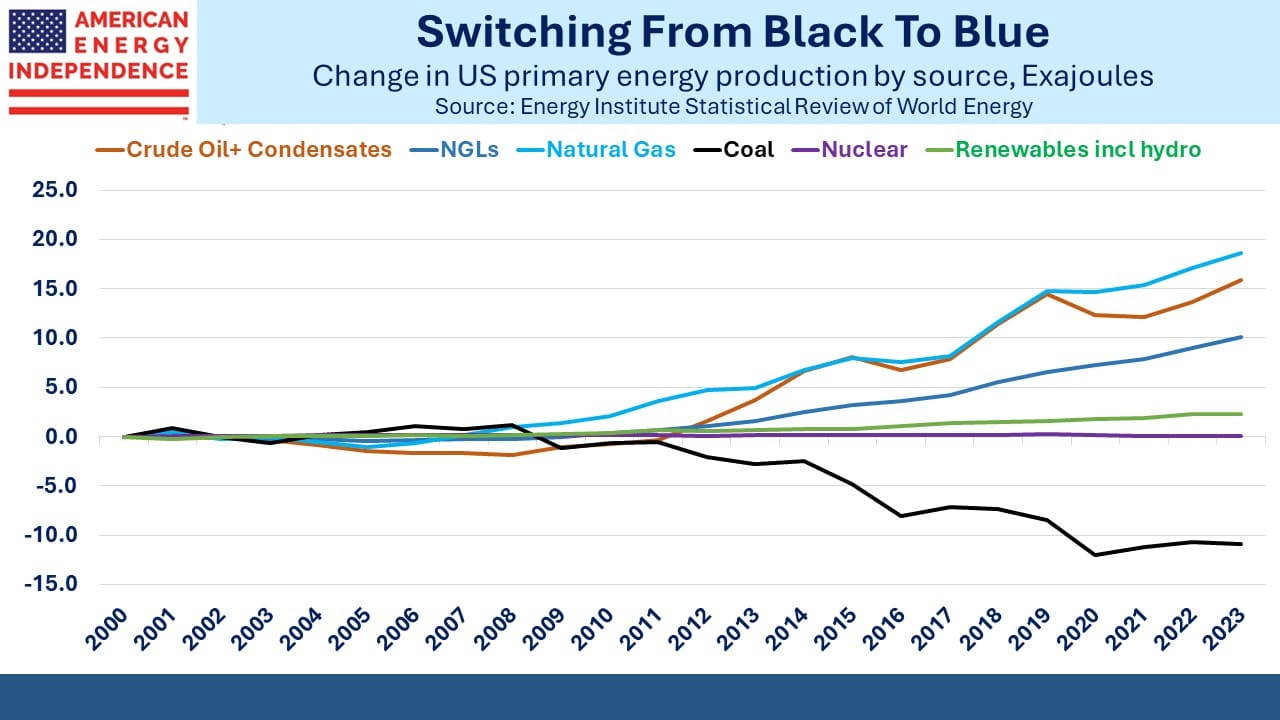
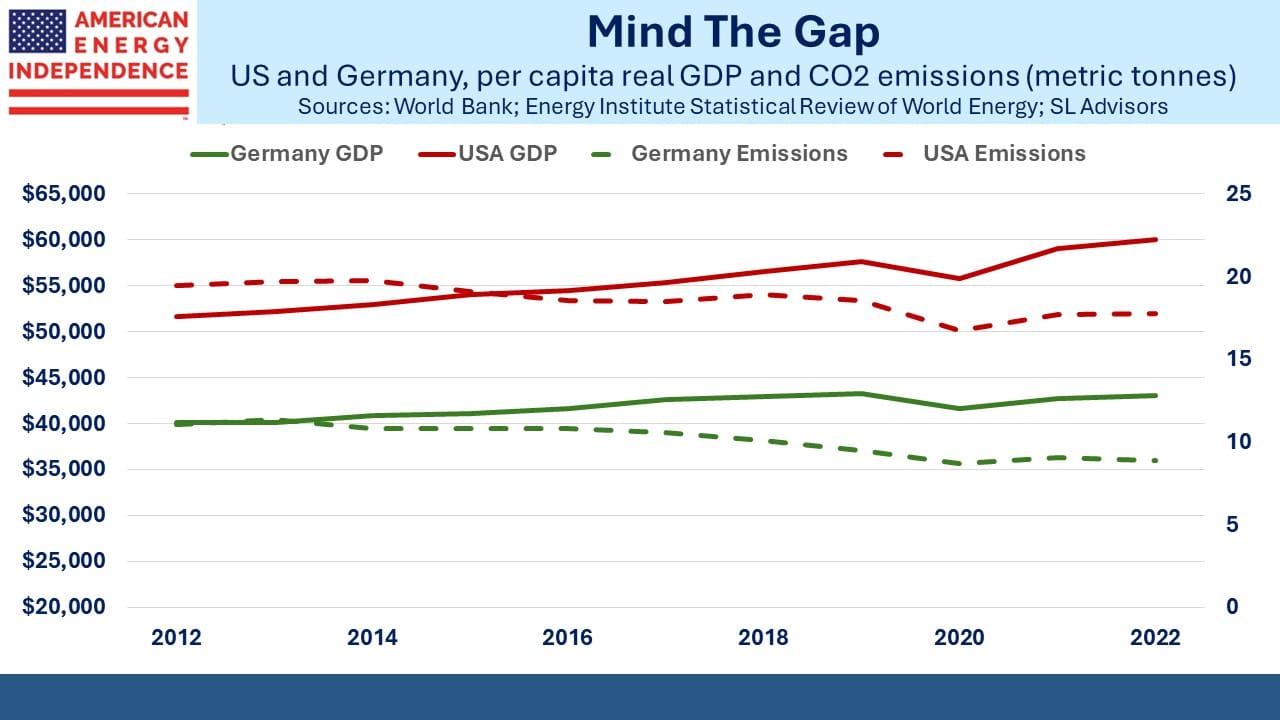
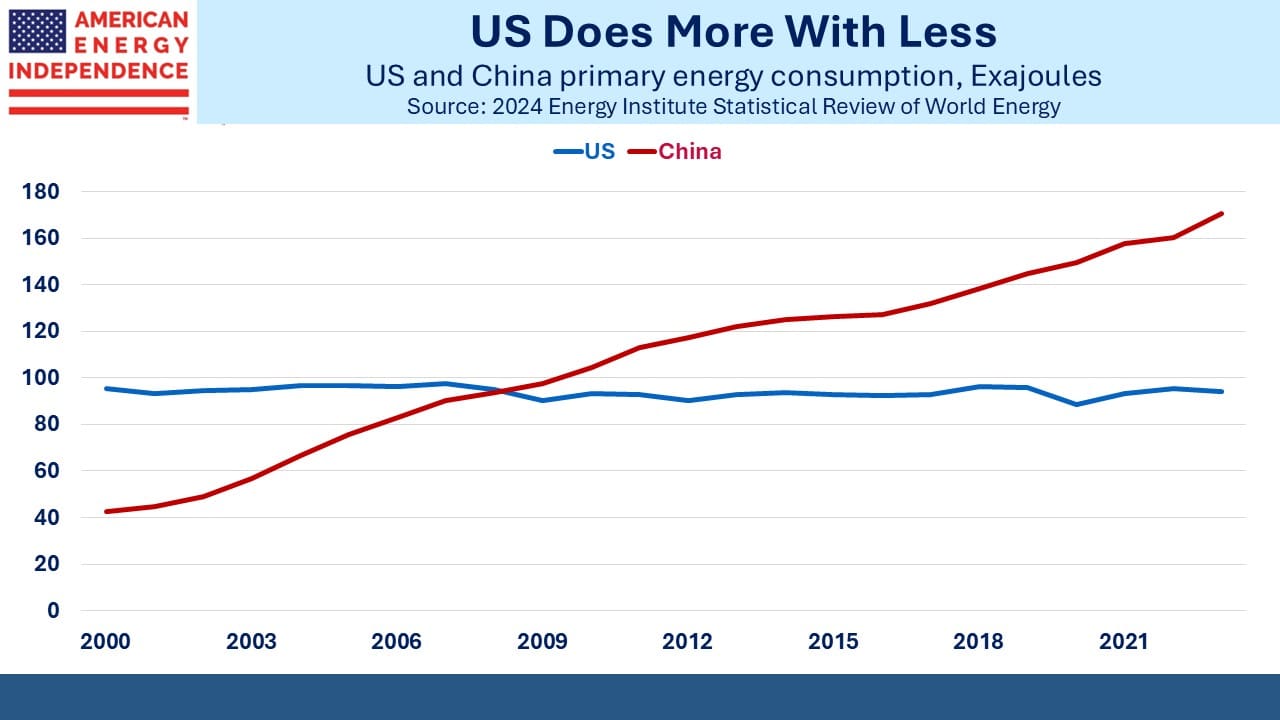
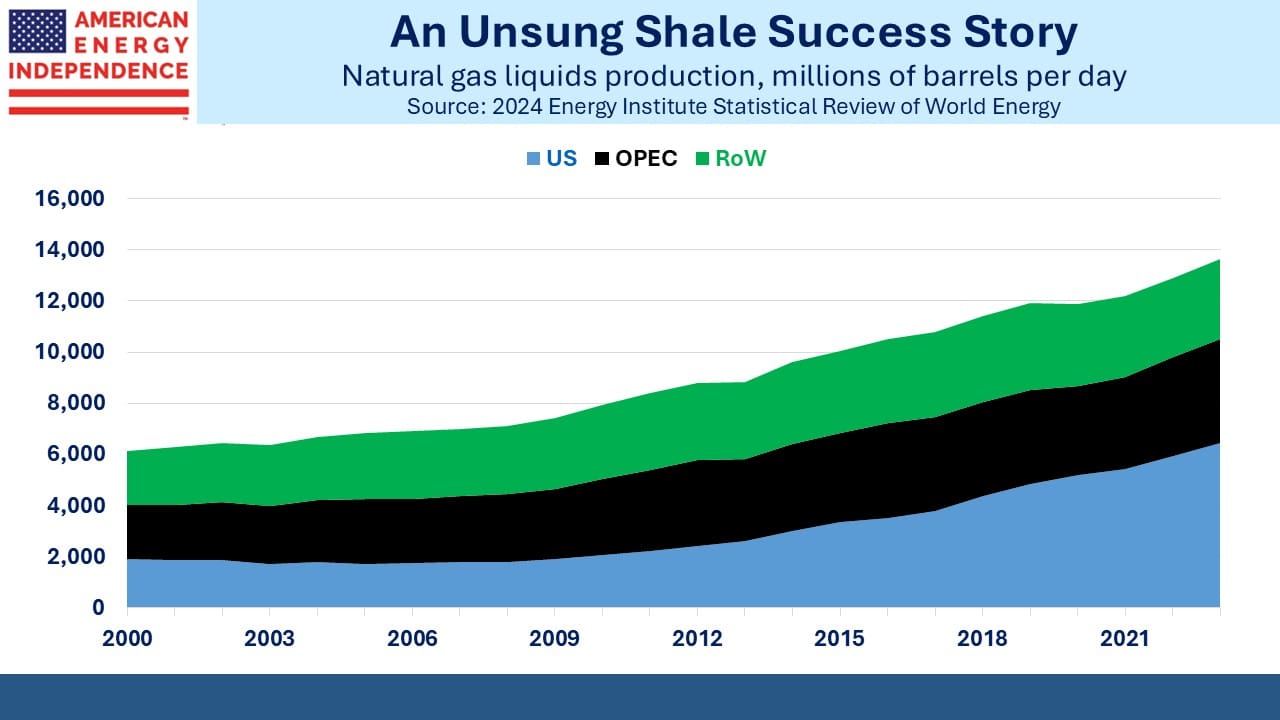
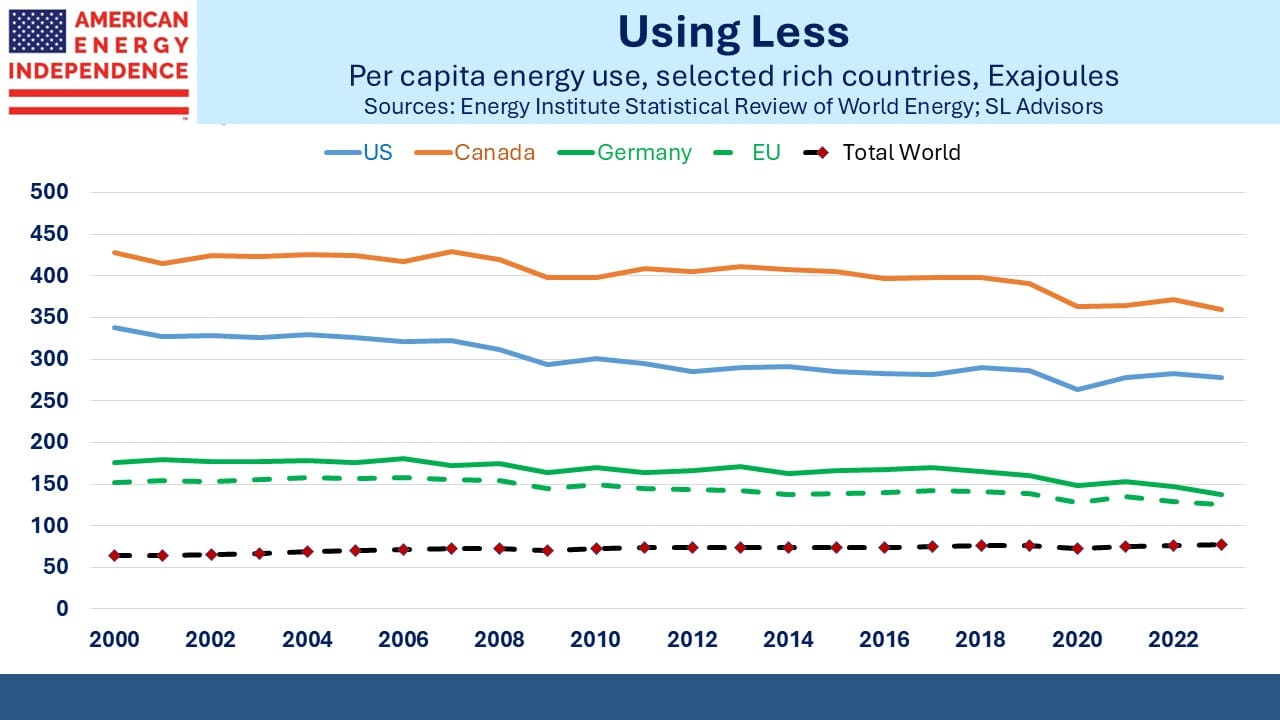
G7 countries have generally reduced energy consumption over the past decade, and their citizens’ living standards have stayed flat. The US is a notable exception in that energy consumption has grown, aided by the shale revolution and its corresponding increase in domestic supply. Nonetheless our emissions have fallen, mainly because the mix has shifted from coal to natural gas. Renewables have also contributed modestly to this.

By contrast with the rest of the G7, Americans have enjoyed rising living standards during this time (see Celebrating The 4th of July). The reasons are complex and not solely due to our energy policies. But a decade reflects the policy choices each country has made. I’m not sure why the combination of energy consumption, emissions reduction and per capita GDP growth achieved by any of the other six members of the G7 would be preferable to what we’ve achieved in America. No US president should ever feel the need to apologize for American exceptionalism. The world could use more of what we have here.

We have three funds that seek to profit from this environment:

Energy Mutual Fund Energy ETF Real Assets Fund
 

An Uncontroversial MLP Merger

SL Advisors Talks Markets
An Uncontroversial MLP Merger
Loading
/

Energy Transfer’s (ET) acquisition of Crestwood (CEQP) highlights the shortcomings of the proposed merger of Oneok (OKE) with Magellan Midstream (MMP). Because ET and CEQP are both MLPs, combining the two entities doesn’t constitute a taxable event for unitholders. This contrasts with OKE/MMP where MMP unitholders will face the recapture of deferred income tax on prior distributions. The synergies in ET/CEQP are modest and achievable – likely understated given ET’s strong operating history. Projected OKE/MMP synergies were never very convincing because they handle different commodities.  

The market-derived odds of the OKE/MMP deal closing have risen recently, and it looks likely to receive shareholder approval although not ours. We calculate the odds at close to 80%, sharply higher over the past couple of weeks. Both management teams have clearly been actively making the case to institutional investors. MMP investors and their financial advisors should be ready for an unwelcome 2023 tax bill. 

As we noted last week (see AMLP Fails Its Investors Again), the Alerian MLP ETF (AMLP) will suffer another loss of its rapidly depleting constituents when MMP ceases to exist as a stand-alone entity. ET’s acquisition of CEQP will remove yet another, reducing the total to twelve. 

MMP is 12.44% of AMLP’s portfolio and CEQP another 5.24%. They’ll have to reallocate 17.68% of the portfolio, further concentrating their positions.   

There are no good options for AMLP, but that doesn’t mean its advisor Alps won’t try something. Converting AMLP to a RIC-compliant fund by limiting MLPs to 25% of its portfolio would allow for more diversified holdings. However, this would signal to the market the sale by AMLP of three quarters of its portfolio, depressing the prices of the MLPs it owns and causing its holders great offense.  

Existing investors in AMLP and any other non RIC compliant funds such as the Invesco Steelpath family are all exposed to any of their peer group funds making such a change. AMLP investors must assess the odds of Invesco moving first, and vice versa. It’s a percolating problem and at some point, a resolution will create an overhang of MLPs for sale. The smaller MLPs, favored by AMLP because there are so few to choose from, are especially vulnerable because their only other buyers are the K1 tolerant US taxable individuals that historically owned MLPs for the tax deferred distributions.  

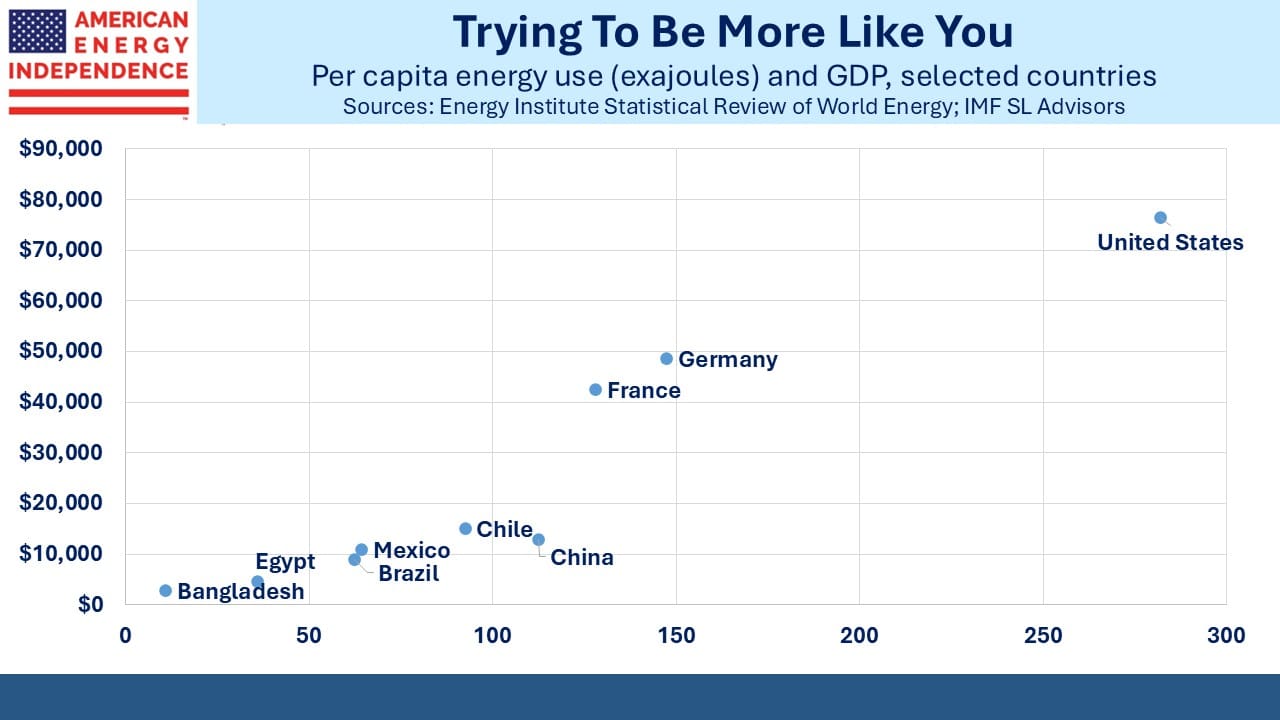
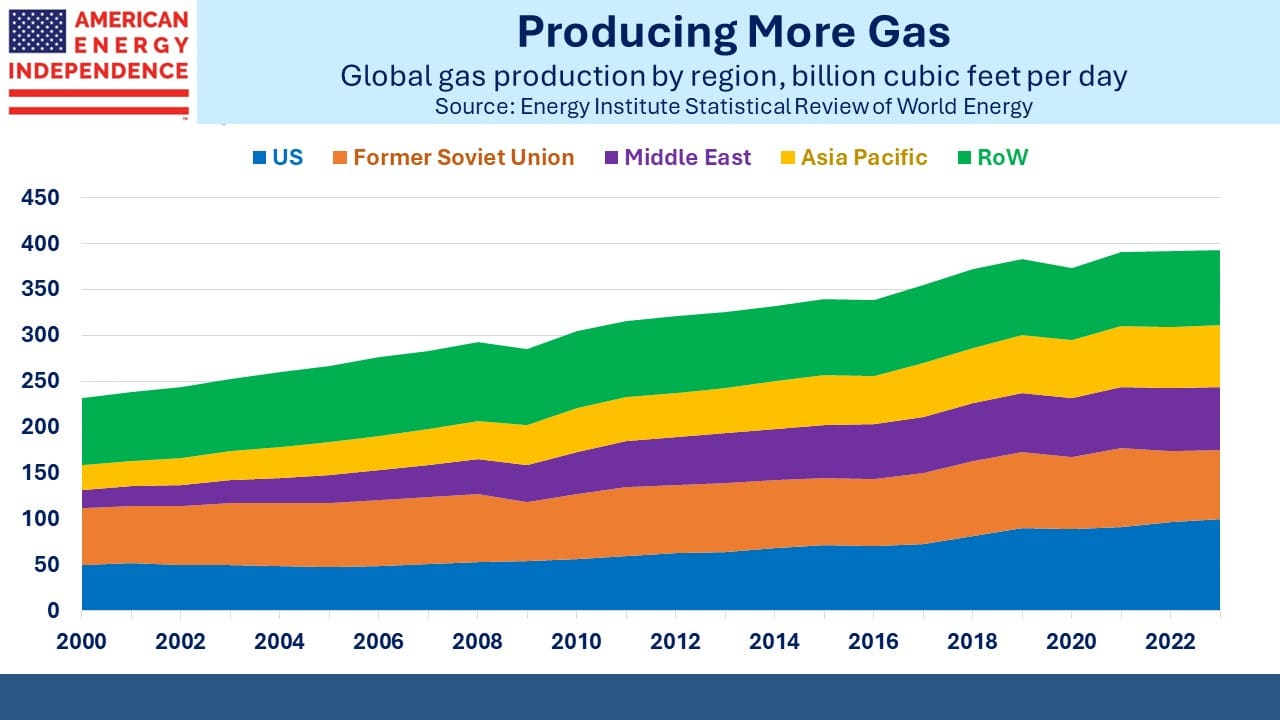
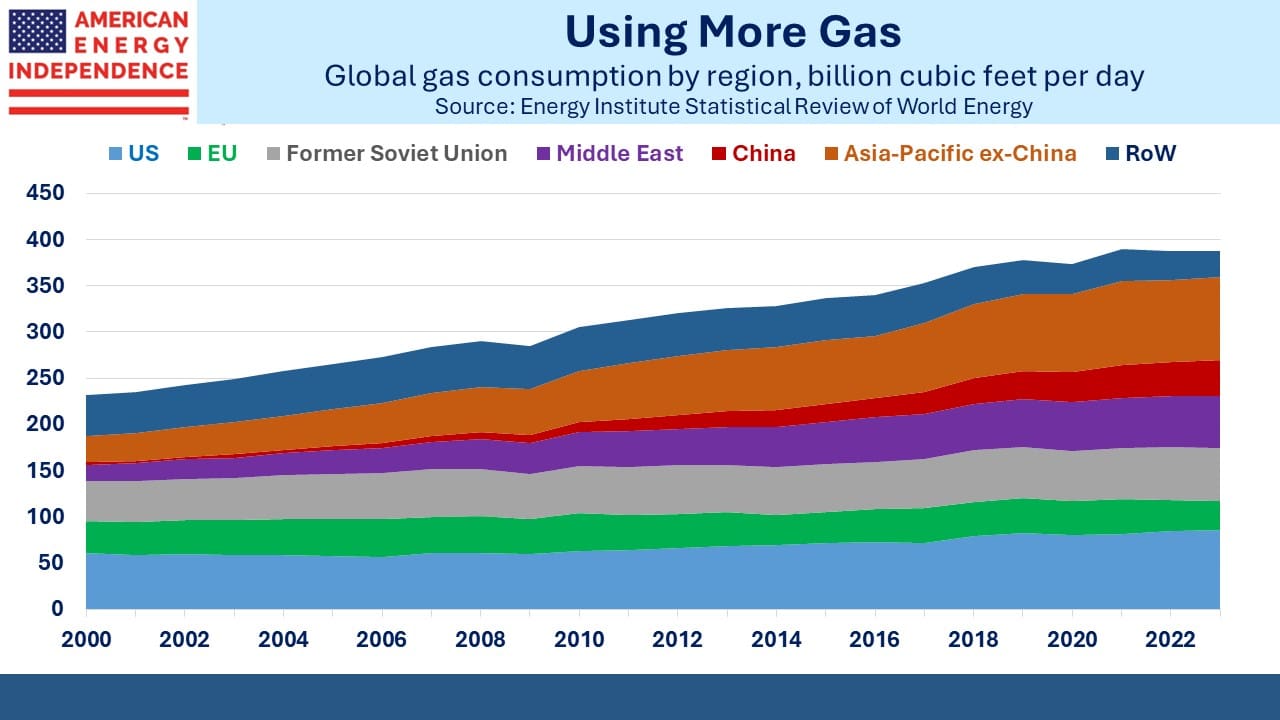
Last week the Energy Information Administration released data showing that US pipeline exports of natural gas to Mexico hit another record. Living standards in our southern neighbor are rising, which means energy consumption is too. This trend is clear across most of the developing world. Much of the world and especially poorer countries aspire to American lifestyles. Per capita energy consumption and GDP are closely linked. This is what’s driving growth in global energy consumption. Rich world OECD countries want lower emissions, and generally energy consumption isn’t rising among this group. In Germany it’s been falling, a consequence of their disastrous energy policies which are making it a less attractive location for any industry that needs reliable, reasonably priced energy.  

Our southern neighbor exhibits many of these trends. Mexico’s population has more than tripled since 1960. The UN expects further population growth through 2050. More people with rising living standards mean more energy consumption. As with most countries, improving efficiency has kept consumption below these twin trends. 

Mexico’s energy consumption grew at a 0.8% Compounded Annual Growth Rate (CAGR) over the past decade. This was behind Asia which averaged 2.6% but well ahead of Europe which saw –0.9%. At 0.6% the US stands out among G7 nations as the only one with growing energy consumption – cheap domestic natural gas has spurred investments in industry.  

Mexican electricity generation is also growing, following a sharp drop in 2020 due to the pandemic. The CAGR for the past decade is 1.4%, a third of Asia (4.6%) but well ahead of the US at 0.5%.  

Good news for US natural gas exporters is that this remains Mexico’s biggest source of power generation at 56% last year. From 2020-22 solar and wind combined went from a 10.9% share to 11.7%. Renewables are gaining, but slowly.  

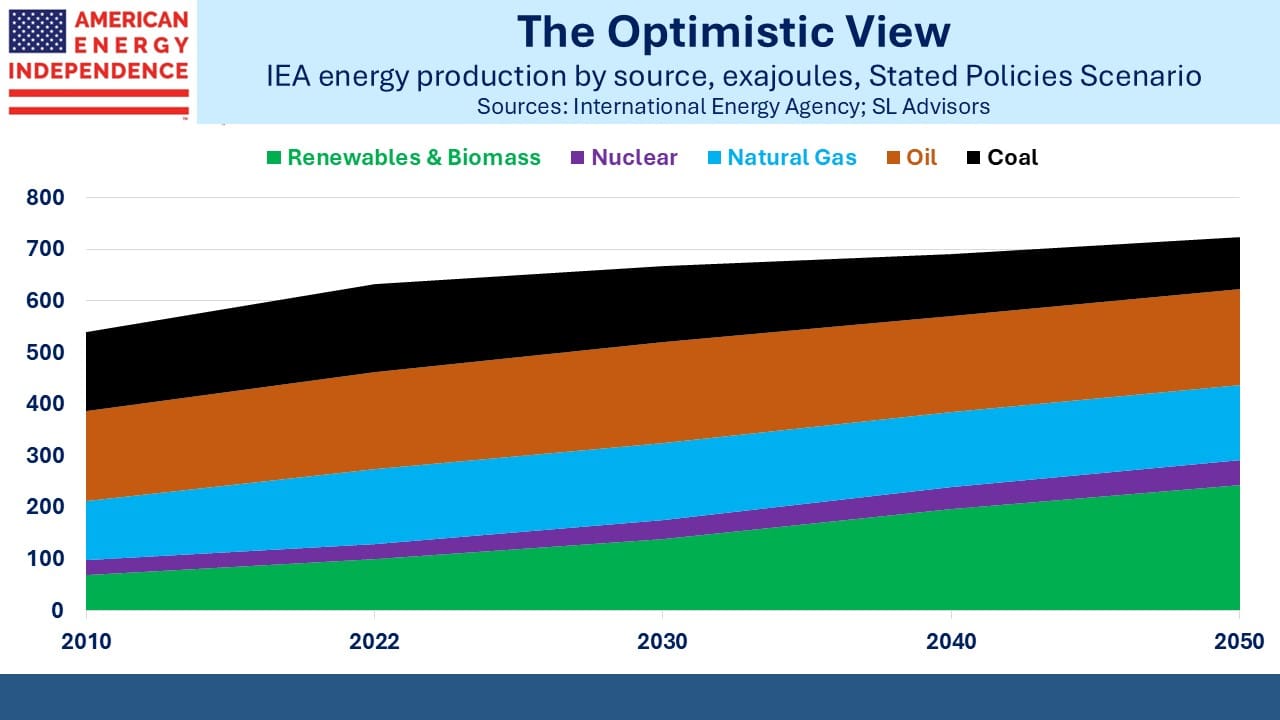
US natural gas will increasingly supply global buyers as our LNG export capacity grows and consumers in developing countries enjoy rising living standards supported by increased energy consumption. The energy transition and efforts to reduce global greenhouse gas emissions will need to align with this reality.  

We have three funds that seek to profit from this environment:

Energy Mutual Fund Energy ETF Real Assets Fund
 

Governments And Their Energy Policies

SL Advisors Talks Markets
Governments And Their Energy Policies
Loading
/

Government regulations play a big role in energy markets. Although concern about climate change is part of the political discourse in every democracy, consumers and businesses aren’t going to reduce their emissions without tax credits, incentives and rules to modify behavior.

Sometimes policies can have unintended consequences. Take ships, which mostly use heavy, bunker fuel to provide power. In 2020 new rules written by the International Maritime Organization (IMO) came into effect sharply limiting the sulphur content of ships’ fuel to 0.5%, versus 3.5% previously. Airborne sulphur is a pollutant that can harm people with cardiovascular problems living near ports. Sulphur dioxide is a greenhouse gas. The new IMO regulations were intended to improve air quality and to reduce the maritime industry’s carbon footprint.

It sounded very sensible. But some scientists now think this is increasing global warming, and may even be responsible for the exceptionally warm Atlantic waters off the US east coast and on Ireland’s west coast.

“Ship tracks” are formed when ships move across the ocean. The sulphate particles ships emit seed clouds, creating a trail of reflective, cloud-like vapor behind them. These clouds reduce the amount of sunlight reaching the earth’s surface. The reduced sulphur content of bunker fuel required by the IMO means fewer ship tracks and has inadvertently allowed more sunlight through. In some areas it could have added as much as 50% of the warming impact of human-generated CO2.

If one day our descendants decide the planet is too hot, they may resort to geoengineering which could include seeding clouds on a vast scale to try and reflect more of the sun’s heat back out to space. The IMO regulations have unwittingly created a geoengineering experiment with the opposite effect. There have even been suggestions that ships should emit salt droplets as they move, to seed more ship tracks and undo the possible damage caused by their lower emissions.

Sometimes you just can’t make this stuff up.

Canada has been frustrated for years in its efforts to transport the heavy crude produced in Alberta to global markets. The Keystone XL was intended to be a solution until President Biden canceled it on his first day in office. Kinder Morgan wisely sold the TransMountain expansion (see Canada Looks North to Export its Oil) to the Canadian federal government in 2018. British Columbia didn’t want Albertan oil passing through its province, and the protracted political dispute eventually persuaded Kinder Morgan to give up on the project.   Once the Canadian government took over vast cost increases took the project’s cost up by more than 4X. It is expected to go into service next year transporting crude from Alberta to the Westridge export terminal on British Columbia’s Pacific coast.

RBN Energy publishes a terrific blog for readers keen for a more technical explanation of markets, midstream logistics and the physics of this sector. In a fascinating post (unfortunately behind a paywall), RBN explains the challenges with getting the crude oil from Westridge into the wide blue ocean. The challenges are many. Ships must traverse a narrow channel to reach the Pacific. It’s constrained by depth and also height (because of two bridges). Bigger ships are more cost effective, but the 245 meter Aframax class is the largest ship allowed in Vancouver harbor. The biggest class of oil tanker, an Ultra Large Crude Carriers (ULCC), is 415 meters long and has over four times the carrying capacity of the Aframax.

Alberta’s heavy crude is, well, heavy. The 42 foot depth of the Burrard Inlet, through which the ships must pass, is less than the 49 foot draft of a fully laden Aframax, so they’ll have to operate at less than full capacity. Once outside the harbor some may even move their cargo of oil onto a bigger ship like a ULCC (called reverse lightering) for more cost-effective transport to their Asian buyers.

The complexity and cost of moving the world’s energy are largely hidden from view. Canada’s fractured politics have significantly boosted the cost of getting their oil exports to market.

Finally, Britain’s Conservative government seems to be quietly backing away from some of the more extreme commitments made in the past regarding emissions. The UK is ahead of many other countries, having phased out coal. Offshore windpower is at times its biggest source of electricity. The North Sea is a blustery place.

Britain has a system of carbon credits, and before Brexit their price tracked the EU equivalent quite closely. Now free of oversight from bureaucrats in Brussels, a weakening of regulations has caused UK carbon credits to drop to around half the EU price. This signals less urgency by British CO2 emitters to buy credits. UK PM Sunak may be quietly pursuing more pragmatic policies to try and boost GDP growth which has lagged peers for a decade (see UK government cuts cost of polluting in latest anti-green move). Nothing official has been said. But there’s a clear pattern around the world of voters pushing back once extreme green policies start to have an excessive economic impact.

We have three funds that seek to profit from this environment:

Energy Mutual Fund Energy ETF Real Assets Fund
 

image_pdfimage_print