Gains From Energy

/
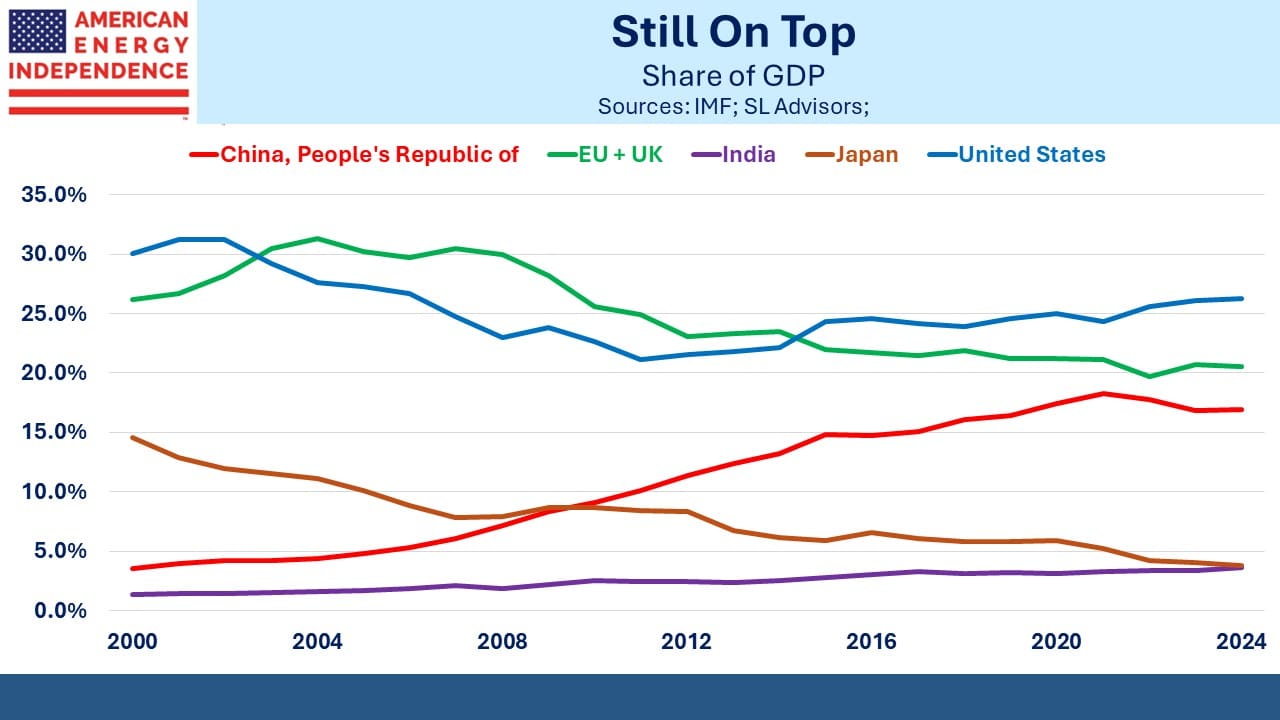
Last week the WSJ published an interesting chart, reproduced below. It was in an article ominously titled America’s Economy Is No. 1. That Means Trouble. The chart shows that US share of global GDP has been increasing for over a decade. We’ve gone from 21% in 2011 to 26% this year.
It’s an amazing performance. A consistent theme since World War II has been the US gradually shrinking its share of the global economy. This was inevitable as emerging economies such as China and India opened up to trade and deregulated their economies.
Military strength goes with economic size.
This trend implied that the US would need to confront a rising challenge from China as their defense budget grew with their economy. It’s a cycle explained by Paul Kennedy in his 1989 book The Rise and Fall of the Great Powers: Economic Change and Military Conflict from 1500 to 2000. He chronicles the arc of previous empires such as the French and Spanish. He coined the term “imperial overstretch”, when maintaining an empire imposes unsustainable costs, ushering in the decline of one and the rise of another.
Kennedy marks World War II as the approximate end of the British empire and the rise of the American one, although it’s more accurate to refer to America’s cultural and economic leadership rather than dominion over foreign countries. Back in 1989 Japan was the new rising power. That forecast soon turned out to be wrong, as China took their place. But maybe that’s also going to be wrong.
The WSJ article naturally found reasons to worry about America’s strong economy. It’s not only journalists at the NYTimes that are trained to find the negative in any story. Fiscal stimulus is partly driving growth. Trump tax cuts, the pandemic, the Inflation Reduction Act, the CHIPS Act and student debt forgiveness ($138BN so far) are all boosting consumption. The massive entitlement bill is coming due as baby boomers retire.
For the first decade of the new millennium, the US and EU roughly tracked each other in declining GDP share. They parted company long before the fiscal largesse noted above.
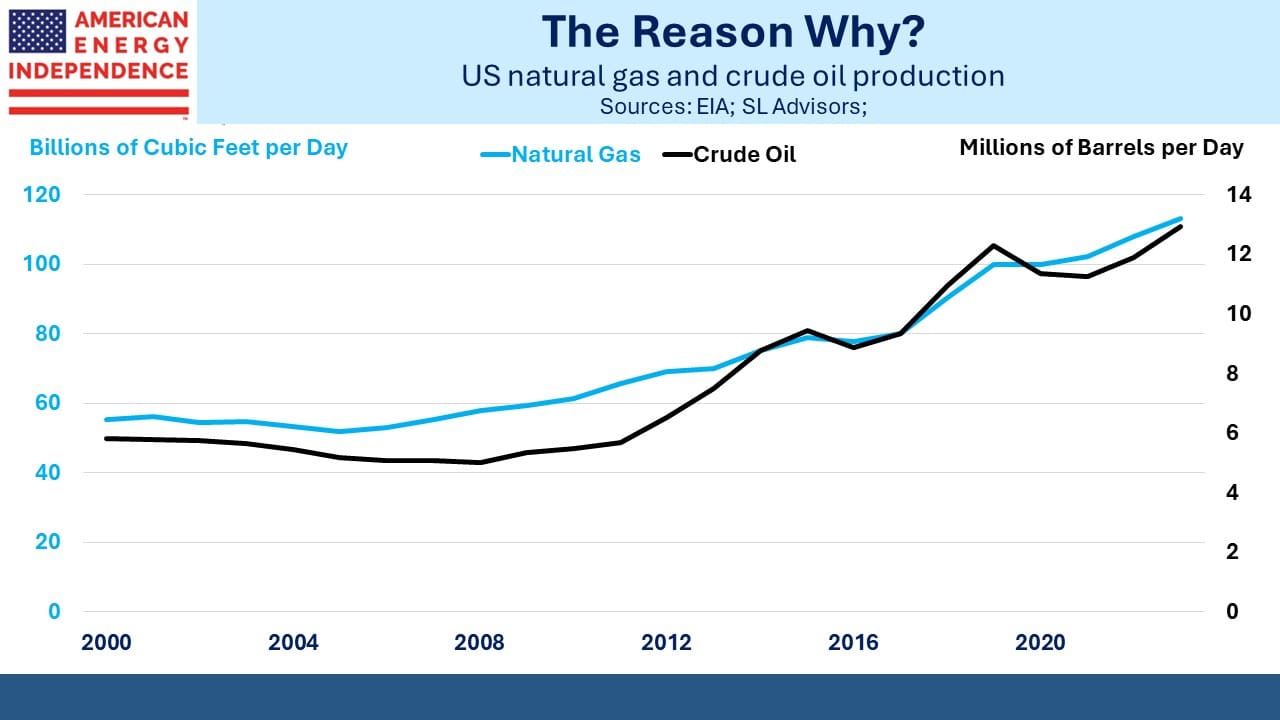
US oil and gas production began their long ascent around fifteen years ago, roughly the same time our share of GDP began increasing. Has attaining American Energy Independence heralded a newfound resurgence in American economic leadership?
A cynic might suggest that a blog on energy will link anything positive to the shale revolution. It’s a simplification to think one caused the other. But there’s also plenty of evidence that low domestic energy prices have boosted growth.
Germany’s disastrous energy policies (see Germany Pays Dearly For Failed Energy Policy) have so effectively constrained their own manufacturers that some are moving production to the US. Their emissions are coming down because they’re de-industrializing, to America’s benefit.
Japan’s population is shrinking, creating a GDP headwind. China’s population has also peaked, and they’re confronting too much infrastructure spending that hasn’t boosted productivity enough.
The latest example of the role American energy plays is the growing need for natural gas to power new data centers. Tudor Pickering is the latest firm to publish a report on the topic. They estimate as much as 8.5 billion cubic feet per day in new production will be required.
I have yet to read a story predicting more solar panels and windfarms due to AI.
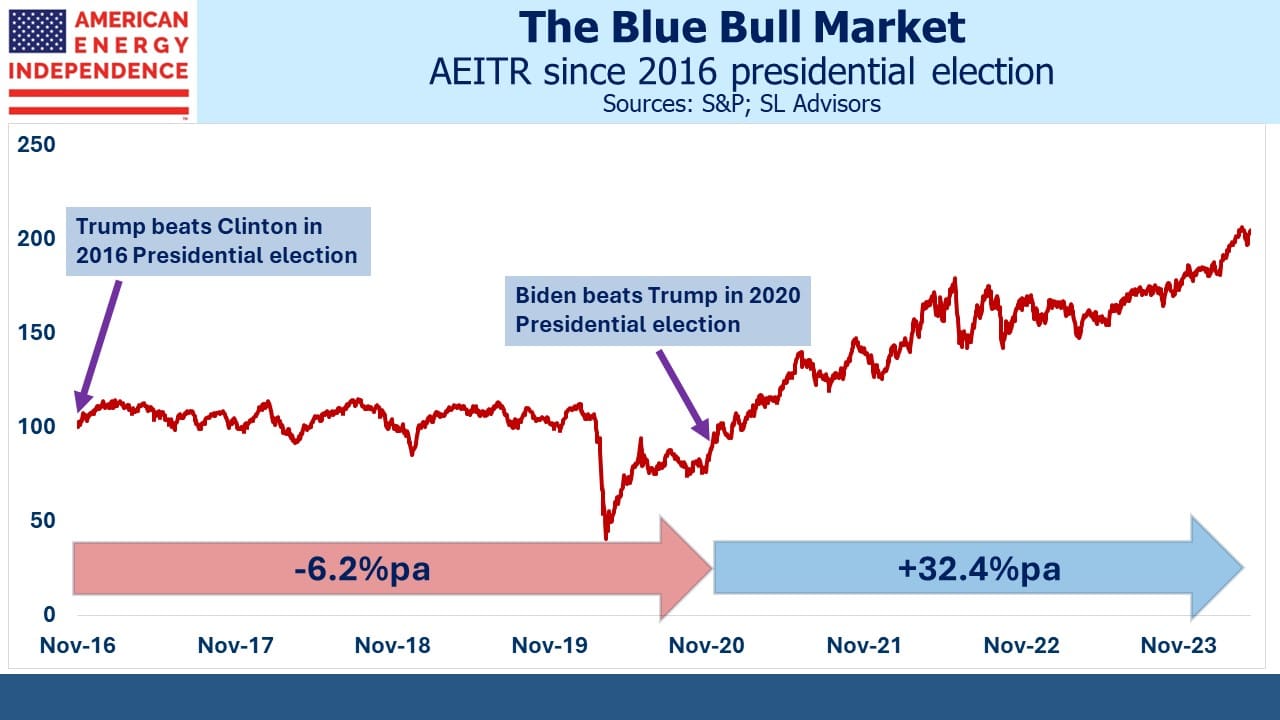
America’s gains in GDP aren’t easily attributed to either party, since they’ve continued with both Democrat and GOP presidents. Republicans will be tempted to claim success as the party of deregulation. But investors in pipelines as defined by the American Energy Independence Index (AEITR) have done much better under Biden than Trump.
The White House isn’t drawing attention to this, because Democrat progressives would prefer it wasn’t true. It shows that the institutional advantages of our economy have made this possible. These include private ownership of mineral rights, easy access to capital and a culture of entrepreneurialism.
There’s another reason why the US is gaining GDP share. Americans just work harder than Europeans. Nicolai Tangen heads Norway’s $1.6TN sovereign wealth fund that invests the profits from Norway’s oil and gas output. He said that American companies outpace Europeans on innovation and technology. He cited a difference in, “the general level of ambition.” He suggested that Europeans strive for a better work-life balance, meaning they work less.
I left the UK for New York 42 years ago. I agree with Tangen. That’s why I moved here. Americans are more ambitious and less afraid of failure. My generation cared little for work-life balance 20, 30 or 40 years ago. We get it now. I’m not sure the younger generation is made the same way but that’s another story.
We have three have funds that seek to profit from this environment:

Important Disclosures
The information provided is for informational purposes only and investors should determine for themselves whether a particular service, security or product is suitable for their investment needs. The information contained herein is not complete, may not be current, is subject to change, and is subject to, and qualified in its entirety by, the more complete disclosures, risk factors and other terms that are contained in the disclosure, prospectus, and offering. Certain information herein has been obtained from third party sources and, although believed to be reliable, has not been independently verified and its accuracy or completeness cannot be guaranteed. No representation is made with respect to the accuracy, completeness or timeliness of this information. Nothing provided on this site constitutes tax advice. Individuals should seek the advice of their own tax advisor for specific information regarding tax consequences of investments. Investments in securities entail risk and are not suitable for all investors. This site is not a recommendation nor an offer to sell (or solicitation of an offer to buy) securities in the United States or in any other jurisdiction.
References to indexes and benchmarks are hypothetical illustrations of aggregate returns and do not reflect the performance of any actual investment. Investors cannot invest in an index and do not reflect the deduction of the advisor’s fees or other trading expenses. There can be no assurance that current investments will be profitable. Actual realized returns will depend on, among other factors, the value of assets and market conditions at the time of disposition, any related transaction costs, and the timing of the purchase. Indexes and benchmarks may not directly correlate or only partially relate to portfolios managed by SL Advisors as they have different underlying investments and may use different strategies or have different objectives than portfolios managed by SL Advisors (e.g. The Alerian index is a group MLP securities in the oil and gas industries. Portfolios may not include the same investments that are included in the Alerian Index. The S & P Index does not directly relate to investment strategies managed by SL Advisers.)
This site may contain forward-looking statements relating to the objectives, opportunities, and the future performance of the U.S. market generally. Forward-looking statements may be identified by the use of such words as; “believe,” “expect,” “anticipate,” “should,” “planned,” “estimated,” “potential” and other similar terms. Examples of forward-looking statements include, but are not limited to, estimates with respect to financial condition, results of operations, and success or lack of success of any particular investment strategy. All are subject to various factors, including, but not limited to general and local economic conditions, changing levels of competition within certain industries and markets, changes in interest rates, changes in legislation or regulation, and other economic, competitive, governmental, regulatory and technological factors affecting a portfolio’s operations that could cause actual results to differ materially from projected results. Such statements are forward-looking in nature and involves a number of known and unknown risks, uncertainties and other factors, and accordingly, actual results may differ materially from those reflected or contemplated in such forward-looking statements. Prospective investors are cautioned not to place undue reliance on any forward-looking statements or examples. None of SL Advisors LLC or any of its affiliates or principals nor any other individual or entity assumes any obligation to update any forward-looking statements as a result of new information, subsequent events or any other circumstances. All statements made herein speak only as of the date that they were made. r
Certain hyperlinks or referenced websites on the Site, if any, are for your convenience and forward you to third parties’ websites, which generally are recognized by their top level domain name. Any descriptions of, references to, or links to other products, publications or services does not constitute an endorsement, authorization, sponsorship by or affiliation with SL Advisors LLC with respect to any linked site or its sponsor, unless expressly stated by SL Advisors LLC. Any such information, products or sites have not necessarily been reviewed by SL Advisors LLC and are provided or maintained by third parties over whom SL Advisors LLC exercise no control. SL Advisors LLC expressly disclaim any responsibility for the content, the accuracy of the information, and/or quality of products or services provided by or advertised on these third-party sites.
All investment strategies have the potential for profit or loss. Different types of investments involve varying degrees of risk, and there can be no assurance that any specific investment will be suitable or profitable for a client’s investment portfolio.
Past performance of the American Energy Independence Index is not indicative of future returns.


Leave a Reply
Want to join the discussion?Feel free to contribute!