Oil And Pipelines Look Less Like Fred And Ginger

/
The outlook for crude prices is a frequent conversation topic among energy investors. We’re often asked for our thoughts – over the next several years we’re bullish as growing demand from developing economies competes with insufficient investment in new supply. But we don’t trade oil or reflect that outlook in portfolio construction.
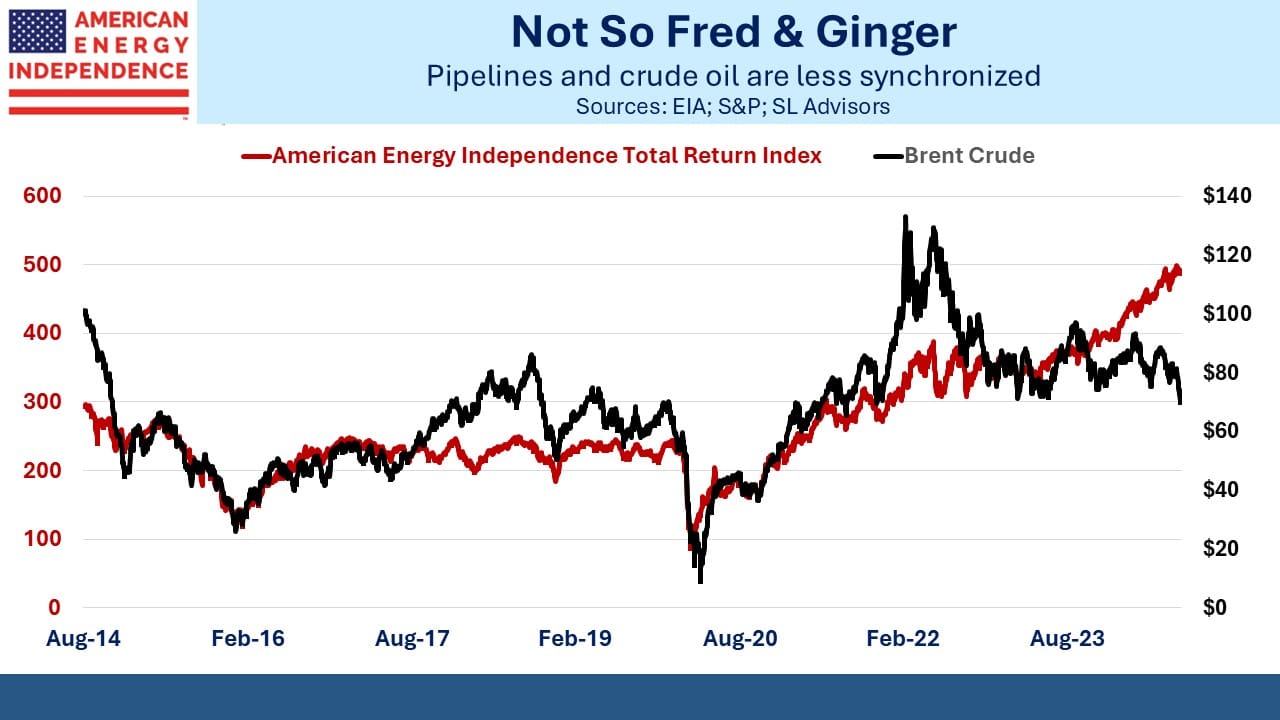
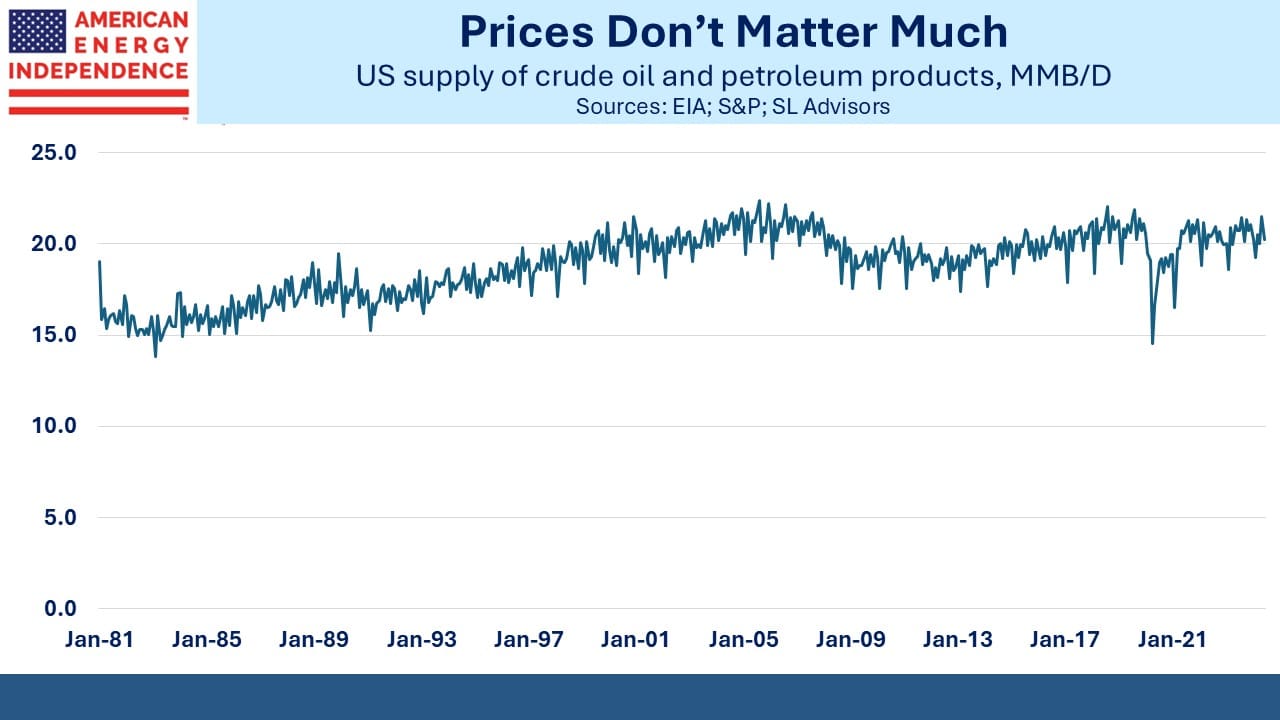
Crude oil and midstream are linked in the minds of many. Over the last decade they have often moved together. The price chart shows a very close visual relationship in years past. The original appeal of MLPs a decade or more ago was that they operated a “toll model”, indifferent to commodity prices and reliant on volumes. The quantity of oil and gas consumed in America fluctuates much less than its value.
The volume of crude oil and petroleum products supplied in the US has stayed remarkably stable for decades. We use around 20 Million Barrels per Day (MMB/D) with little regard for the economy other than the brief dip during the pandemic. This is why pipeline owners don’t spend much time worrying about the price of crude. Prices respond rapidly to changes in supply and demand and bring them back into alignment without much change in volumes.
Oil is heavily used in transportation. Economic slowdowns have little impact on the movement of people and goods. Lockdowns during covid did hurt demand and caused prices to collapse, but this was rare, and we can all hope that such loss of freedom will never be revisited on us again.
Interestingly, investors rarely consider the relationship between natural gas prices and pipeline stocks. There is no relationship – natural gas consumption for power demand and other purposes has been growing for years with little impact from prices.
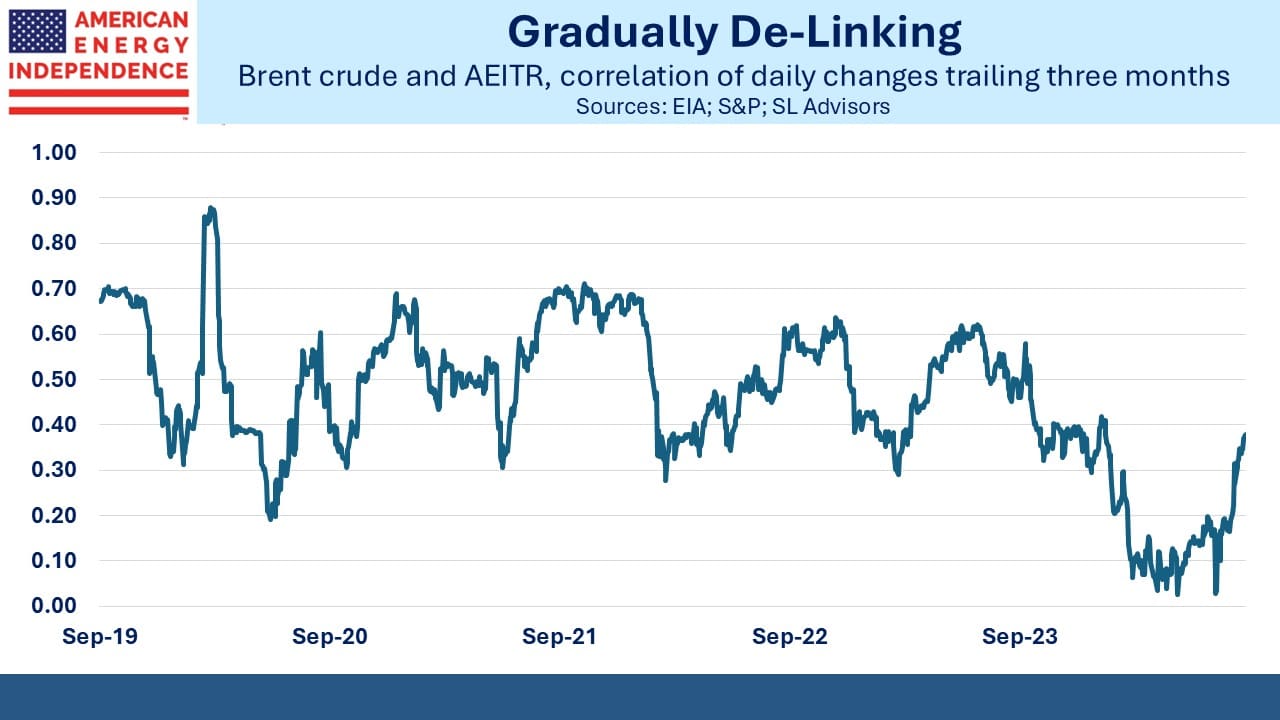
Crude prices and midstream stocks were searingly correlated in March 2020 when demand collapsed, oil prices went briefly negative and people stopped moving. The correlation (defined using daily changes over the prior three months) reached 0.87 on March 25th. It was unforgettable.
That day marked a peak in the relationship. Although both crude prices and midstream stocks recovered strongly from that low, the link has steadily weakened. The 80% rally in oil when inflation jumped in 2022 was not matched by the American Energy Independence Index (AEITR) although the inflation-linked contracts widely prevalent in the industry underpinned the sector’s 21% return that year.
The relationship continued to weaken, driven by falling leverage and capex among pipeline companies. Debt:EBITDA moved from 4-5X to 3-3.5X among most investment grade companies, a substantial reduction that made the stocks less risky. Capex came down as it became clear we mostly had the pipeline network we needed. Greenfield projects also ran into opposition from climate extremists such as the Sierra Club, whose ill-conceived policy prescriptions (anti-nuclear; anti US LNG exports to displace foreign use of coal) are helping drive global CO2 emissions higher.
The past three years of strong sector returns have come with little participation from oil, and the correlation has come close to zero at times this year. The recent jump above 0.30 is more reflective of a negatively correlated period dropping out of the past three months than of a changed relationship, as a visual inspection of recent price performance shows.
The weak relationship of recent years is the new normal, because the underpinnings of reduced leverage aren’t going away. Investors are increasingly able to assess the outlook without much regard for the price of oil, because it doesn’t matter that much. Oil and gas consumption will continue to grow, driven by developing economies.
This was vividly illustrated by a recent story about Indonesia’s challenges in reducing its coal consumption. Like many countries in Asia, coal is Indonesia’s biggest source of primary energy at 43% according to the Energy Institute’s Statistical Review of World Energy. Plans to replace some of the power generation derived from coal with renewables are running into problems because the government is worried that they won’t get enough financial support from rich countries like America to offset the increased cost.
Yes, renewables cost more, as is clear wherever they’re used. This is less of a problem than its consistent denial by climate extremists and others. Renewables cost more and they may be worth it depending on the consequent reduction in CO2 emissions. But they cost more, not less than our existing energy systems. Otherwise, we’d all be using solar and wind already and there wouldn’t be any need for subsidies.
Fuzzy thinking by climate policymakers is colliding with the reality of developing countries, in that they don’t want to pay more for energy. US LNG could solve this problem for Indonesia and others if opponents would get out of the way. We think pragmatism, inspired by the failure of today’s solar/wind obsession to meaningfully reduce global emissions, will eventually prevail.
We have three have funds that seek to profit from this environment:

Important Disclosures
The information provided is for informational purposes only and investors should determine for themselves whether a particular service, security or product is suitable for their investment needs. The information contained herein is not complete, may not be current, is subject to change, and is subject to, and qualified in its entirety by, the more complete disclosures, risk factors and other terms that are contained in the disclosure, prospectus, and offering. Certain information herein has been obtained from third party sources and, although believed to be reliable, has not been independently verified and its accuracy or completeness cannot be guaranteed. No representation is made with respect to the accuracy, completeness or timeliness of this information. Nothing provided on this site constitutes tax advice. Individuals should seek the advice of their own tax advisor for specific information regarding tax consequences of investments. Investments in securities entail risk and are not suitable for all investors. This site is not a recommendation nor an offer to sell (or solicitation of an offer to buy) securities in the United States or in any other jurisdiction.
References to indexes and benchmarks are hypothetical illustrations of aggregate returns and do not reflect the performance of any actual investment. Investors cannot invest in an index and do not reflect the deduction of the advisor’s fees or other trading expenses. There can be no assurance that current investments will be profitable. Actual realized returns will depend on, among other factors, the value of assets and market conditions at the time of disposition, any related transaction costs, and the timing of the purchase. Indexes and benchmarks may not directly correlate or only partially relate to portfolios managed by SL Advisors as they have different underlying investments and may use different strategies or have different objectives than portfolios managed by SL Advisors (e.g. The Alerian index is a group MLP securities in the oil and gas industries. Portfolios may not include the same investments that are included in the Alerian Index. The S & P Index does not directly relate to investment strategies managed by SL Advisers.)
This site may contain forward-looking statements relating to the objectives, opportunities, and the future performance of the U.S. market generally. Forward-looking statements may be identified by the use of such words as; “believe,” “expect,” “anticipate,” “should,” “planned,” “estimated,” “potential” and other similar terms. Examples of forward-looking statements include, but are not limited to, estimates with respect to financial condition, results of operations, and success or lack of success of any particular investment strategy. All are subject to various factors, including, but not limited to general and local economic conditions, changing levels of competition within certain industries and markets, changes in interest rates, changes in legislation or regulation, and other economic, competitive, governmental, regulatory and technological factors affecting a portfolio’s operations that could cause actual results to differ materially from projected results. Such statements are forward-looking in nature and involves a number of known and unknown risks, uncertainties and other factors, and accordingly, actual results may differ materially from those reflected or contemplated in such forward-looking statements. Prospective investors are cautioned not to place undue reliance on any forward-looking statements or examples. None of SL Advisors LLC or any of its affiliates or principals nor any other individual or entity assumes any obligation to update any forward-looking statements as a result of new information, subsequent events or any other circumstances. All statements made herein speak only as of the date that they were made. r
Certain hyperlinks or referenced websites on the Site, if any, are for your convenience and forward you to third parties’ websites, which generally are recognized by their top level domain name. Any descriptions of, references to, or links to other products, publications or services does not constitute an endorsement, authorization, sponsorship by or affiliation with SL Advisors LLC with respect to any linked site or its sponsor, unless expressly stated by SL Advisors LLC. Any such information, products or sites have not necessarily been reviewed by SL Advisors LLC and are provided or maintained by third parties over whom SL Advisors LLC exercise no control. SL Advisors LLC expressly disclaim any responsibility for the content, the accuracy of the information, and/or quality of products or services provided by or advertised on these third-party sites.
All investment strategies have the potential for profit or loss. Different types of investments involve varying degrees of risk, and there can be no assurance that any specific investment will be suitable or profitable for a client’s investment portfolio.
Past performance of the American Energy Independence Index is not indicative of future returns.


Leave a Reply
Want to join the discussion?Feel free to contribute!