Energy By The Numbers

/
I traveled from San Diego to Portland, OR last week and enjoyed a delicious wine pairing dinner in nearby Oswego with a group of investors. Oregon is wine country, and its residents are knowledgeable about varietals and vintages. I met some people who cultivate vines as a hobby and enjoy producing enough to fill a few five gallon jugs.
Over six courses and wines we discussed investments. Although we hold US and Canadian midstream companies, energy is a global business and many of the upside opportunities come from demand growth in emerging economies.
The Energy Institute Statistical Review of World Energy, formerly published by BP, is a rich source of data on global energy production, consumption and trade. It can be helpful to understand the broad trends at work in considering the future. An enduring theme concerns the energy transition, which pits the desire of rich, mainly OECD countries to reduce emissions against the drive for higher living standards common across emerging countries.
Per capita energy consumption and GDP are highly correlated. Billions of people want to live like Americans, and who can blame them? The Energy Institute (EI) estimates that 750 million people don’t have access to electricity to light their homes, refrigerate their food or run air conditioning. 2.6 billion people rely on wood, charcoal, coal or animal waste for heating and cooking. They want better.
In June Pakistan experienced a heatwave that sent thousands of people to hospital and killed hundreds.
Naturally it was blamed on climate change, as is every extreme weather event nowadays. Poorer countries are more vulnerable to a warmer climate, and yet the rational policy choice for Pakistanis is to buy more air conditioning, meaning more energy consumption. Only 6% of their electricity comes from solar and wind. That’s the problem.
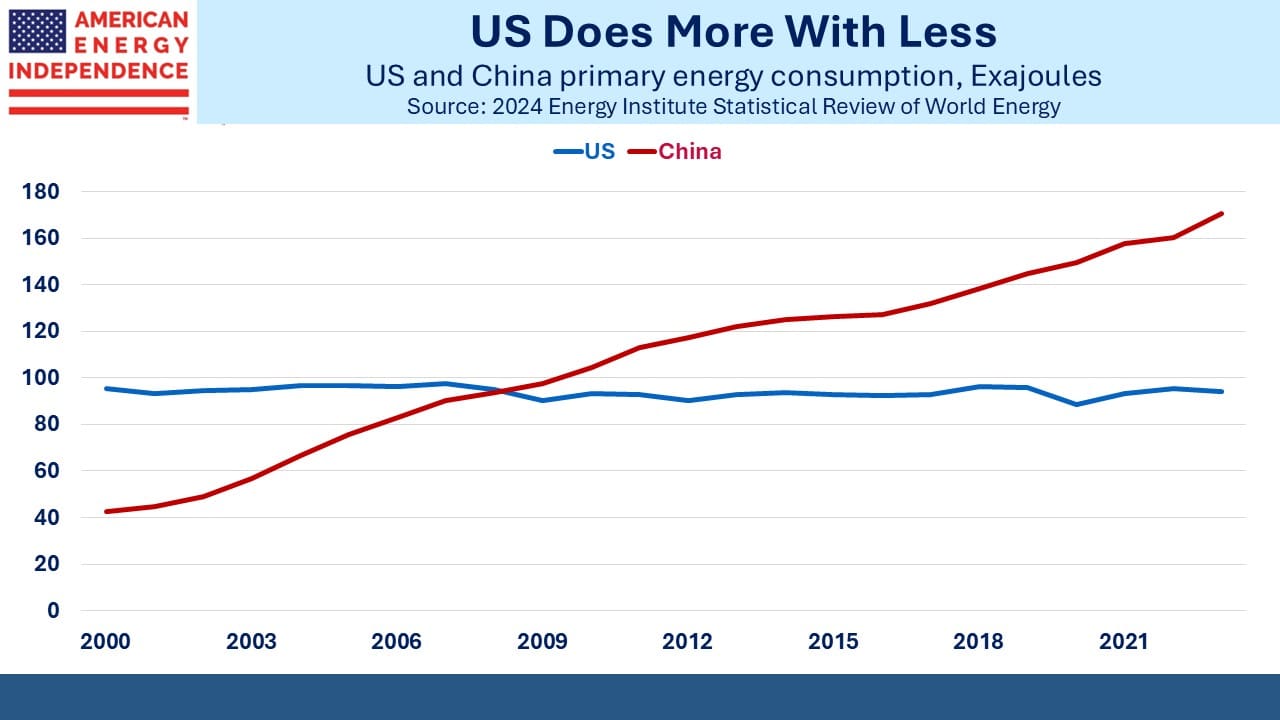
Comparing the US and China neatly captures the changes between rich and developing countries. China’s primary energy consumption passed the US in 2009, eight years after they joined the World Trade Organization, and has never looked back. China’s population is 4X the US. That reaching this milestone took so long is a testament to the penalty decades of communism imposed on its people until its leaders embraced their unique form of capitalism without democracy.
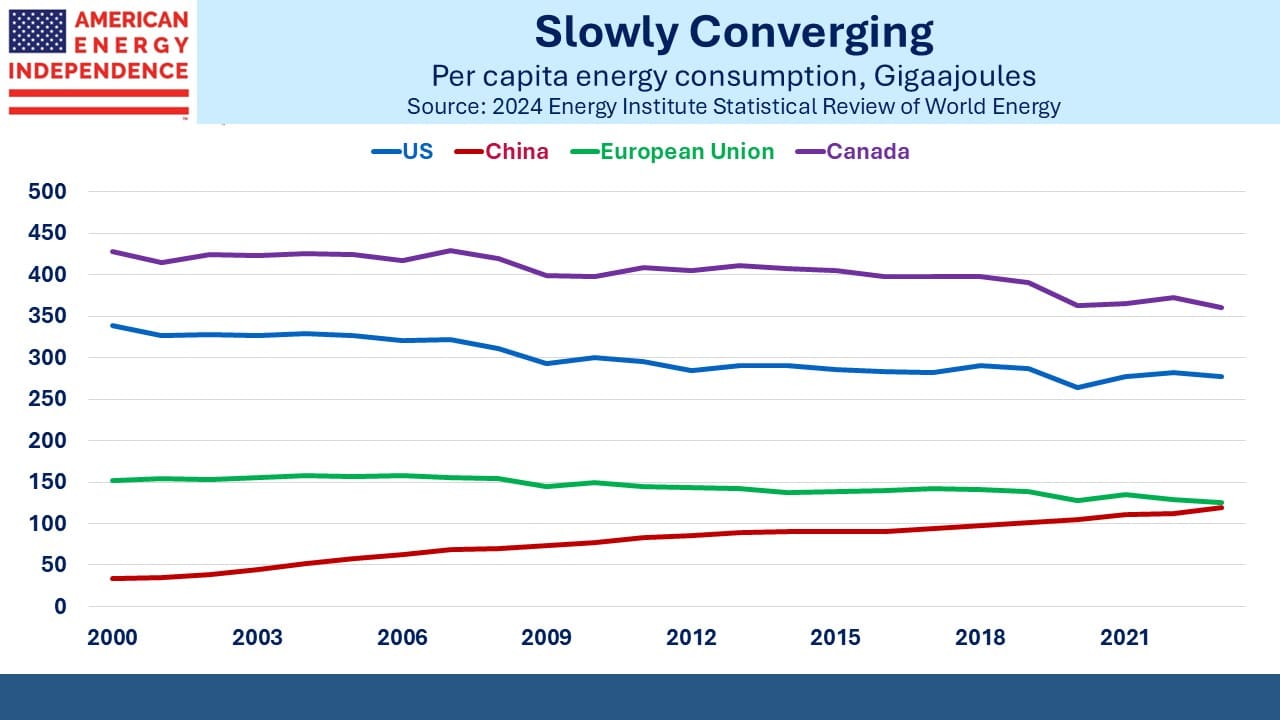
China’s per capita energy consumption remains less than half the US, which is among the world’s highest. Canada, which considers itself a leader on climate change, undercuts this claim since the typical Canadian uses 30% more energy than her American neighbor to the south. It’s because Canada is cold, with a relatively dispersed population which means more long journeys, and some energy-intensive industries such as pulp and paper along with oil and gas production.
It’s notable that China’s per capita energy consumption is now the same as the EU, with each series moving in opposite directions. The calculation is simply energy used divided by population. As OECD countries outsource manufacturing to developing ones it can flatter their emissions. But Germany is also de-industrializing as companies flee restrictive energy policies with some of the world’s highest prices.
In the trade-off between emissions reduction and GDP growth, China and the EU have opposing priorities.
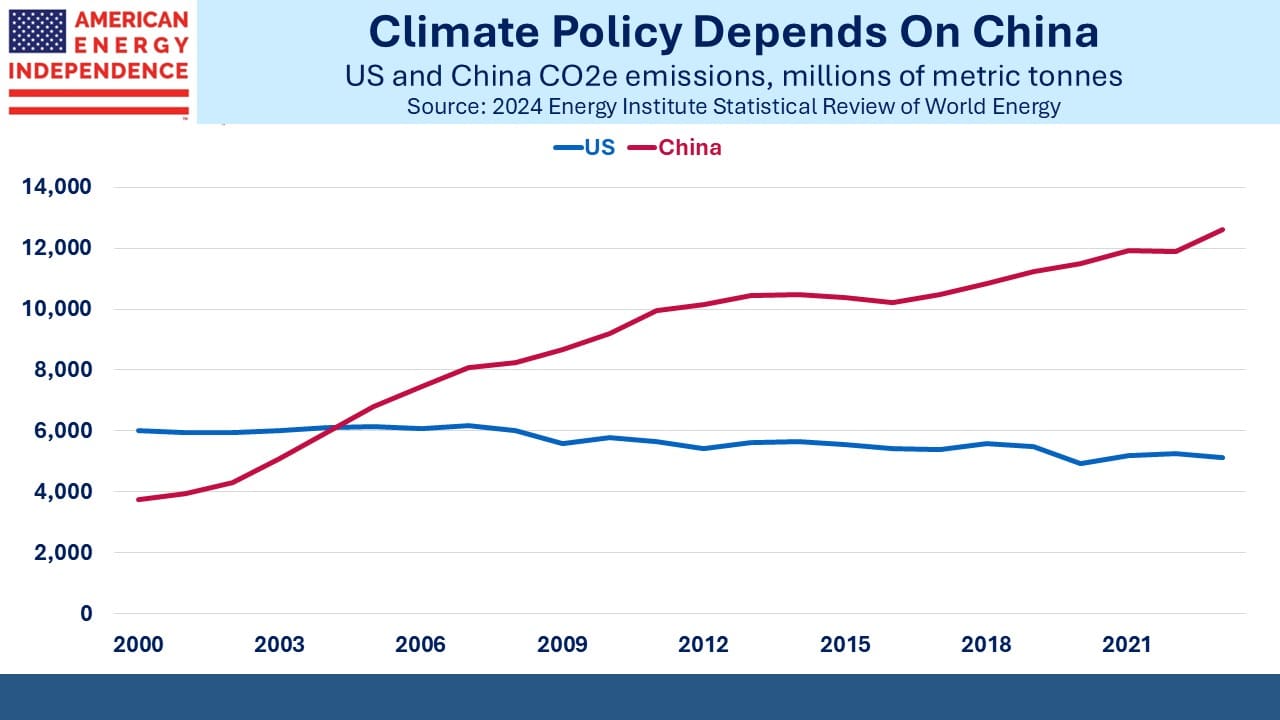
China’s total Greenhouse Gas Emissions (GHGs) passed the US in 2004. Former White House Climate Czar John Kerry used to praise China’s efforts on climate change because of their enormous investments in solar and wind. These intermittent sources provide almost twice as much primary energy as in the US. But everything about China’s energy sector is huge. They burn 56% of the world’s coal, more than 11X the US.
China’s energy policies are better viewed from the standpoint of energy security rather than the energy transition. They are reducing their dependence on foreign-sourced crude oil, because when the inevitable conflict over Taiwan happens their imports will be vulnerable to western sanctions.
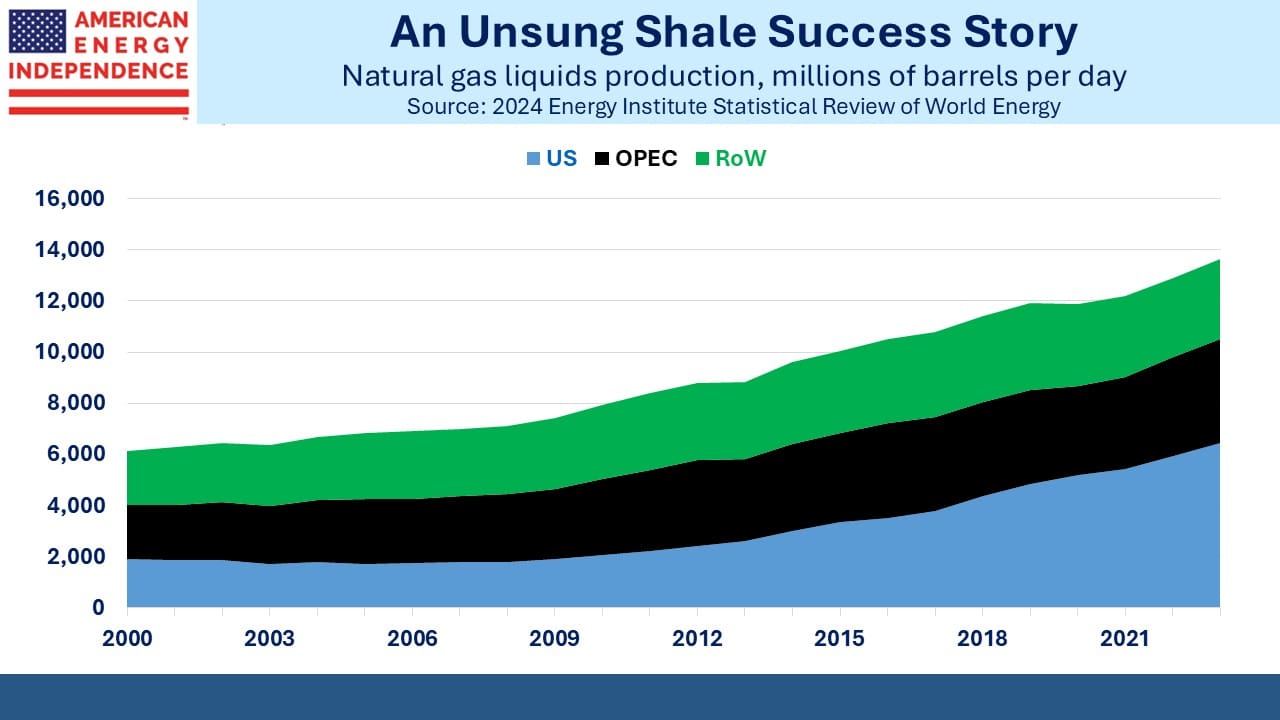
An area that gets too little attention is the enormous growth in US production of Natural Gas Liquids (NGLs). Think ethane (used to manufacture plastics) or propane (used for crop drying and in your outdoor gas grill, and for restaurants in places like Naples, FL that are unserved by natural gas).
US NGL output has grown at 9.5% pa over the past decade. We now produce almost half (47%) the NGLs in the world, up from 29% a decade ago. We export around 1.7 Million Barrels per Day of propane. Japan and China are the two biggest markets, together taking around 40% of exports.
None of this would have happened without fracking and the shale revolution. This in turn was made possible by privately owned mineral rights, a uniquely American concept that allows landowner and driller to negotiate, regulated and taxed by the state. It’s brought us to energy independence.
Another reason why this is a great country.
We have three have funds that seek to profit from this environment:

Important Disclosures
The information provided is for informational purposes only and investors should determine for themselves whether a particular service, security or product is suitable for their investment needs. The information contained herein is not complete, may not be current, is subject to change, and is subject to, and qualified in its entirety by, the more complete disclosures, risk factors and other terms that are contained in the disclosure, prospectus, and offering. Certain information herein has been obtained from third party sources and, although believed to be reliable, has not been independently verified and its accuracy or completeness cannot be guaranteed. No representation is made with respect to the accuracy, completeness or timeliness of this information. Nothing provided on this site constitutes tax advice. Individuals should seek the advice of their own tax advisor for specific information regarding tax consequences of investments. Investments in securities entail risk and are not suitable for all investors. This site is not a recommendation nor an offer to sell (or solicitation of an offer to buy) securities in the United States or in any other jurisdiction.
References to indexes and benchmarks are hypothetical illustrations of aggregate returns and do not reflect the performance of any actual investment. Investors cannot invest in an index and do not reflect the deduction of the advisor’s fees or other trading expenses. There can be no assurance that current investments will be profitable. Actual realized returns will depend on, among other factors, the value of assets and market conditions at the time of disposition, any related transaction costs, and the timing of the purchase. Indexes and benchmarks may not directly correlate or only partially relate to portfolios managed by SL Advisors as they have different underlying investments and may use different strategies or have different objectives than portfolios managed by SL Advisors (e.g. The Alerian index is a group MLP securities in the oil and gas industries. Portfolios may not include the same investments that are included in the Alerian Index. The S & P Index does not directly relate to investment strategies managed by SL Advisers.)
This site may contain forward-looking statements relating to the objectives, opportunities, and the future performance of the U.S. market generally. Forward-looking statements may be identified by the use of such words as; “believe,” “expect,” “anticipate,” “should,” “planned,” “estimated,” “potential” and other similar terms. Examples of forward-looking statements include, but are not limited to, estimates with respect to financial condition, results of operations, and success or lack of success of any particular investment strategy. All are subject to various factors, including, but not limited to general and local economic conditions, changing levels of competition within certain industries and markets, changes in interest rates, changes in legislation or regulation, and other economic, competitive, governmental, regulatory and technological factors affecting a portfolio’s operations that could cause actual results to differ materially from projected results. Such statements are forward-looking in nature and involves a number of known and unknown risks, uncertainties and other factors, and accordingly, actual results may differ materially from those reflected or contemplated in such forward-looking statements. Prospective investors are cautioned not to place undue reliance on any forward-looking statements or examples. None of SL Advisors LLC or any of its affiliates or principals nor any other individual or entity assumes any obligation to update any forward-looking statements as a result of new information, subsequent events or any other circumstances. All statements made herein speak only as of the date that they were made. r
Certain hyperlinks or referenced websites on the Site, if any, are for your convenience and forward you to third parties’ websites, which generally are recognized by their top level domain name. Any descriptions of, references to, or links to other products, publications or services does not constitute an endorsement, authorization, sponsorship by or affiliation with SL Advisors LLC with respect to any linked site or its sponsor, unless expressly stated by SL Advisors LLC. Any such information, products or sites have not necessarily been reviewed by SL Advisors LLC and are provided or maintained by third parties over whom SL Advisors LLC exercise no control. SL Advisors LLC expressly disclaim any responsibility for the content, the accuracy of the information, and/or quality of products or services provided by or advertised on these third-party sites.
All investment strategies have the potential for profit or loss. Different types of investments involve varying degrees of risk, and there can be no assurance that any specific investment will be suitable or profitable for a client’s investment portfolio.
Past performance of the American Energy Independence Index is not indicative of future returns.


Hi Simon:
There is natural gas in Naples, at least in our community. In fact I have a natural gas generator.
Elliot