Climate Change: Prevention or Mitigation?
Last week the northeast US suffered 52 deaths as Hurricane Ida (by then a tropical storm) dumped up to ten inches of rain in just a few hours. Cranford, NJ on the Rahway River is prone to flooding. It’s a couple of miles from Westfield, GHQ for SL Advisors, and it seems like every decade or so hundreds of basements are flooded in those homes close to the river. Garwood is another small neighboring town and source of the striking photos below.
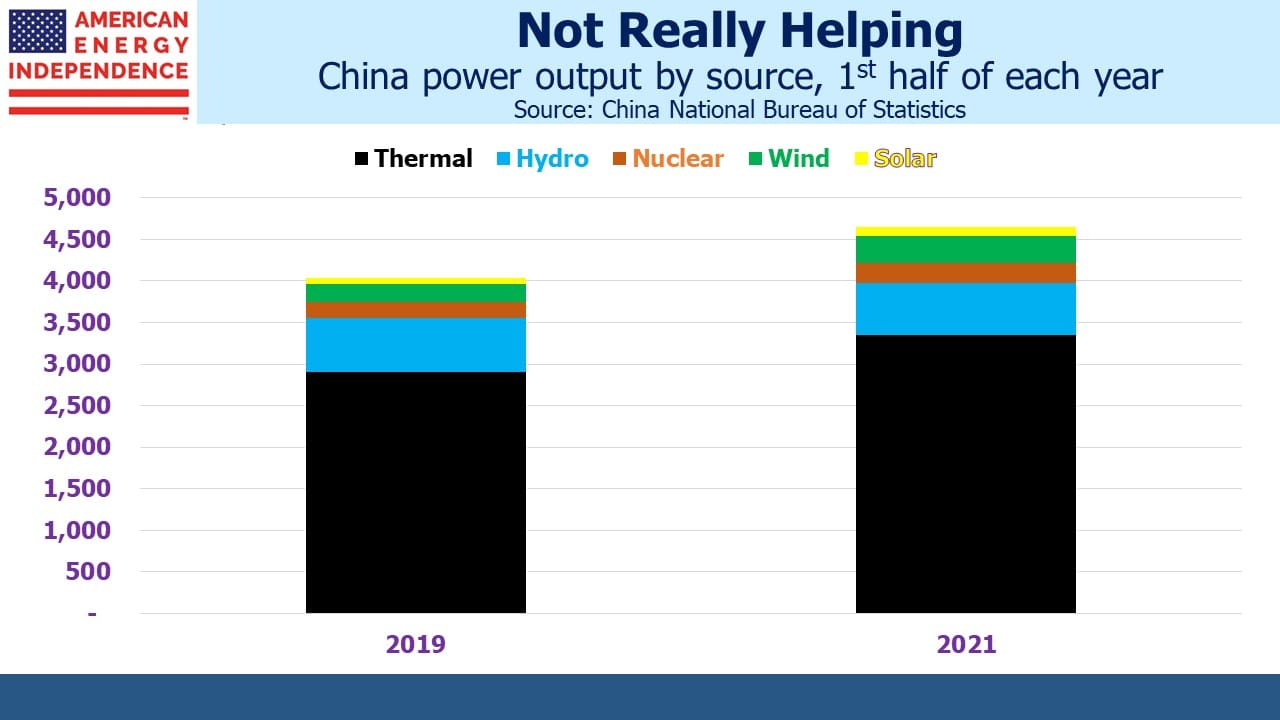
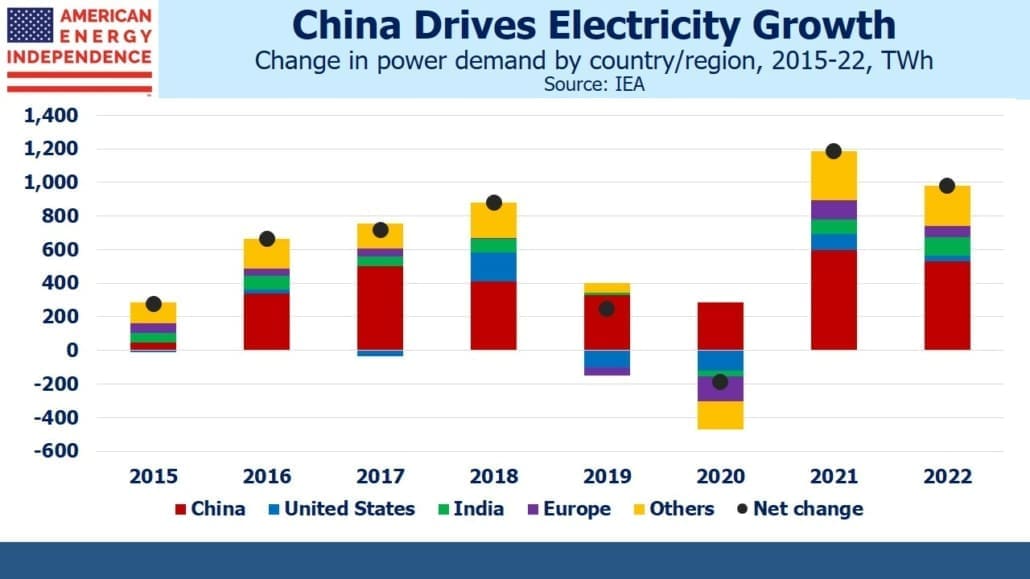
Seemingly unrelated to the heartbreaking losses caused by Ida, journalist John Kemp noted China’s continued reliance on coal for power generation, which has experienced a Compound Annual Growth Rate (CAGR) of 5% over the past two years. Since Covid caused a drop last year, this highlights the strong underlying trend. Coal futures on the Zhengzhou Commodity Exchange recently traded at $150 per tonne, compared with $85 a year ago. The market is signaling more demand for coal.
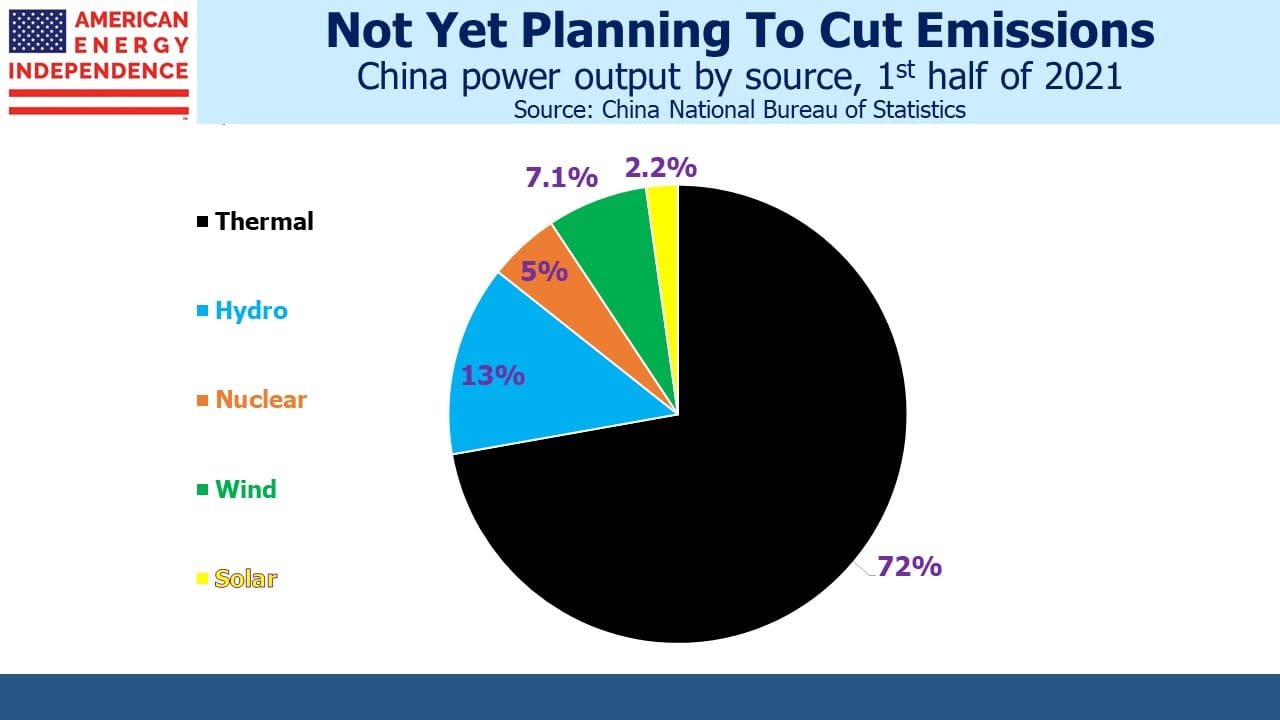
Apologists for China herald the 25% CAGR for wind power over this time, and 24% for solar. Hydro output dropped slightly. Don’t be fooled. Thermal power, which is mostly coal since China burns half the world’s output, still provides 72% of China’s electricity as was the case two years ago. Thermal power also met 72% of the increase in demand, hence its static share of the total.
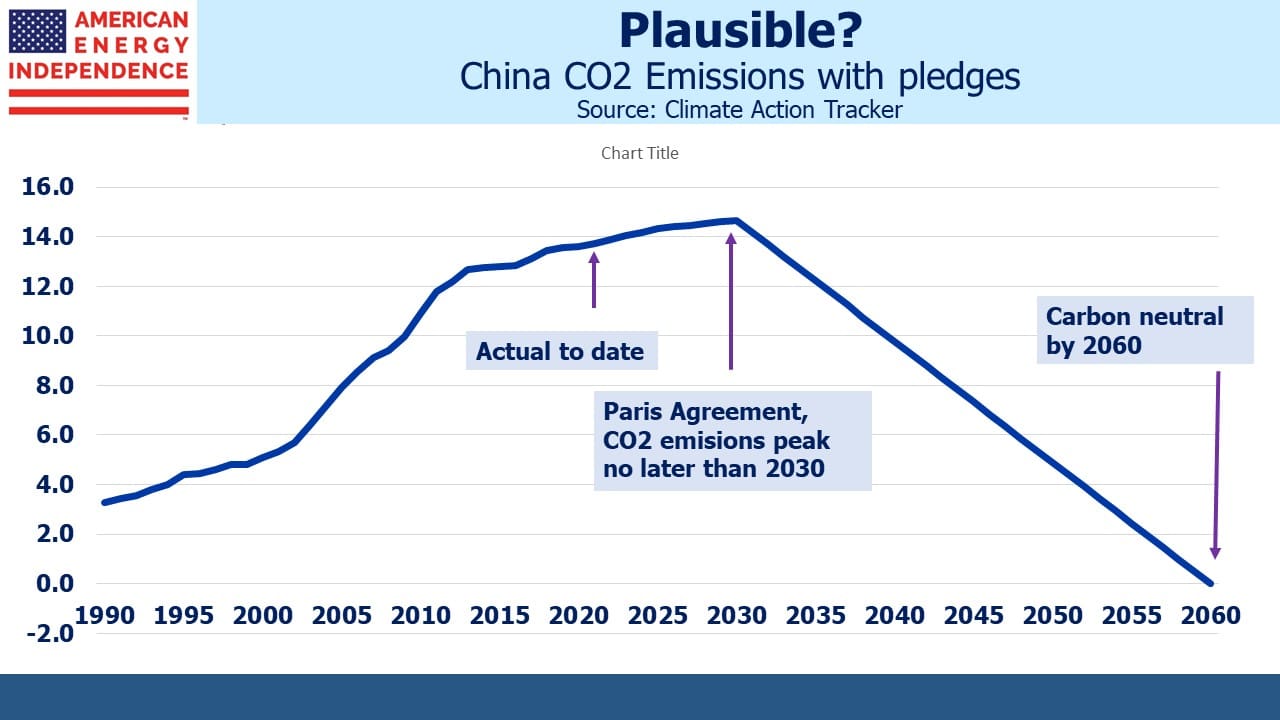
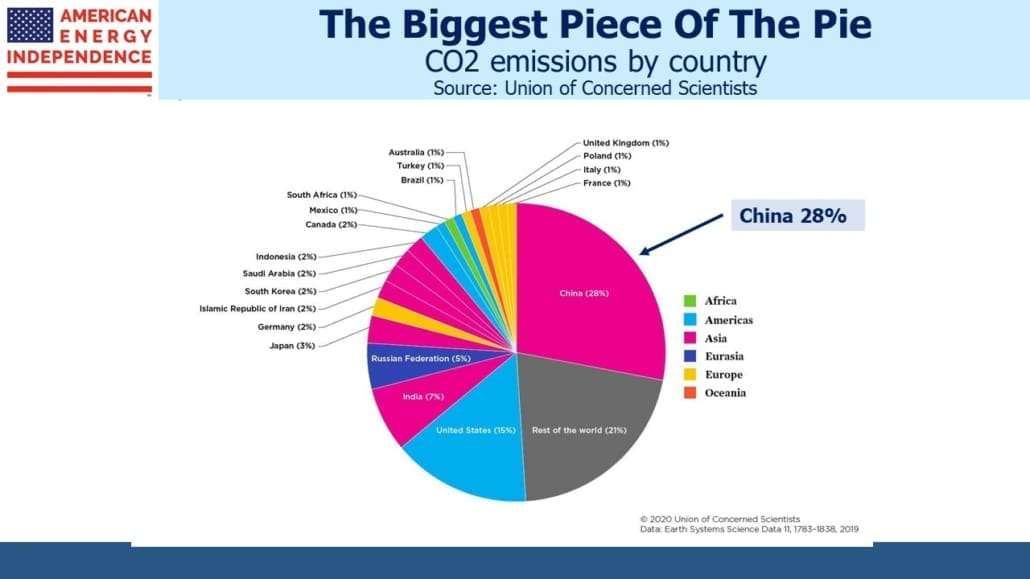
This is why China generates 28% of global CO2 emissions. It plans to continue increasing at least through 2030 before reversing course on an improbable path to zero by 2060 (see Is China Worried About Global Warming?).
Here’s why China’s power output is linked to flooded towns in New Jersey. Ads for solar panels are everywhere, because of generous state and Federal subsidies. As a result, New Jersey electricity customers have so far paid $3BN in higher fees to help pay for solar installations. Future tax breaks for solar are expected to add $800 million annually to utility customers’ bills, rising to $1.4BN by 2030.
Hurricane Ida may or may not be a consequence of climate change. The media interprets every weather fluctuation as caused by global warming. The UN’s report earlier this summer warned of more extreme weather events but attributing any single event to the one degree Celsius increase since the 1850s is impossible.
Nonetheless, if you’re pumping water from your Cranford basement, as you do every decade or so, proliferating subsidized solar panels aren’t much use. Living in a solidly blue state, you’re probably convinced that global warming will cause even more frequent flooding. Having long ago rejected the wholly sensible idea of moving to higher ground, you might like those solar panel subsidies redirected towards improved infrastructure to stop the Rahway River from bursting its banks. Users of the New York City subway would favor mitigation of the sudden indoor waterfalls we saw on news reports and social media.
The widely reported efforts by rich countries to blanket the landscape with solar panels and windmills aren’t having any noticeable impact on global CO2 emissions. Implementation carries local costs while any benefits are shared globally. Californians can feel good about their efforts to shut down natural gas plants, even though it results in more expensive and less reliable electricity. They still get forest fires. New Yorkers may support constraints on new natural gas connections. The subway still had to shut down because of flooding.
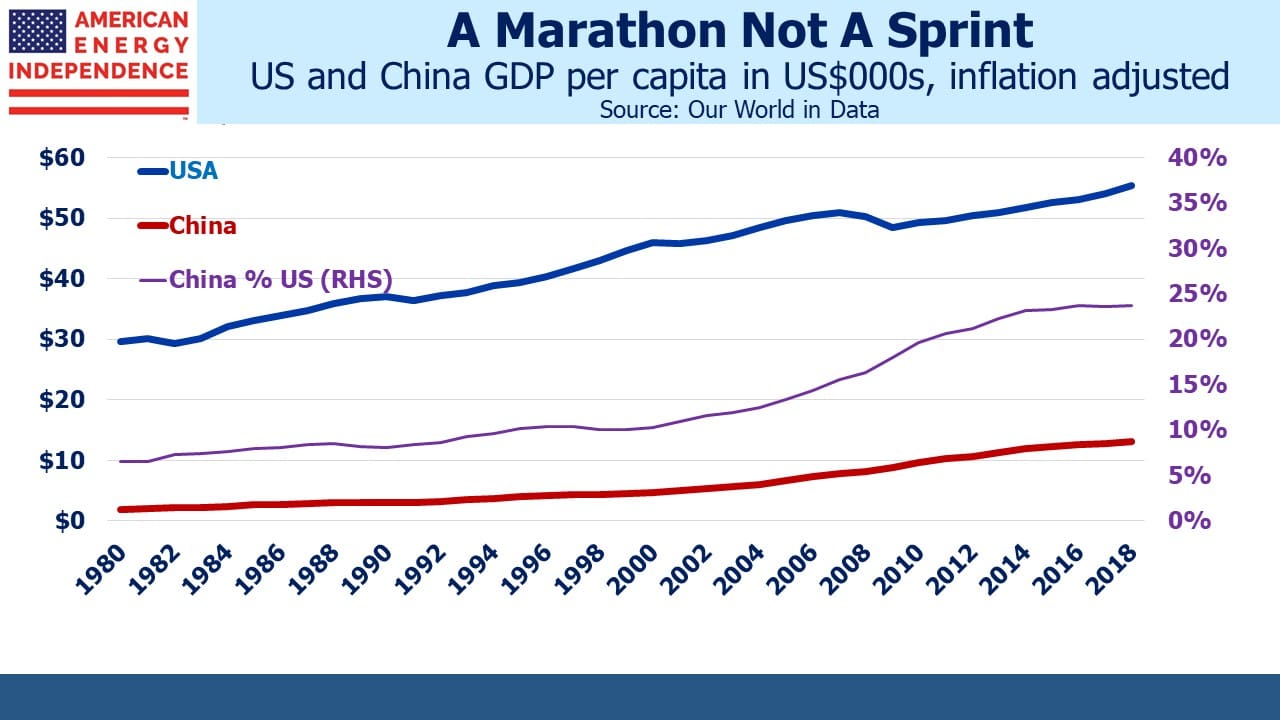
We may already be experiencing the climate changing effects of a warmer planet. If so, at some point there’s a valid choice between prevention and adaptation. None of us can control the planet’s CO2 levels. But every community can fortify itself again extreme weather events. The quest to lower emissions is a global social undertaking that relies on widespread participation. It requires community spirit on a worldwide scale. The free-rider problem is likely fatal to success. China is only the most visible emerging economy exploiting this – the world’s biggest producer of solar panels, which it sells to dozens of countries, is also the #1 consumer of coal and generates over a quarter of global CO2 emissions.
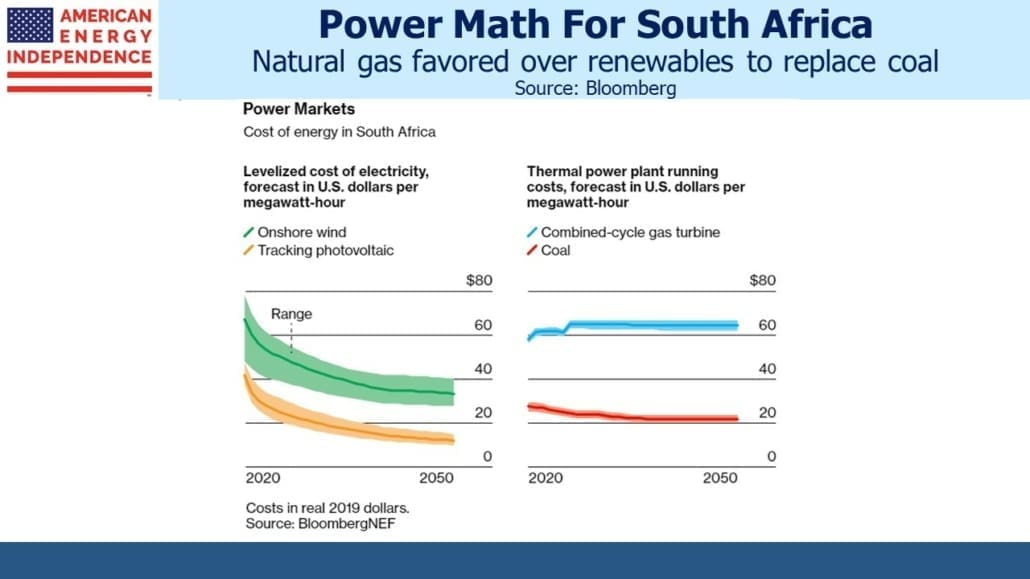
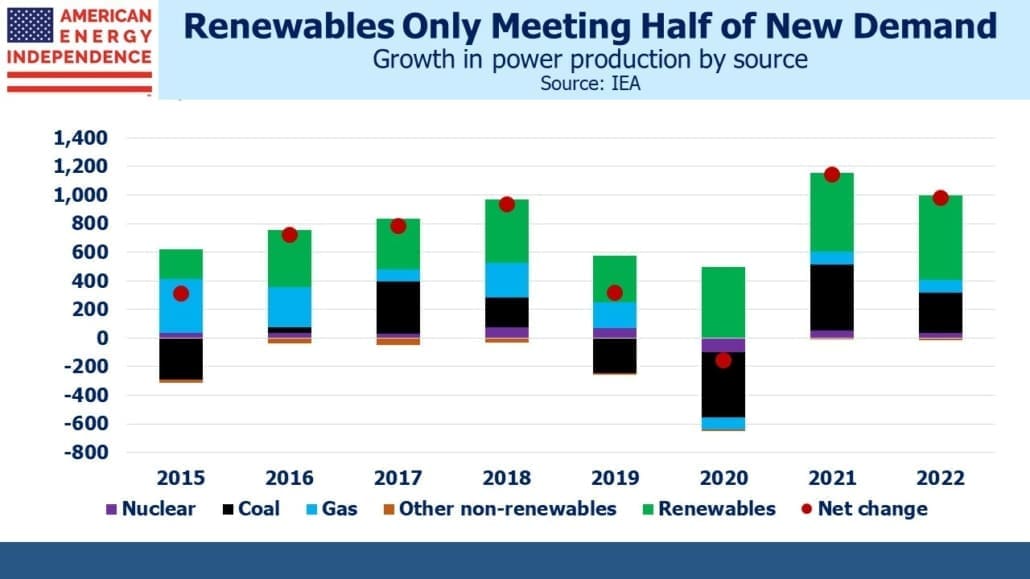
The energy transition has lots of momentum. Shifting from coal to natural gas remains the world’s most assured path to reduced emissions. Nonetheless, China’s increase in wind and solar only met 25% of the additional demand for power since 2019. The desire of rich countries to lower emissions remains in conflict with emerging economies’ intention to raise living standards by using more energy.
This misalignment of interests means that eventually a sea wall will be more useful than a windmill. That time is coming.


