Pipeline Cashflows Continue Higher
Covid accelerated a trend already in place in the U.S. energy sector, which is to grow Free Cash Flow (FCF) rather than production. Chevron’s Investor Day last week promised 10% annual increase in FCF through 2025. This return to shareholder-friendly metrics is attracting investors – including recently Berkshire Hathaway.
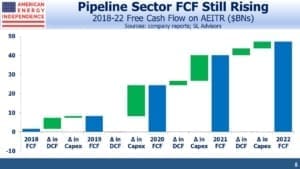
Midstream energy infrastructure has grasped this as readily as their upstream E&P customers. Full year 2020 earnings have been reported. The companies in the American Energy Independence Index, the best representation of the North American pipeline industry, grew FCF to $25BN last year. This is almost three times their 2019 performance, a result that seemed implausible a year ago when Covid drove panic selling.
Continued reductions in growth capex are the reason – Distributable Cash Flow (DCF), equivalent to cash from operations minus maintenance capex, was flat last year. Pre-Covid, DCF was expected to increase from $54BN to $60BN, but Enbridge (ENB), Enterprise Products Partners (EPD), Kinder Morgan (KMI) and TC Energy (TRP) each came in $1BN or more below target. However, capex reductions were widespread during the year, and these largely offset the drop in DCF which is why FCF came in around target.
The result is the bridge chart shown below, which continues to track a path towards higher FCF for the industry. On current trends we should exit 2021 with a FCF yield of over 10%, more than twice the S&P500. Having rallied so far, one might conclude that the sector’s mis-valuation prevailing last year has been eliminated. The FCF yield shows this isn’t the case.
The biggest single variable in the industry’s capex figures is Enbridge’s planned replacement of Line 3. This is a 1,000 mile crude oil pipeline oroginally built in the 1960s that runs from Edmonton, Alberta to Superior, Wisconsin. Canada has long struggled to find economic ways to get its crude oil to market. The proposed new pipeline will more than double capacity, from the current 370 thousand barrels a day (MB/D) to 760 MB/D. ENB recently raised the estimated total cost of this project by almost $1BN, to $7.3BN.
Predictably, environmental extremists are opposing the pipeline, although it’s a safe bet that they drive regularly, including to their protests. With Biden having canceled the Keystone XL project shortly after his inauguration, the Line 3 Replacement (L3R) has become a new target. So far, ENB and most analysts expect the project to proceed. Our estimate of 2021 growth capex for the industry is $4.5BN higher than we forecast in December; $3.5BN of this relates to L3R.
For 2022 and beyond, the pipeline sector is on track to further reduce growth capex.
Energy executives provided quarterly updates over the past few weeks, which included updating their capex guidance. On the energy transition, typically they acknowledge it and have plans to reduce their company’s carbon footprint. The prevailing view is that global energy consumption will increase for all forms of energy, including oil and gas.
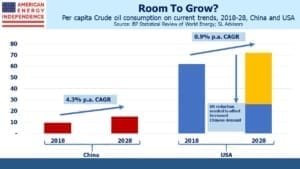
Consider the following: China’s oil consumption is about two thirds the U.S. But China’s per capita consumption is only 15% of the U.S. Its population is growing at around 0.4% p.a., versus about 0.6% for the U.S. China’s per capita consumption of crude is growing at 4.3%, and total consumption at 4.7%.
If China’s per capita oil consumption grows over the next decade at the same rate as it has for the past five years, China would be consuming more than the U.S. if we kept consumption flat. If the U.S. wanted to lower consumption to offset China’s growth, our per capita consumption would need to fall by almost 10% p.a. Currently it’s growing at 0.9%.
Even in this implausible scenario, crude oil consumption is unchanged – it’s simply shifted from the U.S. to China.
This is the daunting math that confronts efforts to reduce emissions. Electric vehicle penetration is higher in China, and they drive around a quarter as many miles as Americans. But 1.4 billion Chinese striving for western living standards is going to require a big adjustment from 330 million Americans, if crude oil consumption and emissions are to fall.
There are many more variables to consider, but this simple example illustrates why Exxon Mobil and Chevron think oil still has a future.
We are invested in all the components of the American Energy Independence Index via the ETF that seeks to track its performance.
Important Disclosures
The information provided is for informational purposes only and investors should determine for themselves whether a particular service, security or product is suitable for their investment needs. The information contained herein is not complete, may not be current, is subject to change, and is subject to, and qualified in its entirety by, the more complete disclosures, risk factors and other terms that are contained in the disclosure, prospectus, and offering. Certain information herein has been obtained from third party sources and, although believed to be reliable, has not been independently verified and its accuracy or completeness cannot be guaranteed. No representation is made with respect to the accuracy, completeness or timeliness of this information. Nothing provided on this site constitutes tax advice. Individuals should seek the advice of their own tax advisor for specific information regarding tax consequences of investments. Investments in securities entail risk and are not suitable for all investors. This site is not a recommendation nor an offer to sell (or solicitation of an offer to buy) securities in the United States or in any other jurisdiction.
References to indexes and benchmarks are hypothetical illustrations of aggregate returns and do not reflect the performance of any actual investment. Investors cannot invest in an index and do not reflect the deduction of the advisor’s fees or other trading expenses. There can be no assurance that current investments will be profitable. Actual realized returns will depend on, among other factors, the value of assets and market conditions at the time of disposition, any related transaction costs, and the timing of the purchase. Indexes and benchmarks may not directly correlate or only partially relate to portfolios managed by SL Advisors as they have different underlying investments and may use different strategies or have different objectives than portfolios managed by SL Advisors (e.g. The Alerian index is a group MLP securities in the oil and gas industries. Portfolios may not include the same investments that are included in the Alerian Index. The S & P Index does not directly relate to investment strategies managed by SL Advisers.)
This site may contain forward-looking statements relating to the objectives, opportunities, and the future performance of the U.S. market generally. Forward-looking statements may be identified by the use of such words as; “believe,” “expect,” “anticipate,” “should,” “planned,” “estimated,” “potential” and other similar terms. Examples of forward-looking statements include, but are not limited to, estimates with respect to financial condition, results of operations, and success or lack of success of any particular investment strategy. All are subject to various factors, including, but not limited to general and local economic conditions, changing levels of competition within certain industries and markets, changes in interest rates, changes in legislation or regulation, and other economic, competitive, governmental, regulatory and technological factors affecting a portfolio’s operations that could cause actual results to differ materially from projected results. Such statements are forward-looking in nature and involves a number of known and unknown risks, uncertainties and other factors, and accordingly, actual results may differ materially from those reflected or contemplated in such forward-looking statements. Prospective investors are cautioned not to place undue reliance on any forward-looking statements or examples. None of SL Advisors LLC or any of its affiliates or principals nor any other individual or entity assumes any obligation to update any forward-looking statements as a result of new information, subsequent events or any other circumstances. All statements made herein speak only as of the date that they were made. r
Certain hyperlinks or referenced websites on the Site, if any, are for your convenience and forward you to third parties’ websites, which generally are recognized by their top level domain name. Any descriptions of, references to, or links to other products, publications or services does not constitute an endorsement, authorization, sponsorship by or affiliation with SL Advisors LLC with respect to any linked site or its sponsor, unless expressly stated by SL Advisors LLC. Any such information, products or sites have not necessarily been reviewed by SL Advisors LLC and are provided or maintained by third parties over whom SL Advisors LLC exercise no control. SL Advisors LLC expressly disclaim any responsibility for the content, the accuracy of the information, and/or quality of products or services provided by or advertised on these third-party sites.
All investment strategies have the potential for profit or loss. Different types of investments involve varying degrees of risk, and there can be no assurance that any specific investment will be suitable or profitable for a client’s investment portfolio.
Past performance of the American Energy Independence Index is not indicative of future returns.


Leave a Reply
Want to join the discussion?Feel free to contribute!