Pipeline Investors Are Being Rewarded

I spent the last couple of days visiting clients in central Florida, which is why this blog post is a day later than normal. The gradual return of in-person meetings is a welcome reminder that we’re moving on from Covid. Floridians are happy with how their state handled the virus, often noting that business has been more or less as usual for months’ longer than other parts of the country. Bloomberg even declared Florida and its governor Ron DeSantis “the pandemic winner.” At one hotel in Orlando where masks were not required, a guest wearing a mask entered the elevator and apologized for wearing one once he saw me standing there unmasked (I’ve been vaccinated).

It’s still hard to believe that a year ago New Jersey even forbade a solitary walk in the park or woods. The loss of freedom was breathtaking. It prompted my wife and me to travel south at the earliest possible opportunity (see Having a Better Pandemic in Charleston, SC).

Since then NJ adopted a mixture of guidelines and rules which allowed residents to select which ones to follow. For example, the advice to New Jerseyans to avoid non-essential travel was widely ignored based on the crowds I regularly saw at Newark airport during the winter.

Americans are increasingly done worrying about Covid. Abundant fiscal stimulus on top of the vaccine-enabled economic recovery are driving the market higher.

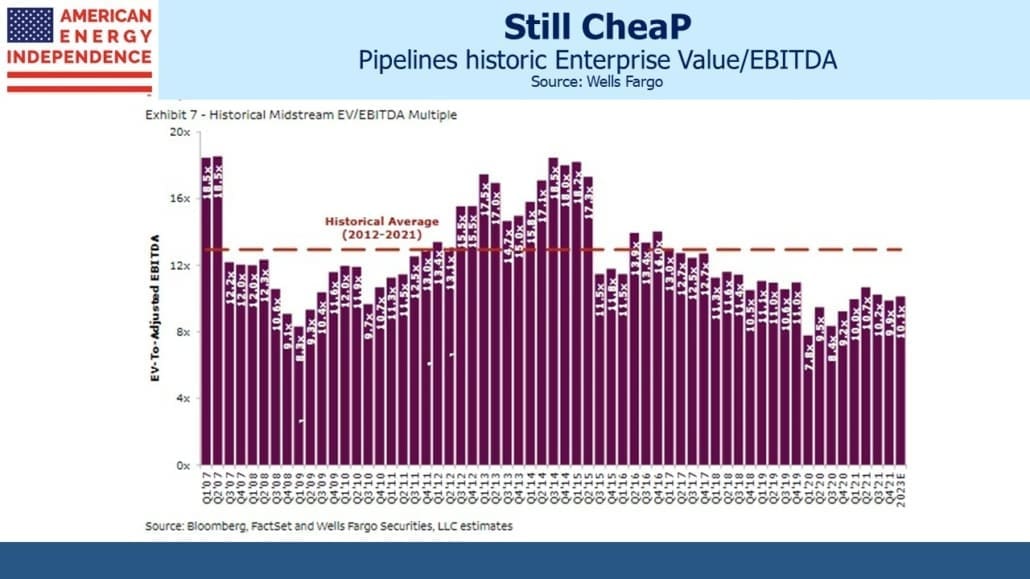
For most equity sectors other than energy, investors often appear more concerned about missing out on a profitable trade than losing money. By contrast, the pipeline sector has not been overly burdened with FOMO buyers for some time – a feature that investors find attractive. It is one of the very few areas of the market that can still be called cheap.

1Q earnings were good, with many positive surprises and guidance revised upwards. The Texas power cut provided windfall gains for Energy Transfer, Kinder Morgan and Enterprise Products Partners. Every company has something to say about the energy transition.

Following earnings we updated our Free Cash Flow (FCF) bridge chart. It’s virtually unchanged from the prior quarter. We expect FCF to continue on its strong growth path. Investors are beginning to embrace this view, which is why the American Energy independence index (AEITR) is up 35% YTD.

FCF is a metric that applies to any equity sector, and it’s becoming the most used measure of results on earnings calls. The Shale Revolution turned out to be an investment bust. Fears of stranded assets due to the energy transition grew in recent years, and the Covid-driven collapse in oil demand a year ago was the third body blow to sentiment. Since then, demand has recovered and growth capex has dropped.

The FCF yield on AEITR is 11% using YE 2021 figures, and we expect it to grow further next year. This puts it at 2X the S&P500. Median Debt:EBITDA is now down to 4X, and we’re finding investors are increasingly drawn to the operating stability, strengthening balance sheets and growing FCF they see. Fund flows (i.e. mutual funds, ETFs and other exchange traded products) are turning positive from our vantage point. Yields of close to 7% are too high for the risk so offer the potential for capital appreciation on top of attractive income.

Energy companies are investing less back into their businesses. This is true for upstream as well as midstream, and is the most important factor driving FCF higher. Improved financial strength will allow some use of debt to finance reduced growth capex while maintaining prudent Debt:EBITDA levels. If a CFO is happy at 4X, a new project that generates, say, $100MM in additional EBITDA can justify being financed with $400MM in debt, maintaining the 4X ratio.

We have modified the FCF bridge chart to reflect this, assuming roughly half of future growth capex will be debt-financed. Each company’s actual financing choices will differ, but the effect is to reduce by 50% the portion of growth capex funded by internally generated cash, which in turn drives FCF even higher.

Comparing the two versions of the FCF bridge chart reveals additional potential FCF upside in this scenario.

It’s an outlook that is resonating with investors who take the time to consider recent progress. My meetings were by definition with a self-selected group of midstream investors, but most found it refreshing to look at a sector that’s rising yet remains cheap.

Inflation is also causing more concern. Pipeline stocks have marched higher along with treasury yields, a link that makes sense given energy’s responsiveness to faster GDP growth and higher oil and gas prices. The possibility of using pipeline investment as a source of income that should benefit from further rises in bond yields and inflation expectations was found intriguing.

We are invested in all the components of the American Energy Independence Index via the ETF that seeks to track its performance.


Pipelines Will Last Longer Than Equity Prices Imply

An enduring dichotomy in the valuation of midstream energy infrastructure companies has been the sharply different outlooks implied by debt versus equity pricing. Dividend yields of 6-7% suggest equity investors don’t regard their payouts as being sustainable indefinitely. Contrast that with investors in long term bonds, who accept yields of under 4% that can only be justified by a far more optimistic outlook about asset longevity. One camp presumably thinks the energy transition will leave pipeline companies with stranded assets, and the other believes the transition will not have harmed their prospects of principal repayment over the next three decades.

Equity investors probably don’t use years of remaining useful life as an input to valuing pipeline stocks. But their collective actions do imply such a judgment. In effect, the equity prices of pipeline companies imply that bond investors will lose their seniority in the capital structure before maturity. If Free Cash Flow to Equity (FCFE) will exhaust the company’s ability to pay its owners before long term bonds mature, those bond investors will wind up owning equity. How long will this take?

It turns out there’s a neat way to estimate this. The table below shows how this works for Enterprise Products Partners (EPD). It uses dividends because they’re easily identifiable, and therefore produces a more conservative (i.e. longer) useful life than using FCFE since companies are not paying out more than their FCFE in dividends nowadays.

Equity investors who have carefully considered buying EPD before ultimately rejecting it have concluded that the dividend will not last indefinitely. Therefore, they must regard the yield on EPD’s 30-year bonds as wholly inadequate for a fixed income investment, and that ultimately bond holders will own the equity when the existing common shareholders are wiped out. Since the bond yield is what the eventual owners need as compensation for this outcome, it can be used as the discount rate on future years’ FCFE. Adding up the successive years of FCFE until its value equals the price paid (i.e. today’s equity price) reveals when equity investors by implication expect those cashflows to stop.

For EPD equity investors, discounting the company’s $1.80 annual dividend back at the 3.8% yield on its 30-year debt means that today’s stock price reflects the NPV of 19 years’ worth of dividends. The company’s 7.6% dividend yield projects that today’s equity investors will be wiped out and replaced by bond holders, who will become the new owners of EPD, at that time.

This seems to us an unreasonably pessimistic view of the remaining useful life of the company’s assets. We’re also assuming no growth in dividends or giving credit to buybacks even though EPD has a buyback program in place which is returning additional value to equity investors. The implied useful life is even less than 19 years to the extent dividend growth and buybacks occur.

EPD bond investors fully expect to be repaid in full, and don’t anticipate owning the company. EPD’s stock price implies the opposite. It would be interesting to listen to a conversation between a well-informed non-buyer of EPD’s stock and one of their bond holders.

The math produces similar results for other big pipeline companies. Kinder Morgan’s (KMI) 29 year remaining asset life is longer than the others because its dividend is more generously covered. KMI slashed its dividend in 2015 and began cautiously increasing it in 2018. It has plenty of room to grow.

Environmental extremists would likely cheer the dour outlook reflected in pipeline stock prices. Last week the International Energy Agency (IEA) published a report laying out how the world could reach net zero energy-related emissions by 2050. It relies on some bold assumptions, such as no new investment in coal, oil or gas production starting now. It also incorporates significant behavioral changes including slower speed limits on highways, warmer settings on air conditioners and a 35% reduction in the percentage of households owning at least one car compared with current trends.

As usual the media covered the report’s release favorably. The Financial Times published three articles within 24 hours (Why the IEA is ‘calling time’ on the fossil fuel industry, Energy groups must stop new oil and gas projects to reach net zero by 2050, IEA says, and The IEA has delivered an overdue message). This is how pipeline equities are priced.

More representative of the view held by bond investors was Reuters, with Asia snubs IEA’s call to stop new fossil fuel investments. Although the energy transition will continue to impact everyone, the IEA’s report is more aspirational than plausible.

Even following this year’s rally, pipeline stocks reflect an expectation of stranded assets that bond investors, and many others reject. The sector is still cheap.

We are invested in all the components of the American Energy Independence Index via the ETF that seeks to track its performance.

We have three funds that seek to profit from this environment:

Energy Mutual Fund Energy ETF Real Assets Fund


Pipelines Close In On A Milestone

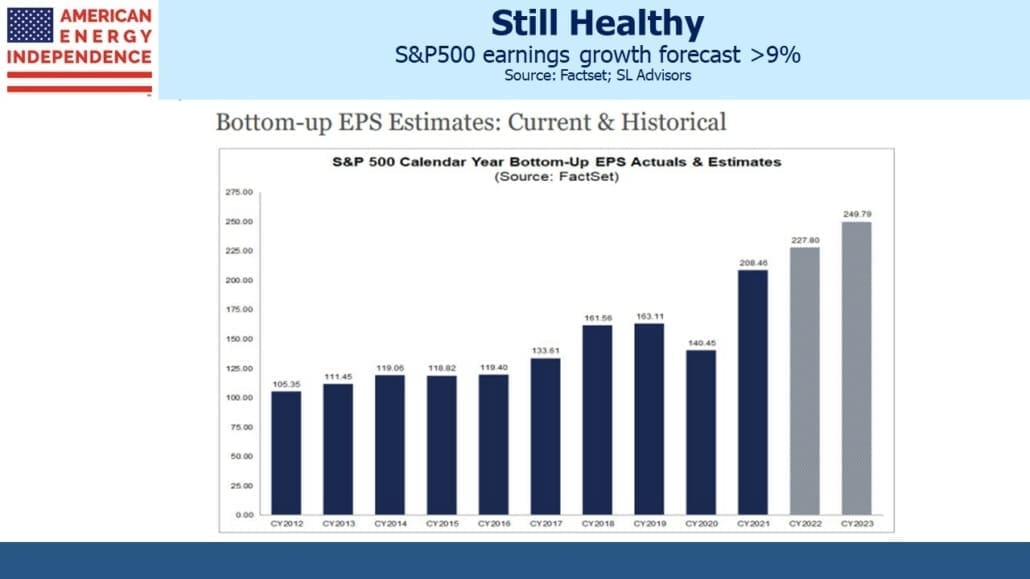
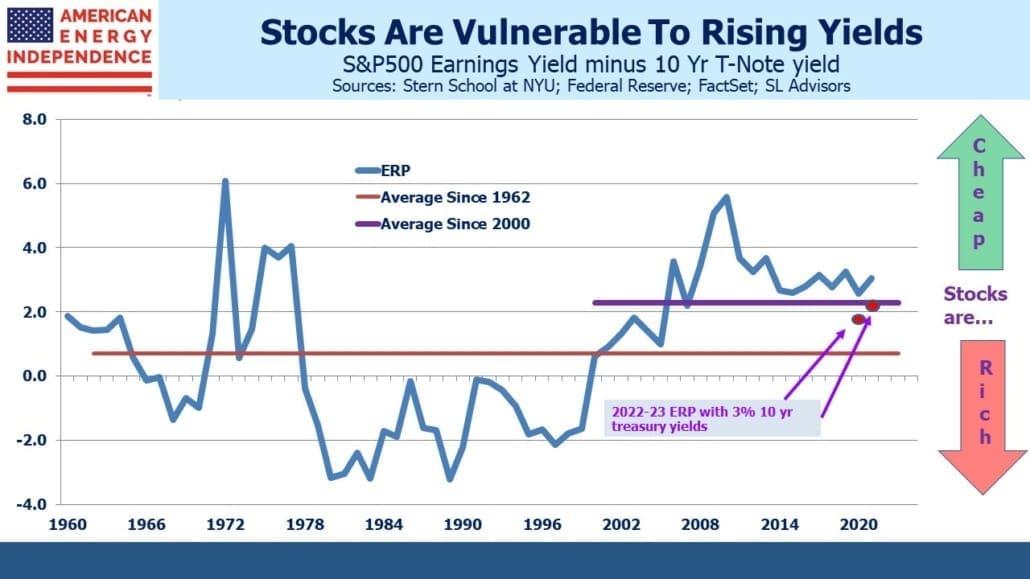
The S&P500 is up 11% so far this year. 2021 EPS estimates from Factset are up by close to the same amount. The rise in ten-year treasury yields means the Equity Risk Premium (ERP) doesn’t show the market to be quite as cheap as it was, but not by much. Covid has been less traumatic to the market than to people. Earnings forecasts have been rising steadily for the past six months. First quarter announcements led to a surge in upward revisions.

2021 S&P earnings are now expected to be 15% higher than pre-Covid 2019, a 7.3% compound annual growth rate over the two years. Enormous fiscal stimulus in the U.S., which continued even while vaccine distribution was letting life return to normal, helped. 2022 earnings growth of 12% confirms the strong recovery.

Stocks offer some protection against inflation. But rising bond yields could negate that. The Federal government is on a well-orchestrated mission to drive stocks higher. More $TNs in spending are coming, for investment in infrastructure followed by the American Families Plan. The Federal Reserve’s bond buying is muting the message from investors worried about such fiscal profligacy. Donald Trump, who often took credit for strong stock market performance, must grudgingly admire the government’s synchronized and powerful boosting of equity markets.

Larry Summers continued his criticism of the Fed, warning yesterday of the Fed’s “dangerous complacency” regarding inflation. He continued, “It is not tenable to assert today in the contemporary American economy that labor market slack is a dominant problem. Walk outside: labor shortage is the pervasive phenomenon.” That view fits the facts as we see them better than the Fed’s outlook.

Although the market has continued its upward momentum, there’s been a clear rotation away from growth and towards value. Rising bond yields has contributed to this – growth stocks in effect have a longer duration, increasing their sensitivity to higher rates. The IWM/QQQ ratio compares small cap value with technology stocks. The trend for value to outperform began with the vaccine announcement in November.

The perennially unloved energy sector has been inexorably recovering too. North American pipelines, as measured by the American Energy Independence Index (AEITR), have been gradually closing the performance gap with the overall market. It’s increasingly clear that the brief collapse in March 2020 was partly due to the forced liquidation of leveraged closed end funds (see MLP Closed End Funds – Masters Of Value Destruction). The biggest pipeline corporations delivered 2020 financial results that weren’t far from pre-Covid guidance. Reduced spending on new projects helped, and operating cashflow for the sector offers unappreciated resilience.

A handful of natural gas pipeline operators then benefitted from the Texas power cuts in February, when prices spiked over 100X. The sector even rallied when the Colonial pipeline suffered a temporary service interruption, causing gasoline shortages in parts of the eastern U.S. (see Hackers Highlight Pipelines’ Value).

The International Energy Agency published a report on what the world needs to do in order to reach zero emissions by 2050. Their recommendation is that no new supplies of oil, gas or coal be developed. This is implausible – China, India and other emerging economies aren’t going to abandon their plans to raise living standards and energy consumption (see Why The Energy Transition Is Hard).

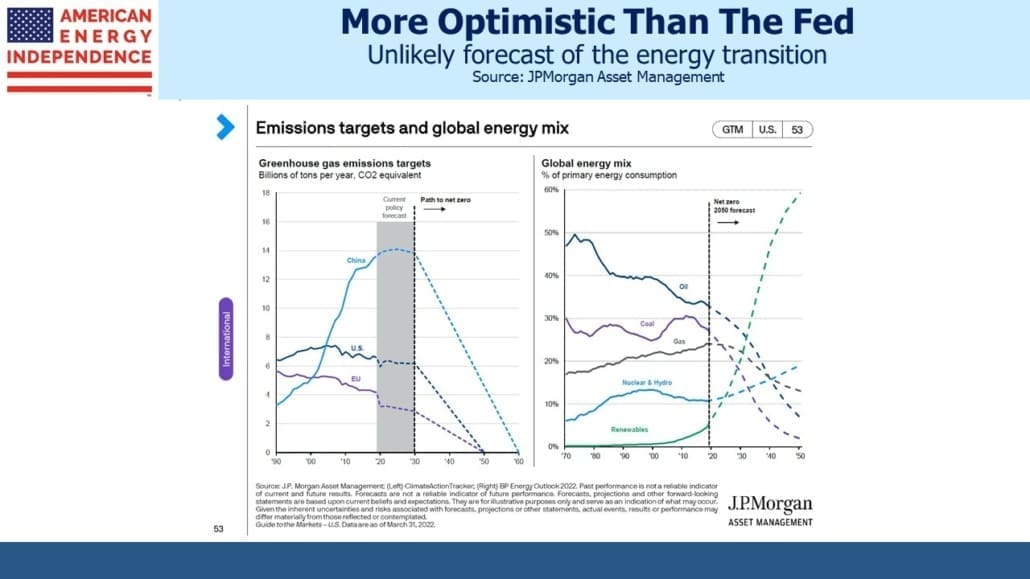
Investors are coming to terms with a more realistic assessment of the energy transition – one recently articulated in an excellent paper by JPMorgan’s Mike Cembalest. Solar panels and windmills can’t meet all the world’s energy needs, which are likely to keep growing as emerging countreies seek higher living standards for their populations.

The pipeline sector has continued its post-Covid bounce and is within 11% of matching the return of the S&P500 from the beginning of last year, when few knew what a coronavirus was. Inflation fears, which continue to percolate, have helped push commodity prices higher. This, combined with the strong recovery, is also boosting oil and gas prices. If current trends continue, the AEITR will close its 2020-21 performance gap with the overall market, which would represent another milestone in its recovery.

Sentiment, based on our many client conversations, is turning cautiously optimistic. The past several years of disappointing returns dissuade many generalists. Energy buyers haven’t been accused of irrational exuberance for a long time.

Free cash flow yields that should exceed 10%, 2X the S&P500, by year’s end, should continue to drive strong returns.

We are invested in all the components of the American Energy Independence Index via the ETF that seeks to track its performance.

Inflation – Back By Popular Demand

Inflation is probably the biggest known risk facing equity markets today. Last week’s CPI report was expected to be high and still exceeded expectations. The 4.2% year-on-year increase in the All Urban Consumers index (CPI-U) was boosted by comparisons with a year ago. The Fed, and many economists, have warned of the transitory base effects as weak readings from the start of lockdowns drop out. The CPI-U less food and energy is running at 3% p.a., although as is often pointed out eating and driving are not optional even if their costs are volatile. Most striking was the 0.9% monthly jump in CPI-U ex food and energy. Used cars and trucks were up 10% and contributed a third.

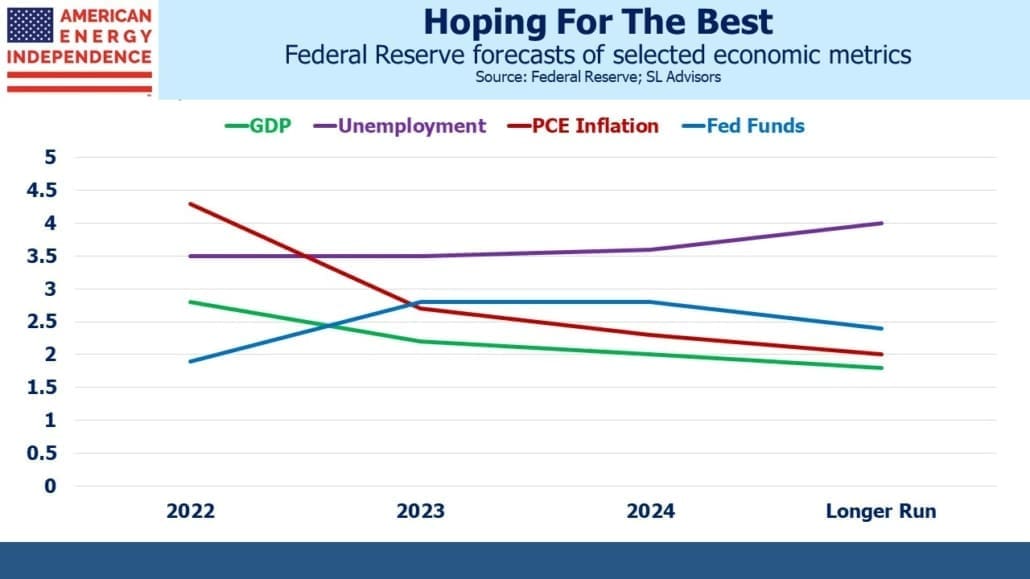
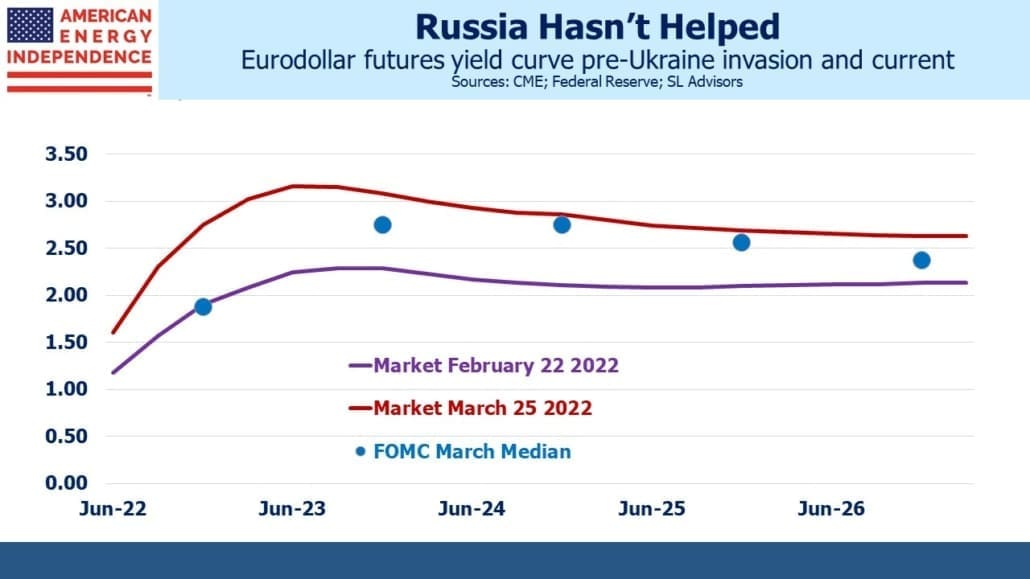
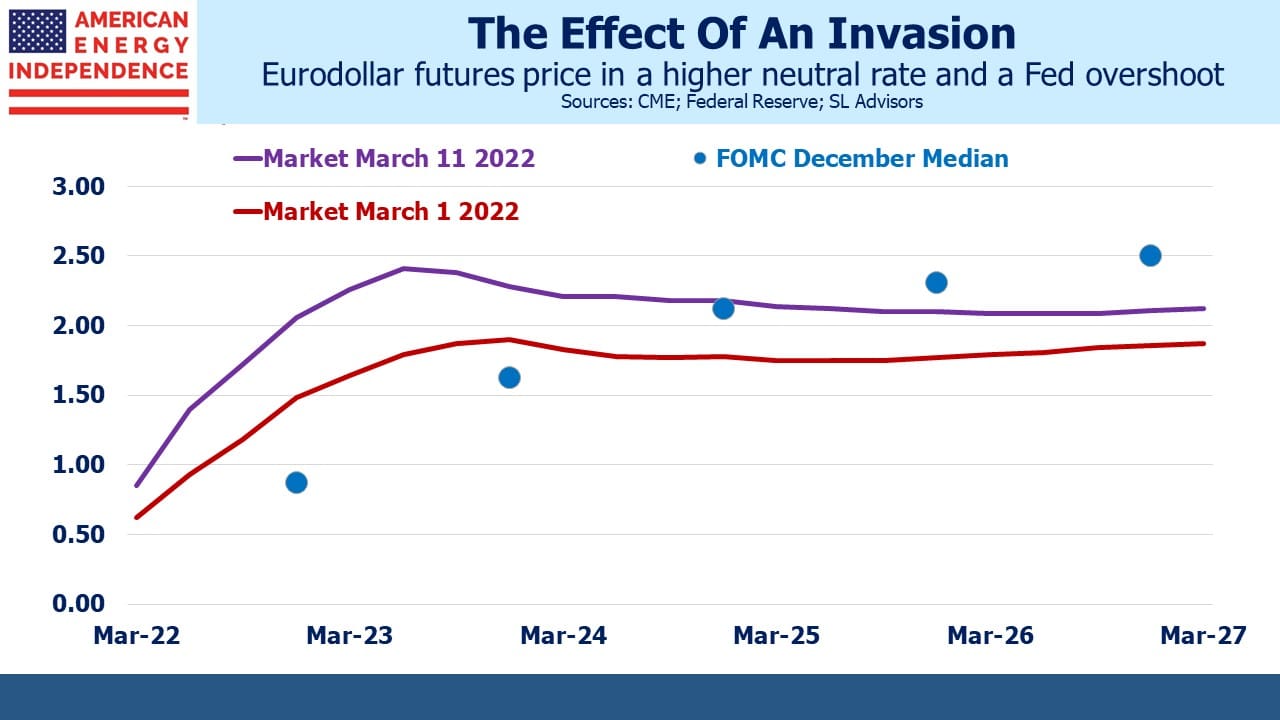
The Fed expects inflation to temporarily increase before supply constraints ease, moderating price hikes. Investors aren’t so sure, given the Fed’s stated willingness to tolerate higher inflation until they’re sure we’ve reached full employment. Under such circumstances, the term structure of interest rates should reflect a premium above the Fed’s guidance. The FOMC projects an unchanged policy rate through at least 2023, whereas eurodollar futures are priced for tightening at the start of 2023 and 0.75% by year’s end.

We’ve noted before the FOMC’s poor forecasting record, even of their own policy rate (see Bond Market Looks Past Fed). Markets are skeptical about the Fed’s resolve to maintain expansionary policies in the face of rising inflation. It’s analogous to when a central bank defends a currency peg. Credibility counts for much, and the 0.75% gap between market rates and FOMC projections measures the degree of investors’ disbelief.

Price hikes are visible everywhere. Many corporations report price pressures. Warren Buffett noted that suppliers were increasing costs to them which were being passed on and accepted by customers of Berkshire’s many operating businesses. Hiring is hard. The non-farm payroll report fell well short of the one million jobs expected, but rising hourly earnings suggest more labor tightness than the 6.1%  unemployment rate implies. There’s reason to suspect that job growth was constrained by insufficient availability of qualified people.
Criticizing the Fed is a time-honored self-indulgence but not very profitable. More useful is to figure out how to act on it. Partial debt monetization synchronized with excessive fiscal stimulus is so obviously designed to cause inflation that investors should align themselves with the government’s actions, not their benign inflation forecast.

Total Federal debt is $28TN. Its cost of financing will increasingly drive America’s fiscal outlook. Many will be surprised to learn that the Congressional Budget Office (CBO) expects net interest expense as a % of GDP to fall over the next few years – a consequence of higher yielding securities maturing and being replaced. The average rate on government debt will fall from 2.1% last year to 1.2% in 2023 before climbing back up to 2.2% by 2030.

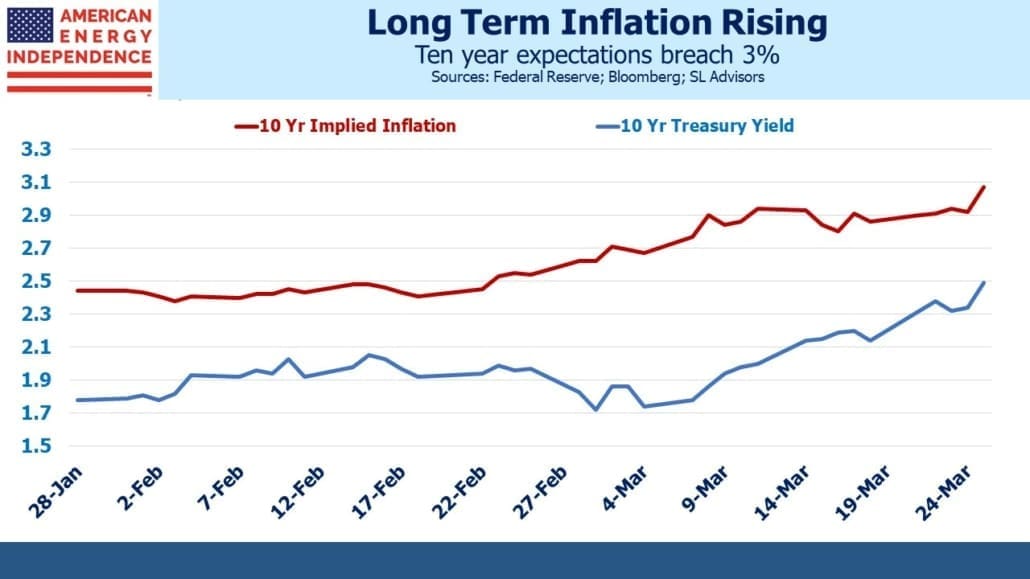
Fiscal conservatives will identify much of concern in this. Ten-year market-based inflation expectations are above 2.5%, a level the CBO doesn’t expect even in a single year. In March the CBO forecast the ten-year treasury will average 1.1% this year, whereas it’s already averaged 1.4% over the first four months or so.

Moreover, the CBO forecasts that the Federal government’s real cost of debt, defined here as the average rate less CPI-U inflation, is about to go negative and remain there for the next decade. U.S. Debt:GDP is forecast to reach 107% by 2031, the highest in the nation’s history. Is it reasonable to expect that the U.S. will borrow at negative real rates with such a fiscal outlook?

As sobering as these charts are, the MMT crowd (see Modern Monetary Theory Goes Mainstream) will press to exploit the underutilized borrowing capacity negative real rates imply.

This is why the Fed’s continued bond buying is poorly advised. The risks to America’s fiscal outlook are skewed in one direction. It’s likely that the CBO’s projection of negative borrowing costs for the next decade will require continued growth in the Fed’s balance sheet. The Fed may be right that inflation will return to 2% next year, but they face asymmetric risks.

Prudent management should have prompted them to dial back as soon as it became clear that the stimulus checks were being distributed coincident with the vaccine. They should have withdrawn when there was no political pressure to continue. If fiscal profligacy drives rates higher, MMT proponents (i.e. progressive Democrats) in Congress will be quick to pressure the Fed back in.

But the Fed didn’t — and America’s fiscal outlook increasingly relies on negative real rates to fund its debt, which means higher inflation, more debt monetization, or both. As Washington pursues additional spending on infrastructure and welfare, further increases in borrowing are the path of least resistance.

Markets are adjusting to the new normal. Pipelines are cheap and may be one of the few sectors to offer inflation protection.

We are invested in all the components of the American Energy Independence Index via the ETF that seeks to track its performance.


Hackers Highlight Pipelines’ Value

The hacking into Colonial Pipeline’s network demonstrated the high-tech vulnerability of some infrastructure as well as society’s reliance on it. Colonial is the largest privately owned pipeline in the U.S., carrying up to 45% of the east coast’s gasoline supply from refineries in Texas to New Jersey. On Monday gasoline futures initially rose 4% on fears of an extended outage before Colonial announced a goal of, “…substantially restoring operational service by the end of the week.”

Pipelines and other midstream energy infrastructure don’t command much public attention until there’s a problem. Enbridge’s Line 5 pipeline supplies 540,000 barrels per day of propane and crude oil to customers in Ontario, Quebec and Michigan.

Governor Whitmer wants to close the pipeline because it runs under the Straits of Mackinac. She fears a leak, while Enbridge argues that it meets or exceeds all relevant safety standards. They’re also planning a replacement to the segment that passes under the Straits, the Great Lakes Tunnel Project. Enbridge CEO Al Monaco is pushing for approval to build the concrete tunnel which will house the pipelines so as, “to reduce the risk (of a spill) to as near zero as humanly possible.”

Governor Whitmer’s closure order may cause Line 5 to be shut down this week. Al Monaco has warned this would result in a “very bad outcome” for consumers.

It must be tempting for companies like Enbridge to give political leaders what they want, including the consequences. One alternative to Line 5 would require 2,100 trucks per day. In New York’s Westchester county, Con Edison stopped accepting new natural gas customers because the state is impeding pipeline access. My partner lives in Westchester, and he has installed a back-up generator at his home to counter the state’s policies that favor less reliable energy.

If Enbridge’s Line 5 stops delivering crude oil to refineries in Michigan and beyond, gasoline prices will rise. Energy companies like Enbridge are more responsible than state governors such as Whitman and New York’s Andrew Cuomo.

February’s cold snap which led to power outages created windfall gains for pipeline companies. Energy Transfer gained $2.5BN, and after using the proceeds to help pay down $3.5BN in debt during 1Q21 is now expected to bring leverage (Debt:EBITDA) to to 4.5X by early 2023 rather than late 2024 previously. Kinder Morgan (KMI) picked up an extra $1BN, and Enterprise Products Partners (EPD) reported some benefit from sales of natural gas at high prices.

Proponents and critics of renewables have both used the Texas power cuts to support their case (see Why Texas Lost Power). All sources of energy came up short of what was needed. But the $Billions in extra profits generated by companies with natural gas infrastructure in the right place reflects their value. There were no reports of windmills or solar panels suddenly being in high demand. Natural gas changed hands at over 100X its normal price – the unique features of the Texas power market allowing uncontrolled price discovery. At least it was available. Additional solar and wind wouldn’t have been there even at 1,000X normal pricing.

Energy infrastructure has been outperforming the market since the Covid low in March of last year. President Biden’s policies have inadvertently helped, by constraining spending within the energy sector which is leading to higher energy prices. The market’s response to the Colonial cyber attack on Monday was to push stocks pipeline stocks higher. It highlighted the critical nature of the sector to the economy. The WSJ has suggested that Biden’s proposed infrastructure plan should dedicate money to protecting vital energy infrastructure – perhaps this sensible suggestion will find increased support.

Although the media makes it sound as if renewables are ubiquitous, last year wind was 8.4% of U.S. power generation and solar just 2.3%. Hydropower (7.3%) and nuclear (19.7%) don’t suffer from the intermittency of solar panels and windmills, so are more valuable.

The pipeline sector is benefiting from many recent developments. Companies are demonstrating greater financial discipline. Energy prices are rising, thanks to Democrat policies. Inflation expectations are up, helped by the profligate Covid relief bill and the Fed’s continued buying of bonds (see The Fed Is Playing With Fire in the WSJ), boosting demand for a sector that offers decent inflation protection. Finally, misguided policies in some states and cyberattacks by criminal gangs are highlighting the importance of energy infrastructure. First quarter pipeline earnings were full of positive surprises. It’s one of the very few cheap sectors remaining, which is why the American Energy Independence Index (AEITR) is 20% ahead of the S&P500 this year.

We are invested in all the components of the American Energy Independence Index via the ETF that seeks to track its performance.

Why The Energy Transition Is Hard

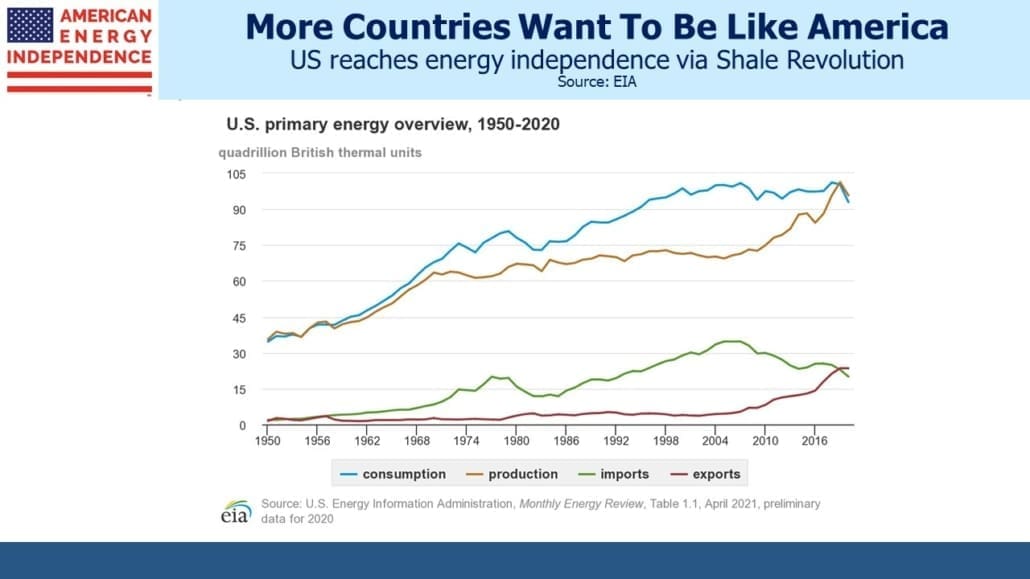
The media is not short of simple solutions for climate change. Solar panels and windmills have been cheaper than natural gas for so long in the popular narrative that you’d think utilities are willfully pursuing lower profits by not blanketing the country with them. The industry that provides over 80% of our energy is often demonized by extremists who drive to protest pipelines.

There are some whose concern is more thoughtful. Bill Gates recently laid out the many economic and technological challenges to reducing Global Greenhouse Gases (GHGs), and avoided the politics which is bigger than the other two (see Not Just Another Billionaire With A Plan). Recently Mike Cembalest, Chairman of Market and Investment Strategy at JPMorgan Asset Management, published Future Shock: Our 11th Annual Energy Paper. As in the past, Cembalest partnered with Vaclav Smil, author of numerous excellent books on energy stuffed with facts and figures.

The sober analyses by Gates and Cembalest are much more useful than shrill soundbites from the Sierra Club. Cembalest notes that, “Absent decarbonization shock treatment, humans will be wedded to petroleum and other fossil fuels for longer than they would like.” Gates (albeit unintentionally) and Cembalest are bullish about the long term future of oil and gas, a point not lost at JPMorgan which remains overweight energy stocks.

Right on cue, 1Q21 pipeline earnings reaffirmed the continued growth in free cash flow and stability of the sector. Williams Companies (WMB) beat expected EBITDA by 7%, and raised its full year guidance by 2%. Its stock yields 6.5% and its payout is covered almost 2X by distributable cash flow. Enterprise Products Partners (EPD) beat estimates by 14%. It yields 7.7%, 1.7X covered. Cheniere Energy (LNG) beat estimates by 43% and raised full year guidance by a conservative 5%. Energy Transfer (ET) enjoyed a one-time gain of $2.4 BN from the Texas power outages, beating EBITDA expectations by 88%. This helped them reduce debt by $3.5BN.

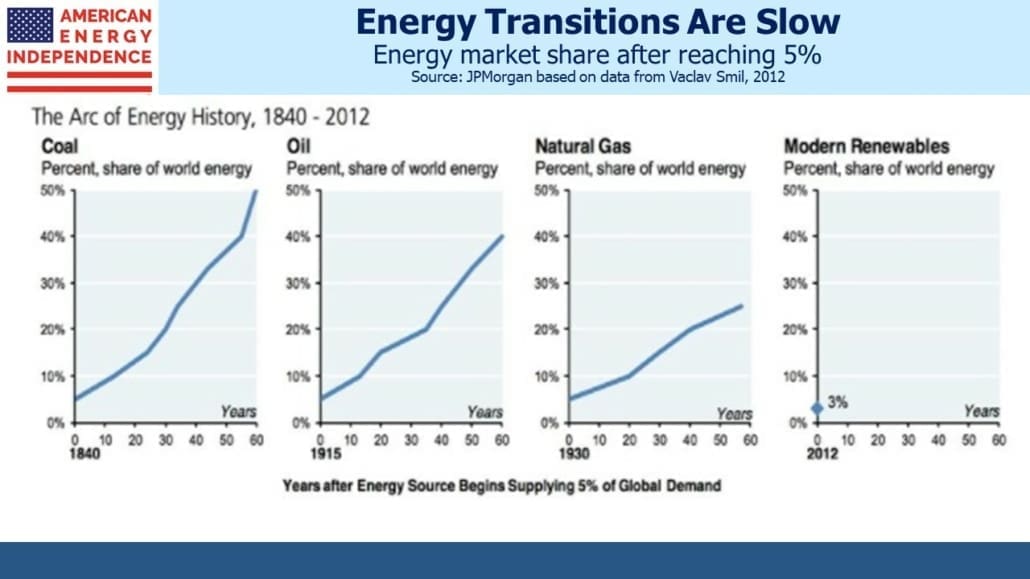
The energy transition is slow, for all the reasons regularly cited in this blog. Mike Cembalest provides further insight. Decarbonizing the transportation sector by switching to Electric Vehicles (EVs) is a goal in most developed countries. Its apparent imminence has damaged many reputations for forecasting acuity. Norway is a special case with 62% penetration of EVs in light vehicle sales. Taxes and subsidies heavily favor EVs; Norway’s electricity (97% hydropower) is 40-70% the cost of their European neighbors, and if Norwegians only bought EVs their subsidies would be the second biggest government expenditure.

U.S. EV penetration is low at 2%. Americans drive farther, enjoy cheaper gasoline and use less public transport than other countries. and trucks/SUVs are 75% of light vehicle sales. All the Tesla owners I know love them, but my small group of friends isn’t representative. Comparing the EV with its equivalent internal combustion engine counterpart (i.e. Ford F150 with the F150EV etc) shows EVs to be almost twice as expensive.

The energy transition comes with a substantial increase in power consumption, which is intended to be supplied with solar and wind. Sunny and windy places are often not where electricity consumers live – on top of which solar and windmill farms require substantially more land than conventional power plants. A report last year from Princeton University estimated that U.S. annual transmission investment would need to triple over the next three decades.

Massachusetts is trying to import hydropower from Quebec, but it first has to travel through New Hampshire where environmentalists recently persuaded authorities to deny construction of the necessary transmission lines. In Russell Gold’s Superpower (see our review here), he chronicled the challenges faced by Clean Line in getting windpower from Oklahoma to Tennessee. The book ended with the assets being sold to NextEra Energy, and after continued delays and expensive court battles the project was abandoned.

Widespread battery storage is a critical supplement to the intermittency of solar and wind, where 20-30% capacity utilization is common versus 85% for natural gas power plants. Batteries are getting cheaper to be sure, but Mike Cembalest illustrates the daunting economics by comparing the cost of building an oil storage tank ($15-$18 per barrel of capacity) with the $510,000 cost of a Tesla Megapack holding the same 17 kWh of energy.

The stark truth is that combating climate change will require enormous public investments, substantially higher energy prices and altered daily lives for many. This shouldn’t be surprising – if it was easy we’d have done it already. The biggest failure of climate extremists has been to misunderstand the cost and to avoid talking about it. It’s why Joe Biden promises well-paying green jobs. Higher electricity prices and Federal eminent domain to build inter-state transmission networks isn’t so appealing.

Climate Czar John Kerry’s discussions with China acknowledge where much of the future growth in GHGs will come from. The 2001 entry of China into the World Trade Organization brought enormous access to cheap goods as production of what the west consumes moved east. Today, China’s industrial sector uses more energy than America’s and Europe’s combined. More than half comes from coal.

Gates and Cembalest are both deeply concerned about climate change. Their work on the subject examines the substantial changes required for the world to reach its stated goals on reduced GHGs and global warming. Few who care about the issue seek to build public support for the costs involved, which is why progress is slow.

Our conclusion from reading both is that the world will be reliant on fossil fuels for many decades to come. Migrating away from coal to natural gas remains well within reach, and has led to most of America’s reduction in emissions. The pipeline sector isn’t just recovering from the Covid collapse of last year, but is beginning to reflect a more realistic outlook.

We are invested in all the components of the American Energy Independence Index via the ETF that seeks to track its performance.

The Fed Is Losing Believers

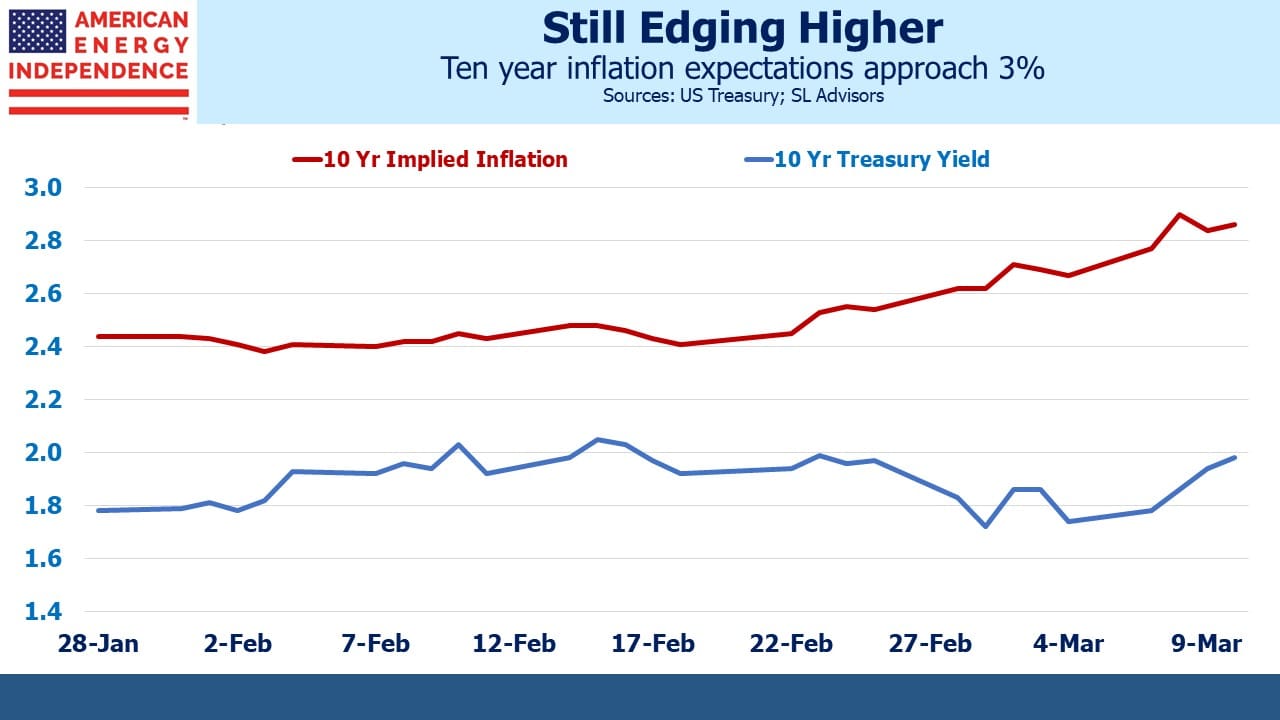
This Friday’s non-farm payroll report is more important than normal. With the Fed in single-minded pursuit of half their twin mandate (maximum employment), the stable prices objective is receding. The recent stalling in the bond market sell-off doesn’t correspond to equanimity over inflation. Declining real rates have accompanied the drop in nominal ones. In April, ten-year treasury yields dropped by 9bps, but TIPs yields fell by 0.13%. So inflation expectations edged up by 4bps. Investors now expect CPI inflation to average 2.42% over the next decade.

The Fed has a stated goal of 2% inflation over the long term and plans to tolerate inflation above this level during a recovery in order to anchor expectations at 2%. Investors are increasingly skeptical. Moreover, real yields are now solidly negative. They crossed below 0% for the first time during Covid early last year and have never recovered. With the Fed buying $120BN in bonds per month, partial debt monetization in support of higher employment is government policy. Stephanie Kelton’s book, The Deficit Myth, explains all (see Modern Monetary Theory Goes Mainstream).

It is a populist policy – voters are more aware of the cost of borrowing than the return on lending. And stocks are near all-time highs, so there’s little obviously wrong. But rising inflation expectations are a warning that the Fed will at some point need to confront a policy that has gone too far. The FOMC is not good at forecasting (Bond Investors Are Right To Worry).

In Fed chair Powell’s recent press conference, he said, “So it seems unlikely, frankly, that we would see inflation moving up in a persistent way that would actually move inflation expectations up while there was still significant slack in the labor market.”

Powell added, “…for inflation to move up in a persistent way that really starts to move inflation expectations up, that would have to—that would take some time and you would think it would be quite likely that we’d be in very strong labor markets for that to be happening.”

Put together, Powell doesn’t expect inflation expectations to rise until (a) actual inflation is rising, and (b) we are approaching full employment. Inflation expectations have been rising for over a year, and passed through the Fed’s 2% long term definition of price stability in early January. His comments sound as if he believes expectations will respond to actual inflation, whereas markets are forward-looking.

It sounds as if Powell doesn’t believe inflation expectations are rising.

On Saturday, Warren Buffett responded to a question by noting, “This economy right now, 85% of it is running in super high gear, and you’re seeing some inflation…” In another response, he said, “We’re seeing very substantial inflation. It’s very interesting. We’re raising prices. People are raising prices to us, and it’s being accepted.” Even Treasury Secretary and former Fed chair Janet Yellen said, “It may be that interest rates will have to rise somewhat to make sure that our economy doesn’t overheat…”

The list of those who share Jay Powell’s  perspective is shrinking.

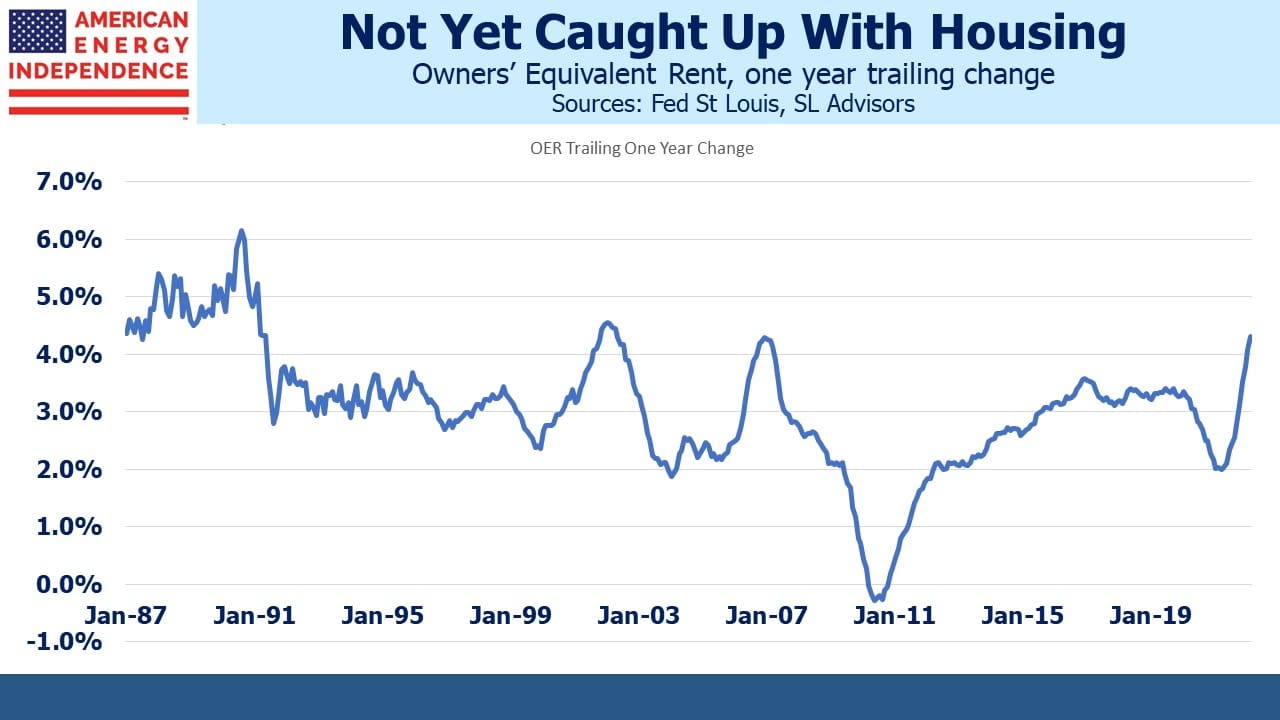
Anecdotal evidence of rising inflation is stacking up. Since the Fed is focused on maximum employment, every non-farm payroll report will be scrutinized for signs that this goal is within reach. Only wage inflation will justify a shifting monetary stance – all other forms are temporary (supply constraints), mean reverting (food and energy) or ignored completely (housing).

One could interpret persistent negative real yields as an indication that the Fed’s bond buying has continued too long. Credit doesn’t seem tight – the high yield bond market remains firm. It’s almost as if the Fed selectively accepts only data that supports its view. To listen to Jay Powell’s frustration with constant questions on inflation, a behavioral finance expert might diagnose overconfidence. The FOMC has misplaced high conviction around current policies.

Last week Dallas Fed president Robert Kaplan said, “At the earliest opportunity, I think it will be appropriate for us to start talking about adjusting those purchases,” He’s the first to openly break ranks.

JPMorgan expects Friday’s non-farm payroll report to show an increase of one million jobs. Jay Powell noted that 8.5 million fewer jobs exist than was the case pre-Covid. The actual slack in the economy may be less than that – Friday’s report will provide further evidence of the economy’s strong recovery.

Pipeline stocks have performed well as a hedge against rising inflation expectations. That’s likely to continue.

We are invested in all the components of the American Energy Independence Index via the ETF that seeks to track its performance.

Pipelines Are ESG

ESG is in the eye of the beholder. There are multiple lists of stocks that score well on Environmental, Social and Governance metrics. My favorite is Lockheed Martin (LMT), a perennial member of the Dow Jones Sustainability Index. If building weapons to blow up people and property can be done in a sustainable way, then ESG is a generous mistress (see Pipeline Buybacks and ESG Flexibility).

There are currently 138 ESG ETFs traded on U.S. markets, with almost $90BN in AUM. The most important thing about ESG investing is that it’s growing faster than the market. A cynic might regard the rush by CEOs to demonstrate ESG-ness as driven by asset flows rather than altruism. ESG-driven investors can note with satisfaction the market-beating performance of such funds. The largest ESG ETF is the iShares ESG Aware MSCI USA ETF (ESGU), with $15BN in AUM.

The pipeline sector offers 7% yields, growing free cash flow and strong recent performance. It has been out of favor more often than not in recent years, but Joe Biden’s arrival at the White House has ushered in rising energy prices with less growth spending (see Is Biden Bullish For Pipelines?). Investors are warming to policies that encourage parsimonious funding of new projects, something that eluded them during Donald Trump’s presidency.

Some may avoid pipelines because of historic volatility, although operating performance last year was scarcely affected by Covid. The energy transition deters others, although a pragmatic desire not to wreck the economy means natural gas retains its bright future as part of the solution to reducing emissions. A third cohort thinks fossil fuel companies are bad, even though it’s how the world has reached today’s living standards. There’s a belief that the energy sector has much to apologize for.

It may surprise this last group to learn that ESGU has a 2.5% weighting to energy, virtually indistinguishable from the S&P500’s 2.6%. ESGU holds Kinder Morgan (KMI), Cheniere (LNG), Oneok (OKE), Targa Resources (TRGP) and Williams Companies (WMB), all components of the American Energy Independence Index. Relative to the S&P500 it has modest overweights in Chevron (CVX) and Exxon Mobil (XOM). It also overweights Nextera Energy (NEE), one of the largest producers of electricity from natural gas.

ESGU has some interesting underweights, including Alphabet (GOOG) and Microsoft (MSFT) both companies with plenty to say about their ESG credentials. Clearly ESG-ness isn’t a binary issue, or Facebook’s dual share class would knock them out on the Governance scale. Instead, it trims them to 1.81% in ESGU versus 2.06% in the S&P500. Berkshire Hathaway (BRK) is ESGU’s biggest underweight, at 0.84% versus 1.47%. Those omitted from ESGU are an eclectic bunch, including Tyson Foods (TSN) and Boston Scientific (BSX). The complete absence of airlines in ESGU fueled some of its outperformance. Covid crushed the sector rather than any ESG shortcomings.

These differences are trivial, which means ESGU looks a lot like the S&P500 and tracks it closely. For the past couple of years, their daily returns are 0.99 correlated, and ESGU has outperformed by 2.1% p.a. It’s unlikely that ESG-run companies offer better long-term performance than the market. More likely is that investors just want to own them a little more, which is boosting their stock returns.

Index providers continue to compete to be the market standard for ESG-ness. Current standards vary. Since probably every member of the S&P500 has ESG slides in its investor presentation, it’s hard to avoid virtue-claiming companies.

If ESG doesn’t impact operating results, then eventually ESG funds will underperform the market because buyers will have overpaid. But for now, metrics from the past two years tempt the virtue-signaling investor – good odds of roughly tracking the market, some chance to beat it and the claim to morally higher ground than one’s peers.

The substantial overlap between ESGU and the S&P500 simplifies the choice facing an ESG-motivated investor. ESGU’s portfolio signifies approval of almost the entire S&P500. There’s no discernible difference in virtue between an investor in ESGU or the S&P500 itself. What ESGU does offer is a small bet on continued flows into ESG funds.

ESGU’s energy holdings represent an endorsement. An investor hesitating to take advantage of the high yields and growing free cash flow of pipelines because of a misplaced concern that her liberal friends may frown can point to ESGU for absolution.

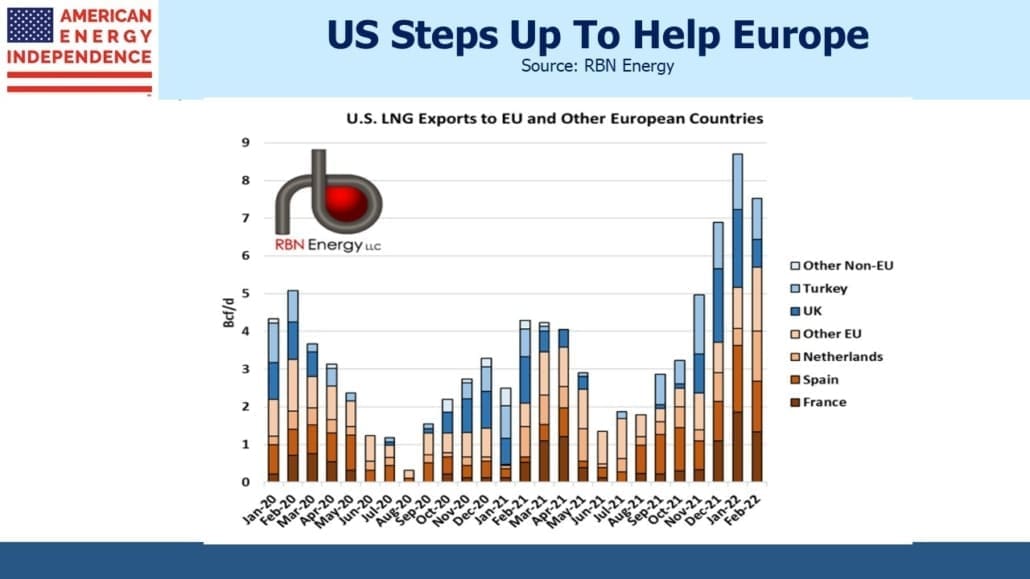
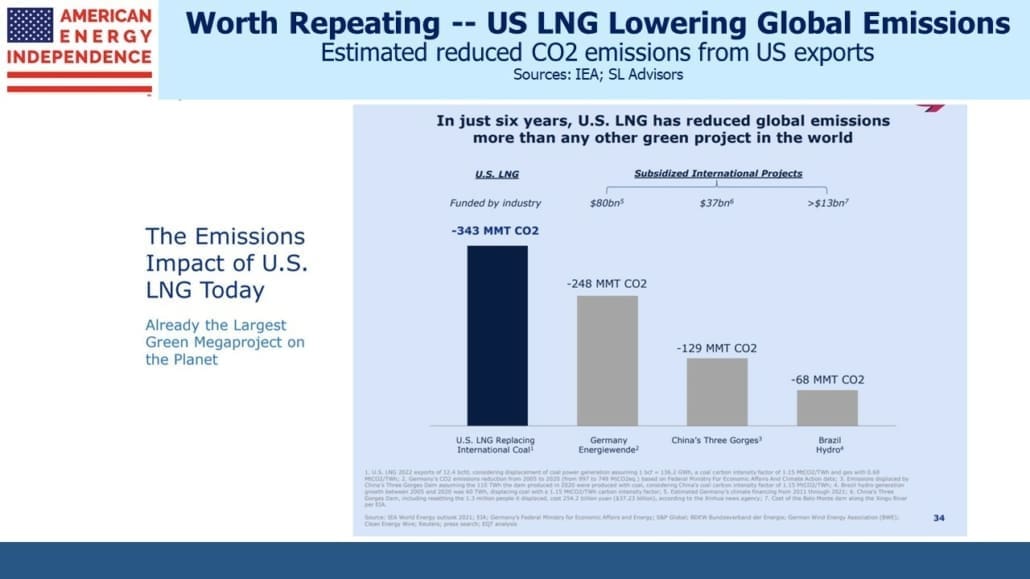
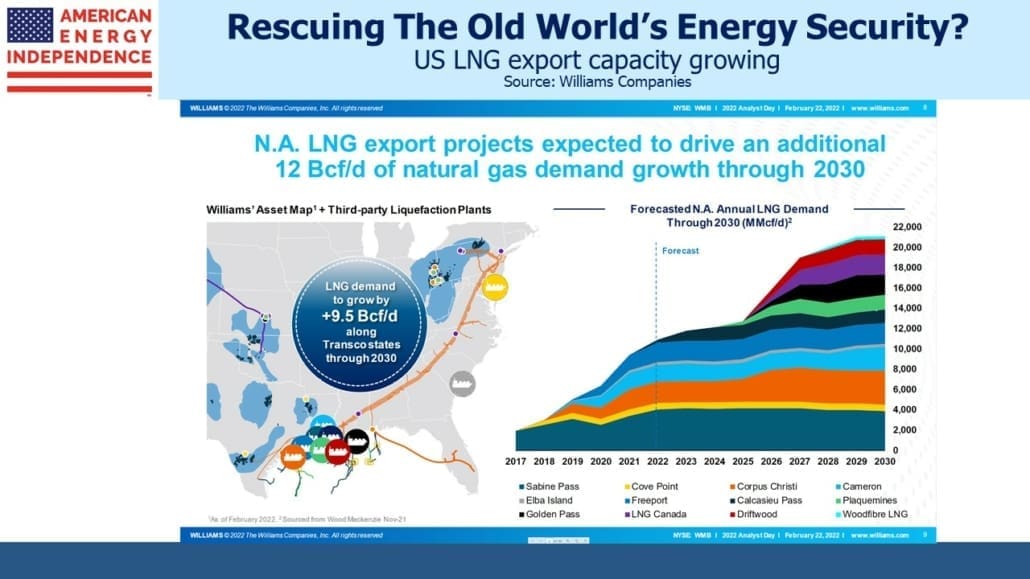
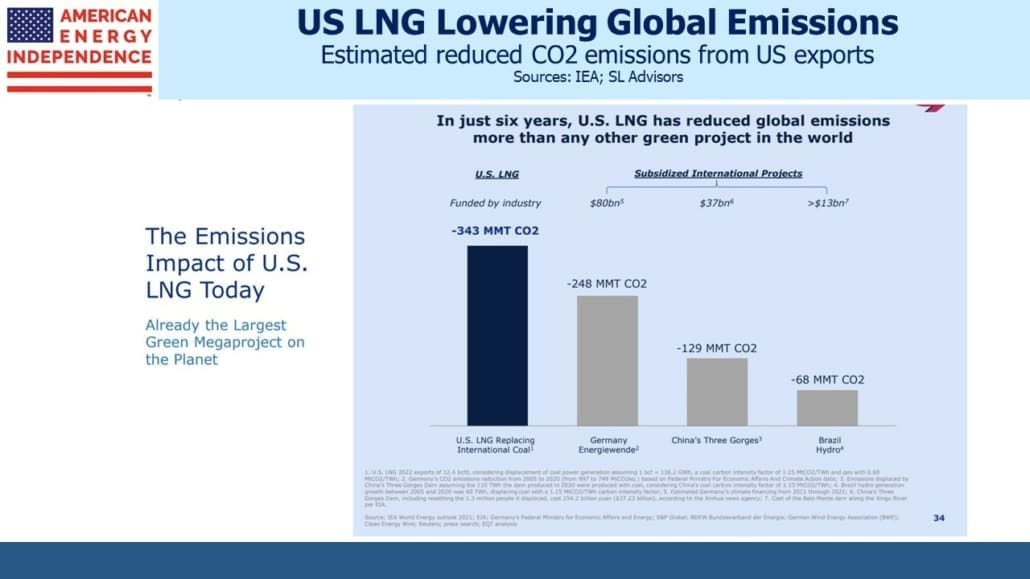
Energy, and pipeline companies specifically, sit at market weight or better in many of the biggest ESG funds. They should – coal to natural gas switching in the U.S. has done more than renewables to lower emissions over the past decade. U.S. exports of liquified natural gas offer other countries the opportunity to emulate our success. Pipelines are ESG.

We are invested in all the components of the American Energy Independence Index via the ETF that seeks to track its performance.

Bonds Are Getting More Interest

One of the most important questions for investors is whether interest rates will remain low. Persistent paltry yields still aren’t fully explained. Inflexible investment mandates affecting trillions of dollars are a partial explanation. For example, the equity risk premium favors stocks sufficiently that it’s possible to replace a ten-year government bond with as little as 20% of the money reallocated to stocks and 80% in cash (see Stocks Are Still A Better Bet Than Bonds).

The resulting barbell has a very high likelihood of delivering the same return or better than bonds, but conservative assumptions still fall short of a guaranteed outcome. Even though low yields should induce investors to allocate more to stocks, pension funds, central banks and others with rigid fixed income mandates continue to hold vast amounts of bonds with derisory yields.

Related to this is the continued drop in real yields. It’s a phenomenon that’s lasted several decades. The series below shows real yields on the average of U.S. government inflation-indexed bonds (TIPS) for over twenty years.

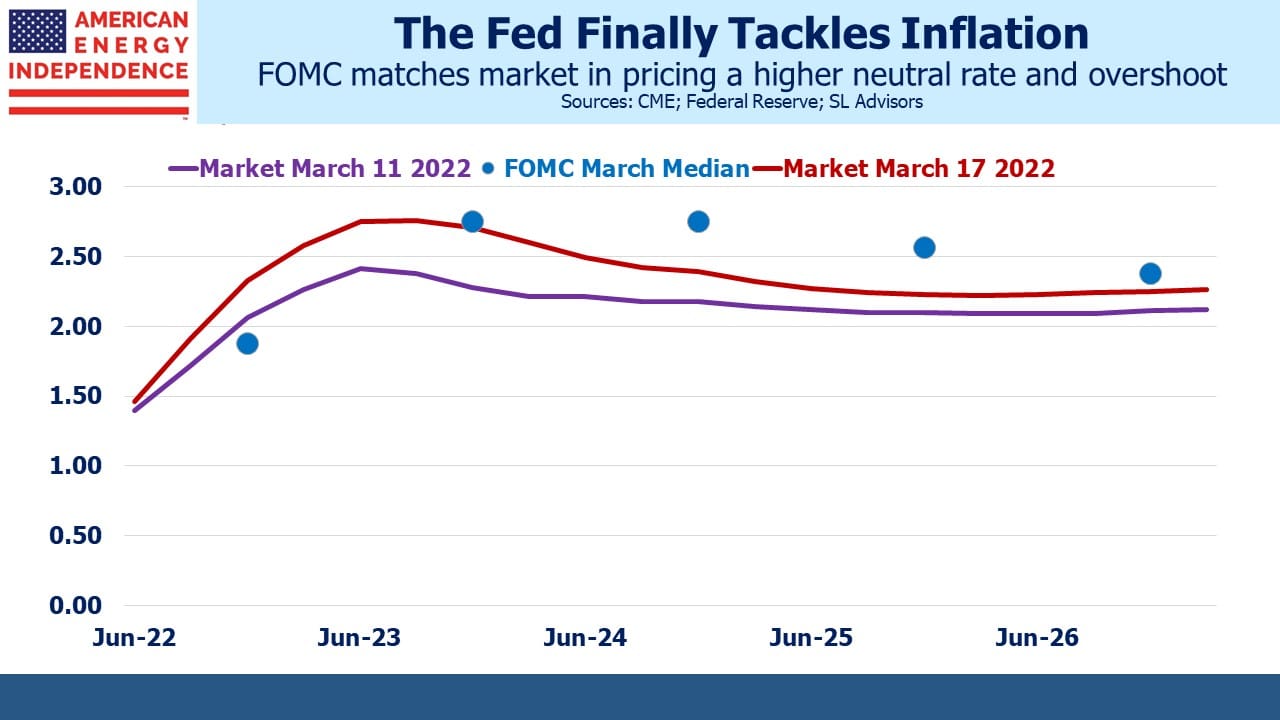
The decline in real yields led the FOMC to change how they implement monetary policy. A couple of weeks ago Federal Reserve Vice-Chairman Richard Clarida explained that the decline in real rates had also led FOMC members to steadily revise their forecast equilibrium policy rate lower. It’s fallen from 4.25% in 2012 to just 2.5% now. Even at that level, given the FOMC’s 2% inflation target it implies a neutral real policy rate of +0.5%, whereas long term TIPS yields are negative. That means that the FOMC may eventually revise their neutral policy rate lower still.

The reduced neutral short term rate is why the FOMC is willing to tolerate inflation modestly above 2%. Low rates offer less room to cut during a recession. The FOMC felt this risked inflation remaining below 2%, too close to damaging deflation for them to be comfortable.

Back in the 80s and 90s bond markets were interesting. Fed policy moved with economic cycles. Eurodollar futures could be traded. Since then, interest rates have offered many years of comparative boredom, with the 2008 financial crisis and Covid recession offering a brief respite from the slumber that enveloped fixed income.

We are likely entering a much more stimulating era. Bond markets are becoming interesting again and will command more attention from investors.

Excesses are building up. The government acknowledges few limits on spending (see Modern Monetary Theory Goes Mainstream). There are no fiscal hawks left in Washington. The Federal Reserve is partially monetizing the debt, by buying around $120BN per month. They have somehow convinced themselves that left unchecked bond yields would constrain economic activity, even though rates globally are low by any reasonable measure.

The FOMC is actively seeking higher inflation, insisting that when it appears it’ll be temporary and therefore insufficient to draw a policy response. They’ve also ruled out inflation in food and energy (always temporary and mean-reverting), housing (they always ignore this – see Why You Can’t Trust Reported Inflation Numbers), and many commodities (Covid-related logistical problems that will resolve themselves) as sources of concern.

Only rising wages will prompt them into action (see The Fed’s Narrowing Definition Of Inflation). The doctrine driving monetary policy is that it’s better to be late than early in tightening. Prior tightening cycles were often preceded by a concern that the Fed was late. Such fears may last longer than in the past, since this time tardiness is their intent.

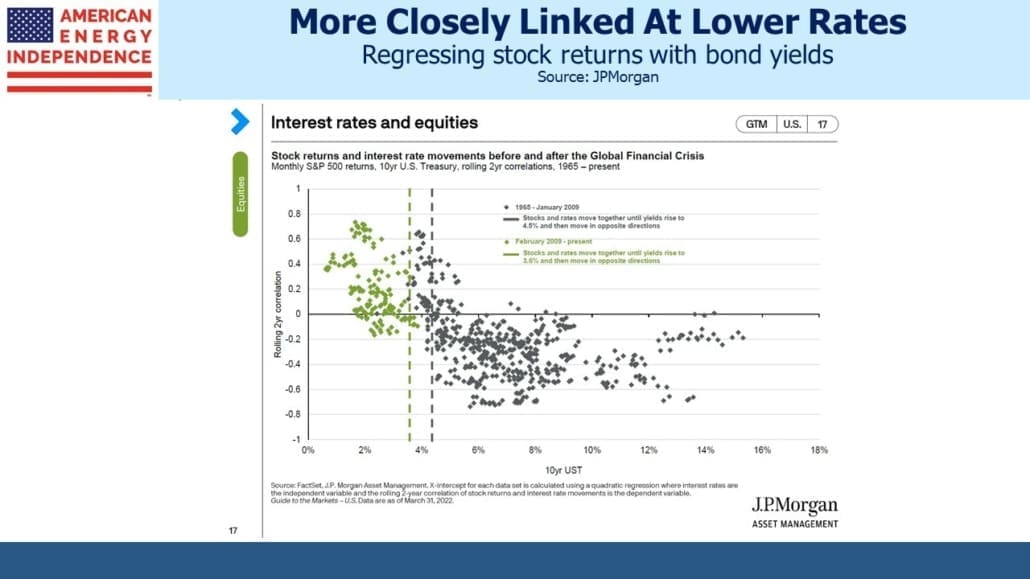
Such circumstances create uncertainty about the outlook for interest rates, a key support under equity markets. They also make it more important for investors to consider inflation separately from interest rates, since the FOMC is relaxing the tether that historically connects them.

For much of the past five years nominal and real interest rates stayed close, reflecting stable inflation expectations. Covid and the resulting uber-stimulus have altered the relationship. Real interest rates have stayed negative – an implicit forecast of stealth monetization of debt.

In 2013 I published Bonds Are Not Forever: The Crisis Facing Fixed Income Investors. It forecast continued low interest rates and negative real yields as a relatively painless solution to excessive debt. Circumstances have continued in that direction, with Covid accelerating the trend. Currency debasement has a long history, as I recounted in the book. A client recently suggested I write an update.

The rise in ten-year treasury yields this year has prompted more investors to consider how they should respond to higher inflation expectations. The recent drop in nominal yields hasn’t been caused by moderating inflation fears – real yields have also dropped.

One could infer from this a growing realization by the market that the Fed won’t be quite as ready as in the past to protect purchasing power. Negative real yields should prompt greater urgency in the search for assets that will provide inflation protection. Investors need to look after themselves, since the Fed won’t.

We are invested in all the components of the American Energy Independence Index via the ETF that seeks to track its performance.

Pipelines Are Part Of The Energy Transition

Last week Kinder Morgan (KMI) reported earnings, which included around $1BN in one-time gains from the Texas power outages in February. Natural gas prices increased briefly by more than 100X. KMI had natural gas available, so profited from selling it to power companies who had commitments to meet. Energy Transfer (ET) is expected to report a large gain for the same reason when they report. Oneok is another candidate. This is part of the optionality that the pipeline business offers.

They also announced a modest dividend increase. The Alerian MLP ETF (AMLP) has cut distributions in half since 2015. Corporations cut by less, and KMI’s 3% hike is another small confirmation that the sector’s dividend cuts are in the past.

If global warming is already causing extreme weather events such as February’s cold snap, then not all the financial outcomes will be negative. KMI and ET may be the first examples of the profits that can be made from weather uncertainty.

Enterprise Products Partners (EPD) benefited last year when propane demand rose sharply. This was the result of a drop in Indian refinery production of gasoline, from which propane is often derived. Once again, a large footprint in the business provides flexibility to exploit market opportunities.

The energy transition offers commercial opportunities, although profiting from weather uncertainty isn’t a reliable business model. As the U.S. Administration increasingly engages more with foreign governments on climate change, the pursuit of practical solutions offers many more opportunities than simply building windmills and solar panels everywhere.

Phasing out coal globally is the biggest. China, the world’s biggest emitter of global green house gases (GHGs), announced that it plans to reduce coal share of power generation to 56% this year – an enormous figure whose only positive attribute is that it’s falling. They still plan to add coal power plants “moderately and rationally.”

An interesting paper was posted on China’s National Energy Administration (NEA) website, authored by their Director. It links the energy transition with energy security, offering a useful perspective on how Chinese policy may evolve. Renewables may be more attractive to China than most countries, because several of the rare earth minerals required are relatively abundant in China (see Some Surprising Facts About Energy). In this way, renewables can improve China’s energy security.

The U.S., which produces enough oil and gas to satisfy domestic demand, faces a loss of energy security in growing its renewables portfolio, a choice that Chinese planners must find mystifying.  China also produces around 93% of the coal it consumes. The NEA paper makes it clear why this is likely to remain a significant source of Chinese power generation for the foreseeable future.

Nextera Energy is well known for its large portfolio of windmills for power generation. But they’re also one of the largest generators of electricity from natural gas in the U.S. They’ve been upgrading some of their power plants to be more efficient and reduce emissions. They’re finding that the reliability of natural gas counters the intermittency of renewables.

President Biden last week hosted a virtual Leaders Summit on Climate. Hs remarks touched on many opportunities to reduce emissions including carbon capture (see Capturing More CO2). KMI operates the biggest CO2 pipeline network in North America, and Section 45Q tax credits are set to reach $50 per ton for CO2 permanently sequestered underground.

Coal is set to gain market share from natural gas over the next couple of years, reversing the main source of U.S. GHG reductions of the past decade (see Emissions To Rise Under Democrats). On current trends the Biden administration will claim many successes but will not be able to show any actual reduction in emissions. Targeting coal power plants remains one of the opportunities to show near term results.

Just about every pipeline company has plans to participate in the energy transition. Coal-to-gas switching, capturing CO2 and perhaps even using hydrogen are among the initiatives being considered. Yields of 7% remain too high given the stability and outlook these businesses offer.

We are invested in all the components of the American Energy Independence Index via the ETF that seeks to track its performance.

image_pdfimage_print