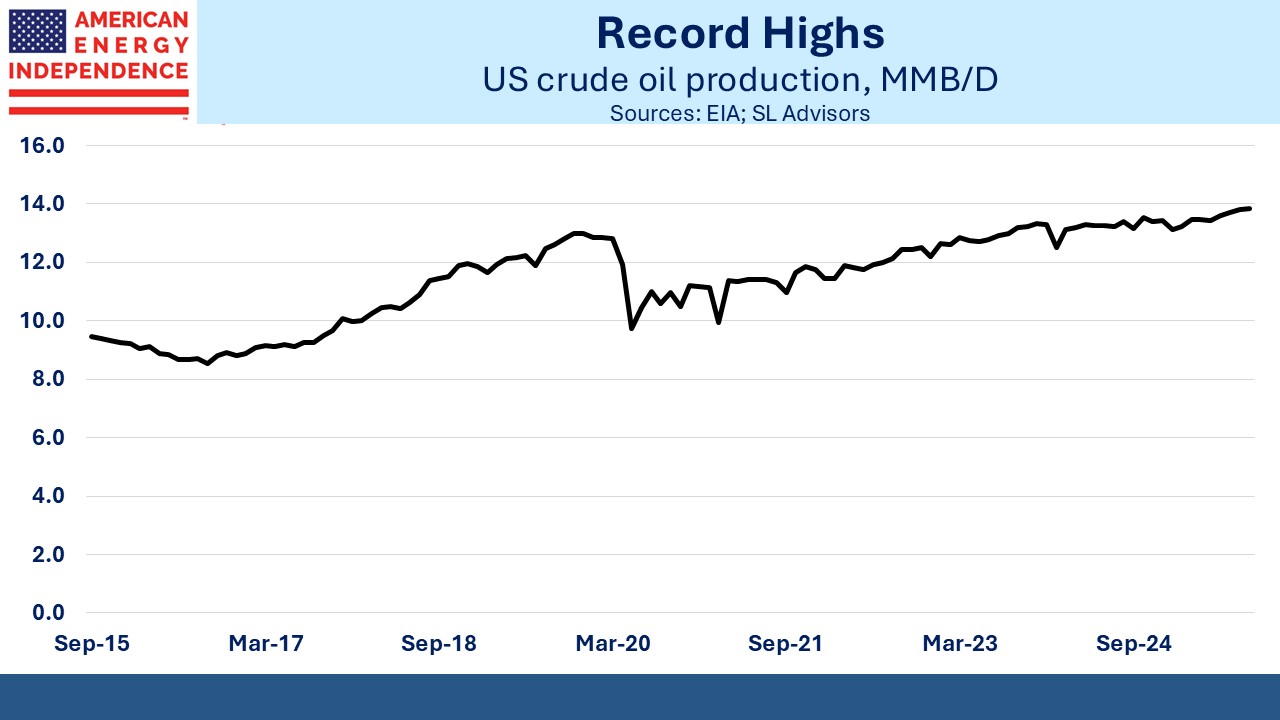
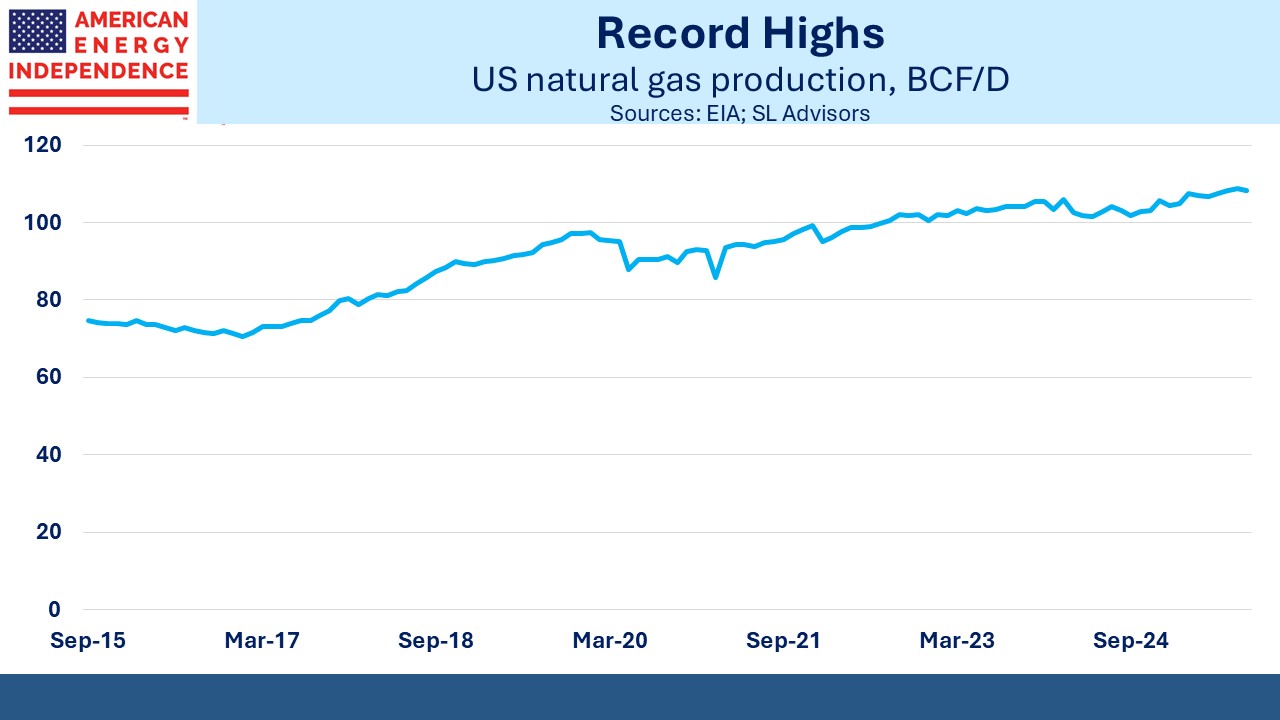
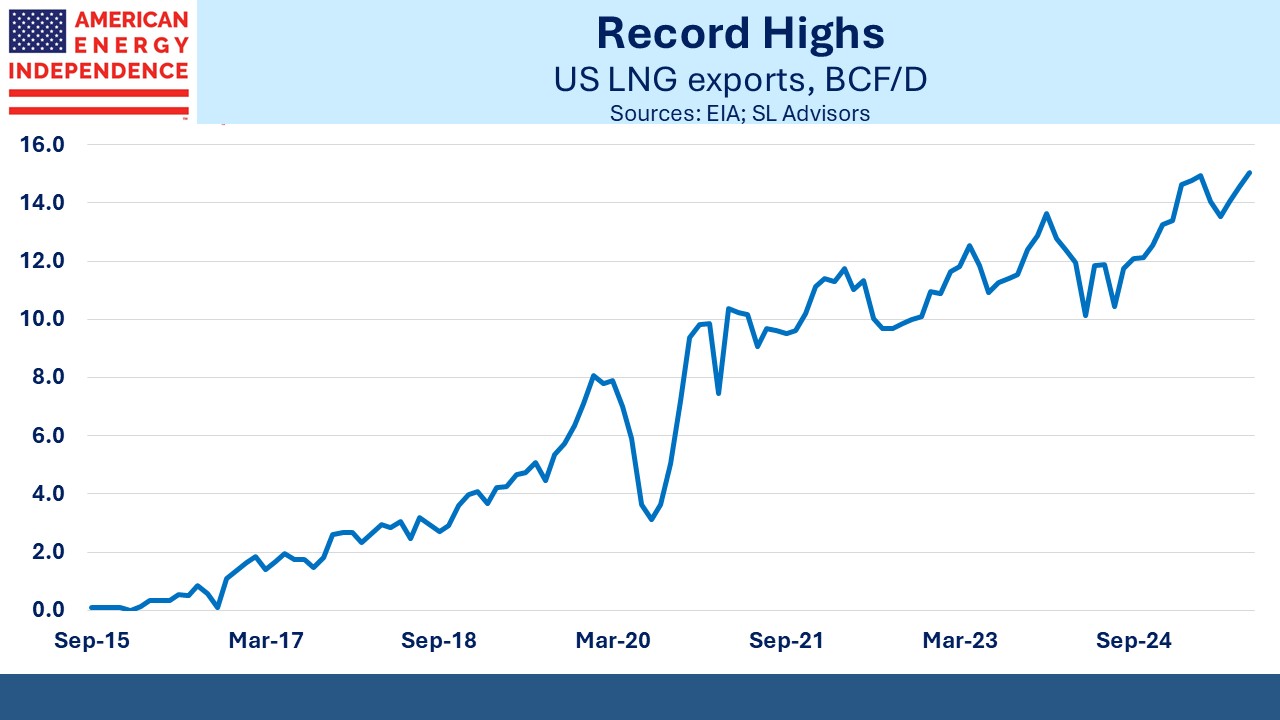
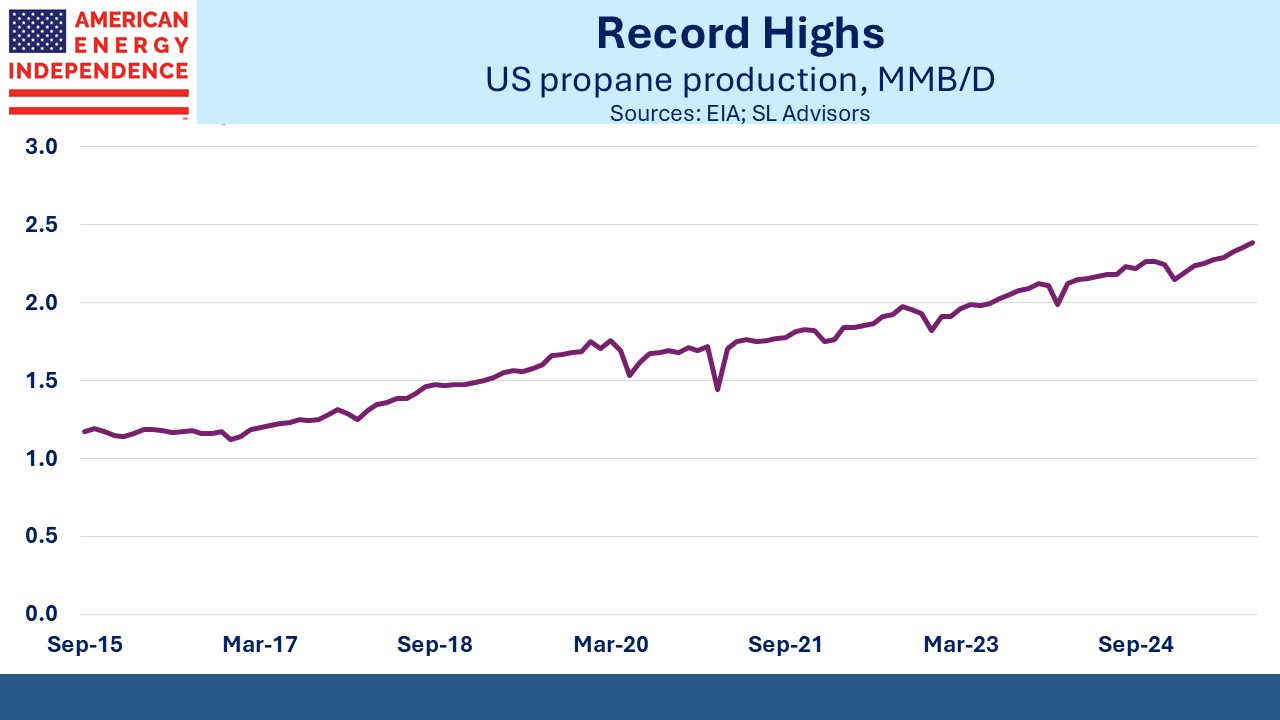
An Energy Secretary With Relevant Experience

Sitting next to me at Newark airport on Monday while I waited to board an airplane was an FT reporter. I know this because he made a phone call to discuss the Trump appointments “on background” with a source who, based on one side of the conversation, had recently been in Mar-a-Lago. Chris Wright, Trump’s soon-to-be Department of Energy (DoE) head, was the topic. Yes, the source confirmed, the pause on LNG permits would be lifted as a first order of business. A lighter regulatory touch should be expected.

None of this is news by now, but a DoE head drawn from the energy sector is a remarkably rare event. Jennifer Granholm, the current head, and ignominious architect of the LNG pause, is a former governor of Michigan and Harvard law graduate with no industry expertise or nuclear background.

The DoE website informs that the National Nuclear Security Administration (NNSA) “is a semi-autonomous Department of Energy agency responsible for enhancing national security through the military application of nuclear science.” Oversight of our nuclear deterrence is a not widely appreciated but vital DoE responsibility.

Ernest Moniz, who led the DoE 2013-17 and his predecessor Steven Chu (2009-13) both under Obama, at least shared a background in science. But the DoE hasn’t had an executive from the energy sector since at least 1998.

Incoming DoE head Chris Wright is CEO of Liberty Energy. Their website includes a lengthy presentation called Bettering Human Lives which was worth reading even before Wright’s appointment. It provides a robust and unapologetic justification for being in the hydrocarbon business, some of which we recently highlighted (see Trump Energizes The Pipeline Sector).

Lifting people out of energy poverty so they can cook with propane or natural gas rather than animal dung is closer to doing God’s work than carpeting open spaces with solar panels and windmills. Chris Wright is no climate denier but will approach global warming as one of several huge challenges along with malnutrition, access to clean water, air pollution, endemic diseases and human rights.

Northern India and parts of Pakistan have endured severe smog in recent days, caused by pollution from burning coal. Schools have closed and residents of affected areas have been advised to stay indoors. They are potential beneficiaries of increased US exports of LNG, since natural gas generates around half the CO2 emissions of coal per unit of energy output. The Sierra Club and other far left progressives have nothing useful to say to these people.

Bettering Human Lives is found under the ESG section of Liberty’s website, unashamedly claiming the moniker with better justification than most. Energy investors have correctly responded with enthusiasm to the likely path US energy policy is about to follow.

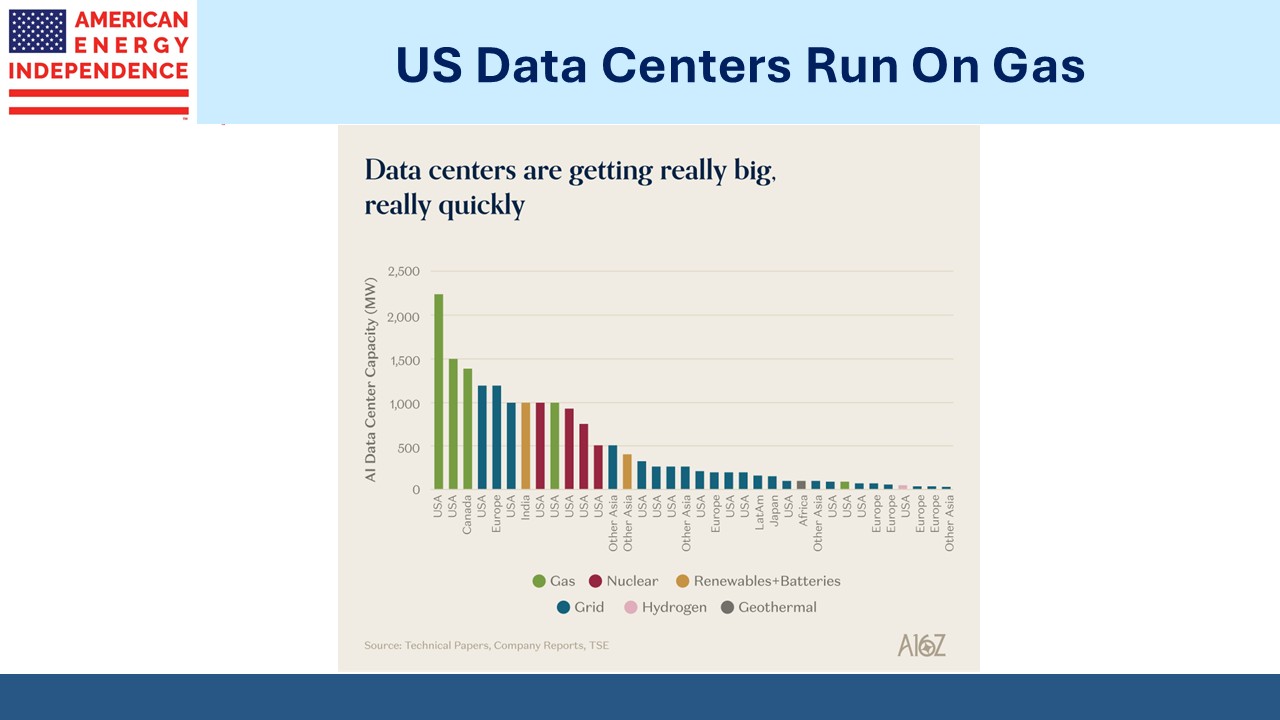
Increased power demand from data centers has provided support for pipeline stocks this year, since natural gas will be the main source of additional electricity. The number of gas-fired power plants either announced or in development duly rose to 148 in September, up from 133 in April according to S&P Global Platts.

.avia-image-container.av-1u3lzg-f0662de1faca7fe68599b7af83fc7aa9 img.avia_image{ box-shadow:none; } .avia-image-container.av-1u3lzg-f0662de1faca7fe68599b7af83fc7aa9 .av-image-caption-overlay-center{ color:#ffffff; }

The map shows most of them in a wide swathe across Texas and into the northeast, in the general area of natural gas production. Although labeled “fossil fuel-fired power plants” they are all natural gas. Coal-burning power plants are being phased out in the US, with the last large one built back in 2013.

Valuations remain attractive, with midstream offering yields of 5% well covered by cashflow. Payouts are rising, companies are buying back stock, leverage is down and valuations still attractive. In our opinion it’s hard to find anything negative to say about the sector’s prospects.

NextDecade (NEXT) had some good news recently, albeit somewhat legally obscure. The U.S. Court of Appeals for the D.C. Circuit ruled that the Council on Environmental Quality (CEQ) wasn’t empowered to issue regulations related to the National Environmental Policy Act. If the CEQ wasn’t top of mind for you, well you’re not alone.

In the summer a panel of the DC Circuit vacated the FERC permit for the construction of NEXT’s Rio Grande’s LNG terminal (see Sierra Club Shoots Itself In The Foot). As a result of the CEQ ruling, NEXT has filed a petition arguing that their permit was wrongly vacated. The entire process is obviously generating healthy legal fees, but more importantly shows signs of heading towards a positive resolution.

Perhaps our incoming DoE head will conclude that the Sierra Club is creating more problems and few solutions with their frivolous lawsuits. It’s time someone took them on.

We have two have funds that seek to profit from this environment:

Energy Mutual Fund

Energy ETF


Pipeline Real Yields Are High

When investors ask what return they should expect from an investment in midstream, we typically suggest dividends plus growth plus buybacks. Dividend yields are around 5%. Wells Fargo is forecasting 4% dividend growth next year, and buybacks of around 2% of market cap. 5% + 4% + 2% suggests an 11% total return, assuming no change in valuation.

Valuations are attractive, with Distributable Cash Flow (DCF) yields above 9% and expected to grow 5-10% over the next few years. Leverage of around 3X Debt:EBITDA is becoming the norm for investment grade midstream companies. An 11%pa return over the intermediate term looks reasonable.

.avia-image-container.av-28fqgrm-ddc87fbc46a0936f87bef8fe66bebca0 img.avia_image{ box-shadow:none; } .avia-image-container.av-28fqgrm-ddc87fbc46a0936f87bef8fe66bebca0 .av-image-caption-overlay-center{ color:#ffffff; }

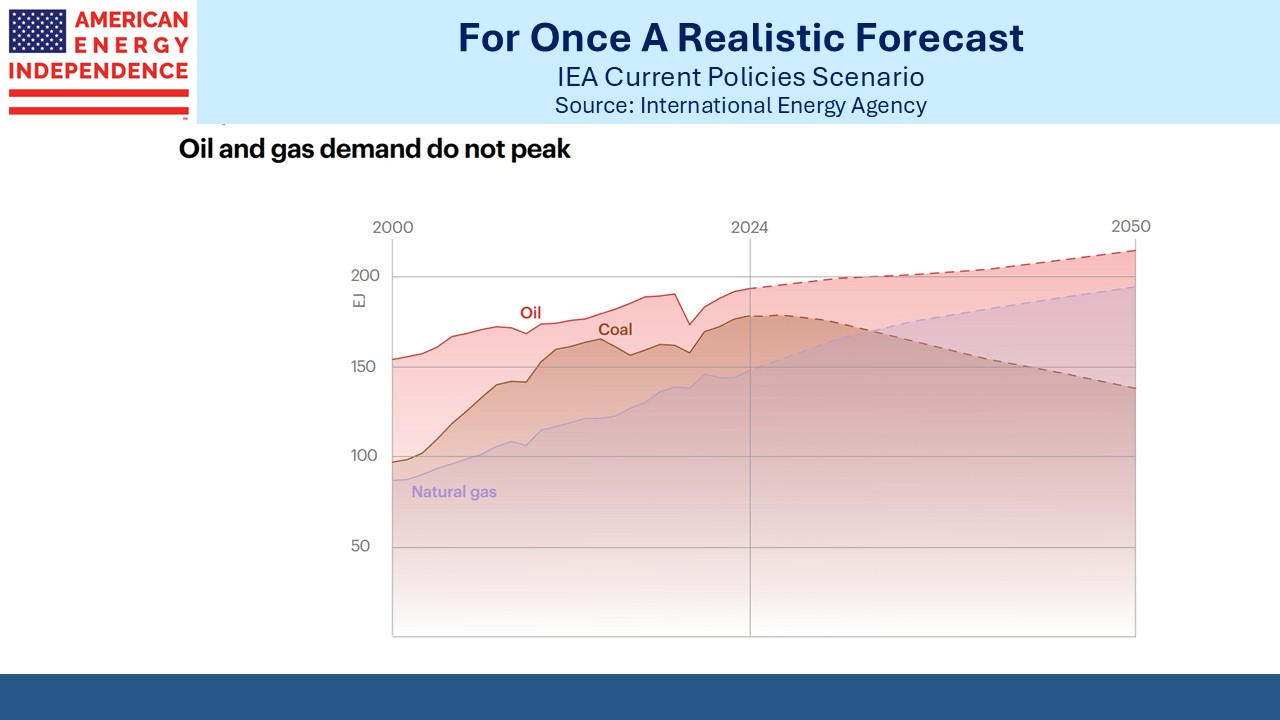
But what about over the long run? For years the energy sector has labored under the fear of stranded assets as the world moves away from hydrocarbons. Experience shows that this was unfounded. Developing countries are driving consumption higher as they seek western living standards. India for example is seeing SUVs increase their share of a rapidly growing domestic auto market.

Status is one reason, but the poor state of Indian roads is another. The clearance between the bottom of a car and the road is critical when potholes and poorly designed speed bumps proliferate. Bigger cars need more gasoline. India is a long way from peak emissions.

.avia-image-container.av-1rsujcy-f87ebf41901a1629dde18ec13858c7e0 img.avia_image{ box-shadow:none; } .avia-image-container.av-1rsujcy-f87ebf41901a1629dde18ec13858c7e0 .av-image-caption-overlay-center{ color:#ffffff; }

Solar and wind are failing to meet the promises of climate extremists. Sloppy reporting routinely claims that these two are the cheapest forms of electricity. This is still not the case as a recent post by the Energy Information Administration showed. And it omits the cost of either battery storage or dispatchable power (usually natural gas) for when it’s not sunny or windy.

Renewables require vast amounts of space. Unlike hydrocarbons, they are not energy- dense. Vaclav Smil, probably the most intelligent writer on energy, shows that an acre of land dedicated to solar power serves 1.21 homes. In the case of wind, it’s 0.17.

You know where this is going.

.avia-image-container.av-12h9r1e-a5cc1d963de506f5001199887192b063 img.avia_image{ box-shadow:none; } .avia-image-container.av-12h9r1e-a5cc1d963de506f5001199887192b063 .av-image-caption-overlay-center{ color:#ffffff; }

There are approximately 145 million US homes. Powering all of them with solar power would require 120 million acres of land dedicated to solar, about 5% of all the land in America. We could put solar panels on every rooftop and we’d still need a lot of space.

If we relied fully on wind it would take almost 38% of our landmass.

We’re going to use more solar and wind, but climate extremists need to embrace nuclear and coal to gas switching to be taken seriously.

The election showed that Democrat climate policies resonate less than illegal immigration and inflation.

Pipelines that move hydrocarbons, especially natural gas, will be here for the foreseeable future. These infrastructure assets have long lives and deliver predictable cashflows that are linked to inflation. Wells Fargo has calculated that roughly half the industry’s EBITDA relies on contracts that incorporate tariff hikes linked to PPI.

Ten year real yields, as defined by Treasury Inflation Protected Securities (TIPS) are 2.1%. With ten year notes at 4.45%, implied inflation is 2.35%. It’s been edging up, and while Republican policies are good for the energy sector there’s little reason to think inflation will be 2%.

Trump ran on an expansionary fiscal platform. Ejecting illegal immigrants, good policy though it is, will tighten the labor market for low-skilled workers. And tariffs could push up prices depending upon how they’re implemented.

Recognizing the risks, Fed chair Jay Powell has paused further rate cuts.

Investors need to protect themselves against inflation that’s 3% not 2%.

.avia-image-container.av-wbjxcy-693fd293385e9bf0c3fdf30d5148c9f8 img.avia_image{ box-shadow:none; } .avia-image-container.av-wbjxcy-693fd293385e9bf0c3fdf30d5148c9f8 .av-image-caption-overlay-center{ color:#ffffff; }

The approximate 5% yields on midstream energy infrastructure translate to a real yield of 2.65%, 0.55% better than TIPS. But while TIPS will keep up with inflation, midstream will likely do better. JPMorgan expects dividend growth rates of 8% for large-cap c-corps over the next couple of years and 4% for large MLPs, both of which are above plausible inflation forecasts.

Given the reliable cashflows that characterize the sector, with dividends likely to consistently grow well in excess of inflation they should have real yields comparable to if not below TIPS. Dividend yields of 4.5% wouldn’t seem unreasonable, similar to treasuries.

The dividend yield on the S&P500 is a paltry 1.2%. Stocks offer a negative real yield of –1.15%, 3.8% less than pipelines, even though the latter comes with widespread inflation-linked tariffs.

Although pipelines have outperformed the market for the past five years, there remains a compelling case for investors seeking inflation protection to own them. That should apply to every one of today’s savers.

The point of investing is to preserve purchasing power. In our opinion midstream offers the best chance to do so.

We have two have funds that seek to profit from this environment:
Energy Mutual Fund

Energy ETF


The Pro-Energy Election

As the market absorbed last week’s election results, energy was the clear winner. On the week, midstream infrastructure returned +8.4% while the S&P500 was +4.7%. The main driver of outperformance is the expectation of a regulatory regime not beholden to climate extremists. The pause on LNG export permits will be lifted. Although many expected this to be the case even with a Harris victory, the ascendancy of Trump and the Republicans means that the government will genuinely seek to facilitate more exports.

The outlook for increased oil and gas production is less clear, 90% of which takes place on private land. Opening up more Federal land to drilling might help at the margin, but E&P companies are widely expected to stick with the capex discipline that has prevailed in recent years.

Midstream economics is about volumes, and we just might be headed towards a Goldilocks period of modestly higher domestic production that retains a focus on per share returns rather than volume growth.

3Q24 earnings have come in mostly at expectations with a few positive surprises. Targa Resources (TRGP) raised their dividend by 33% on the back of strong results. Their stock has returned +136% YTD, a figure that looks more like an AI stock than a stable midstream company.

Natural gas demand looks certain to benefit from AI data centers, with unprecedented capacity additions to power generation widely expected. Energy Transfer reported 16 Billion Cubic Feet per Day (BCF/D) of new natural gas demand, although not all these requests will translate into actual volumes. Total US production is expected to come in at around 103 BCF/D this year. Wells Fargo expects Musk to be an influential White House advocate on AI.


Cheniere once again beat expectations with 3Q EBITDA of $1.48BN, ahead of the $1.41BN consensus number. They raised their FY2024 guidance again and increased their dividend by 15%. The Corpus Christie LNG export terminal loaded its 1,000th cargo in September, bound for Italy. Along with their Sabine Pass facility, they’ve loaded 3,720 cargoes over the past eight years.

It’s also worth noting that while the Democrat climate change agenda didn’t resonate with voters as much as other issues such as immigration or the economy, European buyers of US LNG exports are very climate conscious. Consequently, Cheniere announced steps to achieve the highest standards of methane emissions, recognizing its importance to some of their buyers.

Williams Companies met expectations. Their 3.4% dividend is 2.2X covered by adjusted funds from operations.

The sector remains cheap, as measured by Enterprise Value/EBITDA. 2025 distributable cash flow yields are generally >9% with 10% growth expected 2025-26.

The Trump impact on crude oil prices is hard to gauge. Some additional US production may simply offset less exports from Iran as the incoming administration tightens sanctions. US intelligence found that Iran was trying to assassinate Trump during the election. It’s usually best to be successful in such attempts. “When you strike at a king, you must kill him” is attributed to Ralph Waldo Emerson.

In his first term Trump squeezed Iran with sanctions, and this time around will be similar.

Russian oil has generally been getting to buyers, albeit at discounted prices. Crude notably weakened in the days following the election. Oil prices have decoupled from the pipeline sector, reflecting different economics and reduced midstream leverage.

US natural gas prices should move higher. LNG exports are already set to double over the next five years as new terminals are completed. Going from 12-24 BCF/D will mean almost a quarter of US output is going overseas. And Trump has promised an improved regulatory environment, which will help although the legal system remains a tool for climate extremists to impose delays and uncertainty.

NextDecade rallied strongly following the election. Phase 2 of their development will now be freed of the LNG export permit pause that the Biden administration imposed early in the year. The more immediate challenge is for FERC to issue a revised Environmental Impact Statement after a DC circuit court rejected the one in hand (see Sierra Club Shoots Itself In The Foot).

The US badly needs to reform its permitting process to prevent climate extremists from finding a liberal judge to overturn issued permits on an environmental technicality. This will require Congressional action, and while both parties should be able to find areas of agreement, the outlook is unclear following the election.

The COP29 climate conference begins this week in Baku, the capital of Azerbaijan, a major exporter of hydrocarbons. The US is expected to withdraw from the Paris Agreement, the third time the US has left a global climate accord.

Two thirds of Azerbaijan’s GDP depends on hydrocarbons, so it takes an especially gullible liberal to believe that country has a sincere interest in reduced global emissions. China continues to persuade apologists to overlook their enormous coal consumption (>55% of the world’s total) and instead praise their huge commitment to solar and wind. China is more correctly viewed as increasing their reliance on domestic energy sources, both renewables and hydrocarbon.

Increased US LNG exports will continue to help the planet by displacing coal consumption.

In our opinion, US natural gas infrastructure remains in the sweet spot of investment opportunities following the election.
We have two have funds that seek to profit from this environment:
Energy Mutual Fund

Energy ETF


Trump Energizes The Pipeline Sector

Donald Trump’s political comeback looks a lot like the recovery in the energy sector. In March 2020 during the pandemic pipeline stocks slumped as crude oil prices briefly turned negative. Within a year Trump was out of office, faced numerous civil and criminal charges and was widely believed to be a one-term president. By then midstream had rebounded but fears that the energy transition would lead to stranded assets caused many to remain skeptics.

But inexorably, substance overcame style. Between friends at golf clubs and energy investors my interactions are overwhelmingly with Republicans. My perspective is that Trump campaigned on policies while Harris argued that he was unfit for office. Voters pragmatically chose the substance of Republican policies, overcoming any misgivings about Trump the candidate.

In the energy business, over-hyped renewables have been an investment bust while hydrocarbons have maintained their >80% share of the world’s expanding consumption of primary energy. The substance of reliability has trumped the style of virtue-signaling.

The discrediting of excessive PC, DEI, ESG and the rest of the woke acronyms helped both Trump and energy. A couple of years ago a friend at JPMorgan told me that employees were being encouraged to add their pronouns to their profiles on Bloomberg. I don’t think they/them realized how irritating that is for the rest of us not struggling with our gender.

The moment of maximum absurdity had been reached. Woke is broke.

.avia-image-container.av-4h397pq-8ea6b0550b6c36548ffdbf52719ac0a7 img.avia_image{ box-shadow:none; } .avia-image-container.av-4h397pq-8ea6b0550b6c36548ffdbf52719ac0a7 .av-image-caption-overlay-center{ color:#ffffff; }

BP until recently apologized for producing what the world wants. Browbeaten by left wing climate extremists they promised to kick their hydrocarbon habit. But investing in renewables leaves a big fortune smaller, and with their stock price slumping BP has belatedly acknowledged the market’s rejection of this strategy (see BP Decides To Follow The Money).

Midstream outperformed on Wednesday as markets digested the news. NextDecade rallied sharply because of the improved regulatory environment for LNG.

.avia-image-container.av-3qf1b9q-0e3a504cb5e5ee2eaba8b36ae6b9dbf2 img.avia_image{ box-shadow:none; } .avia-image-container.av-3qf1b9q-0e3a504cb5e5ee2eaba8b36ae6b9dbf2 .av-image-caption-overlay-center{ color:#ffffff; }

Liberty Energy (LBRT) provides fracking services to oil and gas E&P companies. In an inspiring and informative report called Bettering Human Lives, they claim the moral high ground from the climate extremists. Employees at Liberty “relentlessly dedicate our lives to energizing the world” They know that hydrocarbons have, “transformed the human condition over the last two centuries.” They reject the dystopian vision of that wretched little girl Greta, AOC and her squad, and the Sierra Club who all promote policies that will make life shorter and more miserable for billions of people.

.avia-image-container.av-3itirym-3842905dc4f2be8f7b9c8a032ed64a20 img.avia_image{ box-shadow:none; } .avia-image-container.av-3itirym-3842905dc4f2be8f7b9c8a032ed64a20 .av-image-caption-overlay-center{ color:#ffffff; }

The Liberty Energy report doesn’t deny climate change but places it behind malnutrition, access to clean water, air pollution, endemic diseases and human rights as problems more deserving of the world’s attention. It acknowledges that temperatures and sea levels are rising because of human generated CO2, accelerating a trend that started in the mid-19th century at the end of the “little ice age”.

.avia-image-container.av-3462v5a-53ca7f80ff0e6e3f413f350b5a868d83 img.avia_image{ box-shadow:none; } .avia-image-container.av-3462v5a-53ca7f80ff0e6e3f413f350b5a868d83 .av-image-caption-overlay-center{ color:#ffffff; }

Every hurricane, flood and heatwave is blamed on global warming. But the data shows that global losses from extreme weather events as a % of GDP are falling, as are US flood losses. Global deaths are down 90% since 1900 even as the world’s population has increased five-fold. We are better prepared, through greatly improved weather forecasts and stricter building codes.

.avia-image-container.av-2j256lq-665f84e1b22fbcee0de033e56cd0b31c img.avia_image{ box-shadow:none; } .avia-image-container.av-2j256lq-665f84e1b22fbcee0de033e56cd0b31c .av-image-caption-overlay-center{ color:#ffffff; }

What’s most striking is the modest projected losses in GDP from increased temperatures of as much as 4 degrees C by 2100. Various independence forecasts are remarkably similar, at around a 3-4% loss of GDP in plausible extreme scenarios. It may sound a lot, but a 4% smaller GDP by 2100 means annual GDP growth of 0.06% less in the meantime. Even a 2100 GDP that’s 15% smaller than it would otherwise be, which is at the extreme end of forecasts, would reduce annual GDP growth by 0.22%.  

Estimates of the annual investment needed to combat climate change are in the $TNs, out of a global GDP of $110TN. The International Energy Agency says annual clean energy investments of $4TN are needed, 3.6% of global GDP. The policy recommendations of climate extremists are devoid of any cost-benefit analysis, since they’d throw 25X or more at the problem every year than its annual cost.

.avia-image-container.av-21n3ga6-7d3e3533296602f6fd3bf2effc79a39e img.avia_image{ box-shadow:none; } .avia-image-container.av-21n3ga6-7d3e3533296602f6fd3bf2effc79a39e .av-image-caption-overlay-center{ color:#ffffff; }

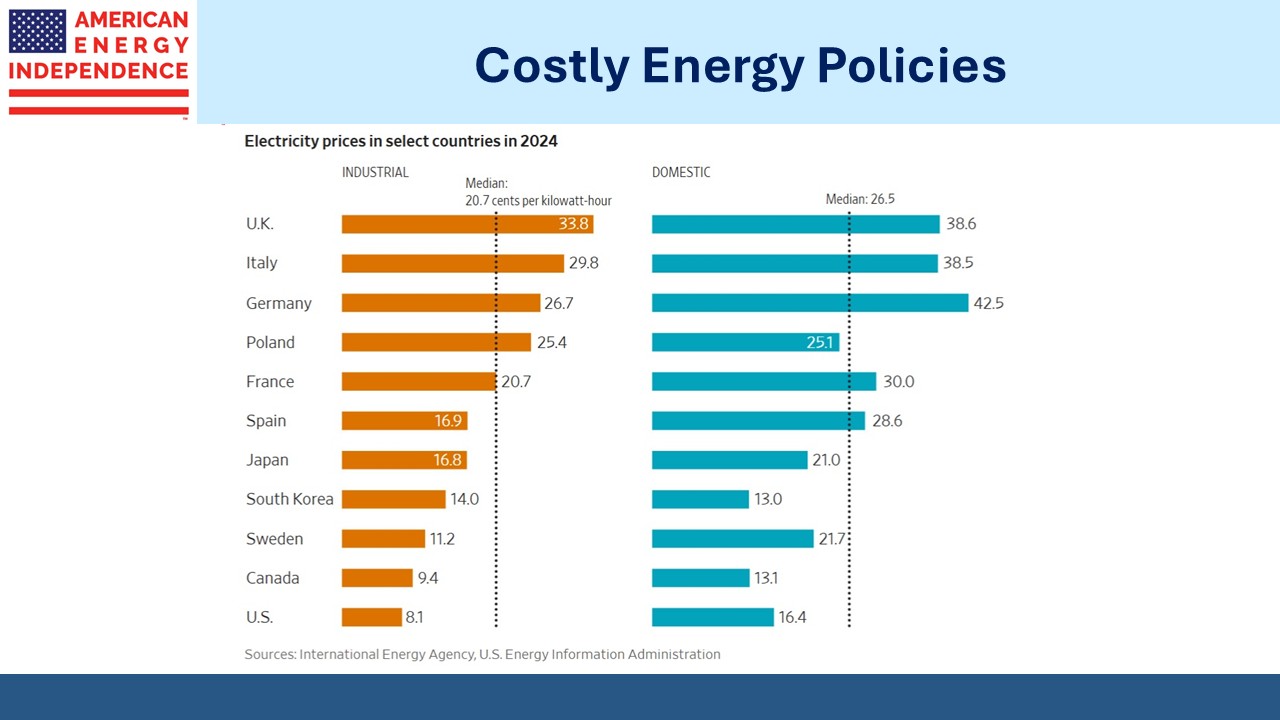
Germany’s embrace of wind, rejection of nuclear and consequent reliance on coal to compensate for lost Russian natural gas is a form of economic self-flagellation that is leading to ruinously high energy prices, de-industrialization and no GDP growth (see Germany’s Costly Climate Leadership). Volkswagen is planning to close three factories, lay off tens of thousands of workers and impose 10% pay cuts because their commitment to EVs exceeds the enthusiasm of buyers.

.avia-image-container.av-69yhvy-6e33573a9382292a888a7d764e94b893 img.avia_image{ box-shadow:none; } .avia-image-container.av-69yhvy-6e33573a9382292a888a7d764e94b893 .av-image-caption-overlay-center{ color:#ffffff; }

The US has for the most part avoided such missteps apart from a few blue states. While American voters rejected extreme climate policies, as if on cue Germany endured a period of “dunkelflaute”, a wonderfully Teutonic word for endless calm, cloudy days that render wind and solar impotent.

.avia-image-container.av-16995la-d30da81d23789579d3fa17b1c91c0d9c img.avia_image{ box-shadow:none; } .avia-image-container.av-16995la-d30da81d23789579d3fa17b1c91c0d9c .av-image-caption-overlay-center{ color:#ffffff; }

Finally, an illuminating chart showing median real household income. 4.1% unemployment shows everyone who wants a job can have one, and this blog often celebrates the strong US economy with its per capita GDP moving ever farther from former peers in the EU. But while the average looks good, the median household has lost purchasing power over the past four years.

.avia-image-container.av-ofql9q-a6245b75e1e92fa20f934b0d946f6c22 img.avia_image{ box-shadow:none; } .avia-image-container.av-ofql9q-a6245b75e1e92fa20f934b0d946f6c22 .av-image-caption-overlay-center{ color:#ffffff; }

The $1.9TN American Rescue Plan in 2021, the first major piece of legislation under incoming President Biden, was an excessive fiscal response to Covid at a time when a vaccine was available, and treatments were improving. It led to the 2022 inflation that so many voters maintain has left them worse off, driving them to vote Republican. Similar episodes of falling real incomes in 2008 (Great Financial Crisis) and 1990 (First Iraq War, Bush sr. tax hikes) also led to a change in the White House.

As Jim Carville said, “It’s the economy, stupid.”

We have two have funds that seek to profit from this environment:

Energy Mutual Fund

Energy ETF


There’s No AI in AMLP

Performance in the pipeline sector remains strong – closing in on its fourth straight year beating the S&P500 and ahead overall for the past five. But for the past six months the Alerian MLP Infrastructure ETF (AMLP) has increasingly lagged the sector, as defined by the American Energy Independence Index.

AMLP is more or less tracking its index, the Alerian MLP Infrastructure Index (AMZIX), although taxes are opening up a gap here too. It’s 2.4% behind over the past year through September. Over 4% of its NAV is set aside for future taxes.

Between December 2022 and June 2023 AMLP took two NAV adjustments as their accountants revised their tax calculations (see AMLP Trips Up On Tax Complexity and AMLP Has Yet More Tax Problems).

Being a tax-paying ETF is complicated. Those two adjustments added up to over 6% of NAV.

Last year AMLP cut its distribution (see AMLP Fails Its Investors Again) even though MLPs were raising payouts.

But the problem is that the AMZIX index which AMLP tries to track represents a shrinking subset of midstream infrastructure, since it’s limited to MLPs. AMLP labors under the same burden.

.avia-image-container.av-m47h3d-8f10c1854f7bc6df0f1f434936babadd img.avia_image{ box-shadow:none; } .avia-image-container.av-m47h3d-8f10c1854f7bc6df0f1f434936babadd .av-image-caption-overlay-center{ color:#ffffff; }

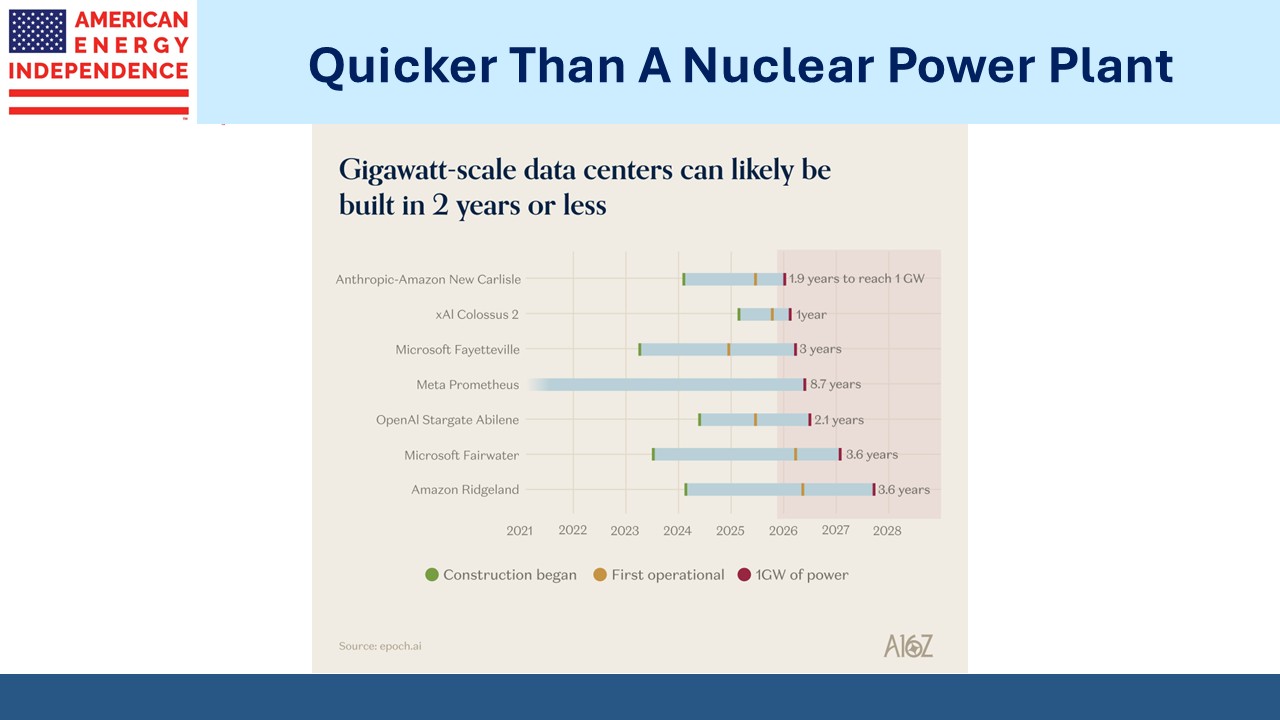
The boom in data centers to support AI is driving electricity demand up. Nuclear power is enjoying a renaissance with several of the Fabulous Five announcing plans to rely on dedicated nuclear plants to provide electricity to their new data centers.

These are positive steps for everyone outside of the Sierra Club with its dystopian vision for humanity. But these new sources of nuclear power won’t be available until well into the next decade.

In many regions of the US grids are revising their ten-year demand outlook from 0-1% pa to 5% pa or more. Natural gas is the only plausible solution, since data centers need to run 24/7 not simply when it’s sunny or windy.

This realization has boosted midstream infrastructure. Williams Companies (WMB) CEO Alan Armstrong recently told investors, “… we frankly are kind of overwhelmed with the number of requests.”

WMB is up over 50% YTD as they recalibrate demand across their extensive natural gas pipeline network.

MLPs generally haven’t enjoyed the same uplift, because they tend to be more focused on liquids than gas. In recent years many MLPs converted to c-corps, the conventional corporate form for US businesses, so as to eliminate K1s in favor of 1099s. They concluded that making their stock available to all buyers of US equities and not just those willing and able to invest in partnerships was worth foregoing the tax efficiency of the MLP structure.

Natural gas MLPs have had an additional incentive to convert to corporations since 2018 when the Federal Energy Regulatory Commission (FERC) issued a ruling that impeded their ability to incorporate tax expense in their calculation of tariffs for cost of service pipelines.

Prior to 2018 natgas MLPs could include in their cost of service calculations an estimate of the taxes paid by their MLP unitholders. Of course they didn’t actually know what those taxes were, so they made a good faith estimate. Then FERC reversed the rule. Faced with a less generous rate-setting regime, most converted to c-corps.

As a result, there aren’t any pureplay natural gas pipeline MLPs although some like Energy Transfer do operate gas pipelines within their mix of businesses.

As MLPs have become less representative of the midstream sector, so has AMLP. Its relative underweight to natural gas pipelines means it has missed out on the AI-driven rally such stocks have enjoyed. Global sales of gas turbines are forecast to be up 5% this year, driven by the need to power data centers, EV sales and to compensate for intermittent solar and wind. Midstream energy is seeing the benefits of this.

In other news, FERC rejected a plan by Talen Energy’s Susquehanna Nuclear facility to provide power to Amazon data centers. The regulator felt there was some risk that rates could rise for other customers on the PJM grid. This setback is unique to the Talen plant and doesn’t affect plans announced by Microsoft and Google to rely on nuclear power for their planned data centers.

In a note on Monday Wells Fargo predicted this could shift gas demand to Texas, where unlike PJM their ERCOT grid operates outside of FERC regulatory oversight. The net result is that the demand outlook for natural gas continues to be robust.

The impact from AI is rippling unevenly across midstream, benefiting natural gas c-corps but not liquids-oriented MLPs.

We have two have funds that seek to profit from this environment:
Energy Mutual Fund

Energy ETF


Which Pipeline Companies Are Best At Capital Allocation?

An axiom of capitalism is that a business must earn a Return On Invested Capital (ROIC) in excess of its Weighted Average Cost of Capital (WACC). It’s just as true for a lemonade stand as for a conglomerate.

I should note here that fifteen years ago our younger daughter (then about nine years old) set up a lemonade stand at the end of our backyard on the 12th tee at our golf club. Due to the generosity of the golfers passing by she earned an excessively high ROIC. This should have invited competition, but she sensibly took early retirement, concluding that capitalism wasn’t that complicated.

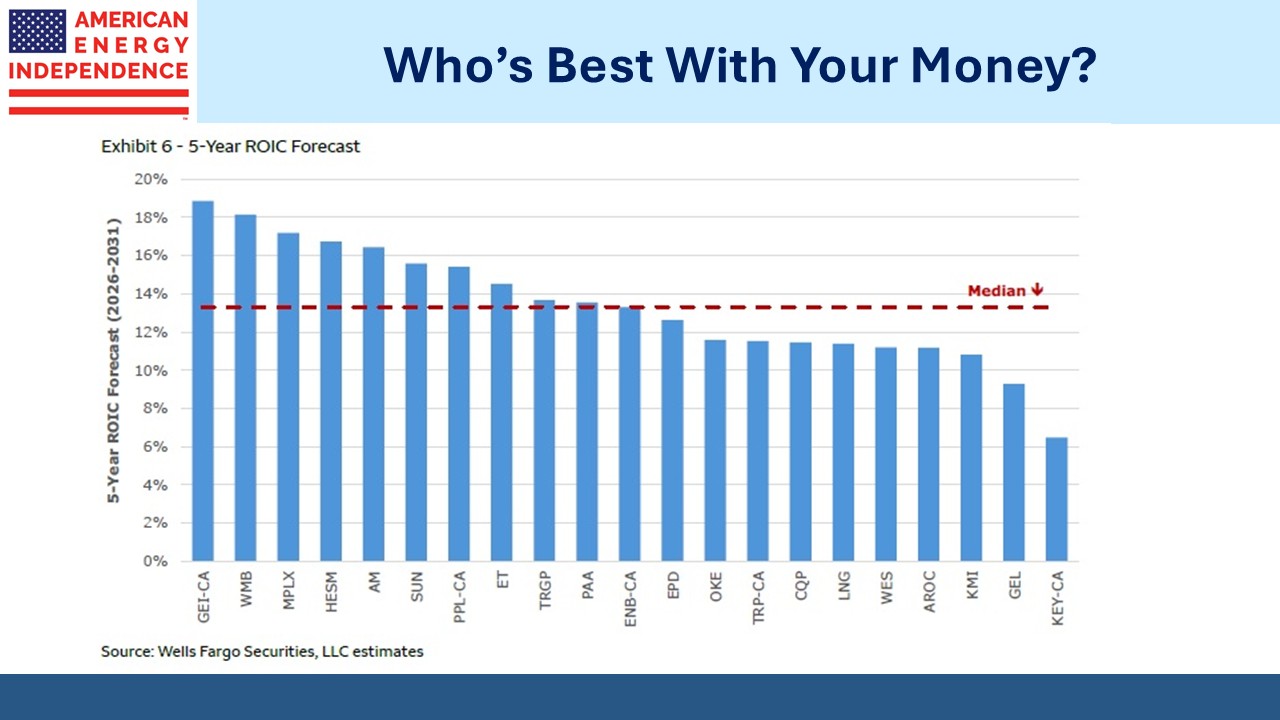
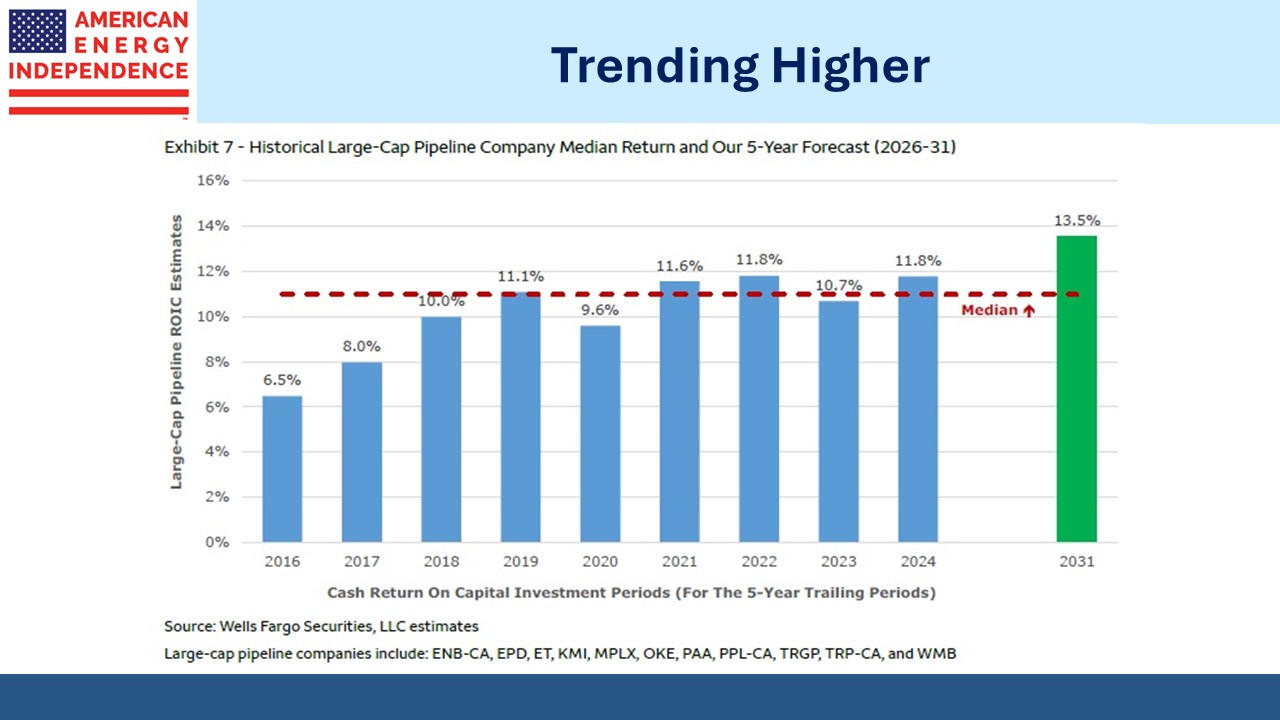
Wells Fargo recently updated their estimates of ROIC for midstream energy infrastructure companies. Results varied widely. They define this as capital invested versus change in EBITDA over rolling five-year periods. It’s not a perfect measure – for example, it excludes the management of existing assets. And a project that was funded at the end of the five years will generate future EBITDA not captured in the calculation.

.avia-image-container.av-14hyrz3-88b0eee25ff761c0a1847df606e0e5ee img.avia_image{ box-shadow:none; } .avia-image-container.av-14hyrz3-88b0eee25ff761c0a1847df606e0e5ee .av-image-caption-overlay-center{ color:#ffffff; }

Nonetheless, over time it offers a decent measure of how effectively management teams are making capital allocation decisions.

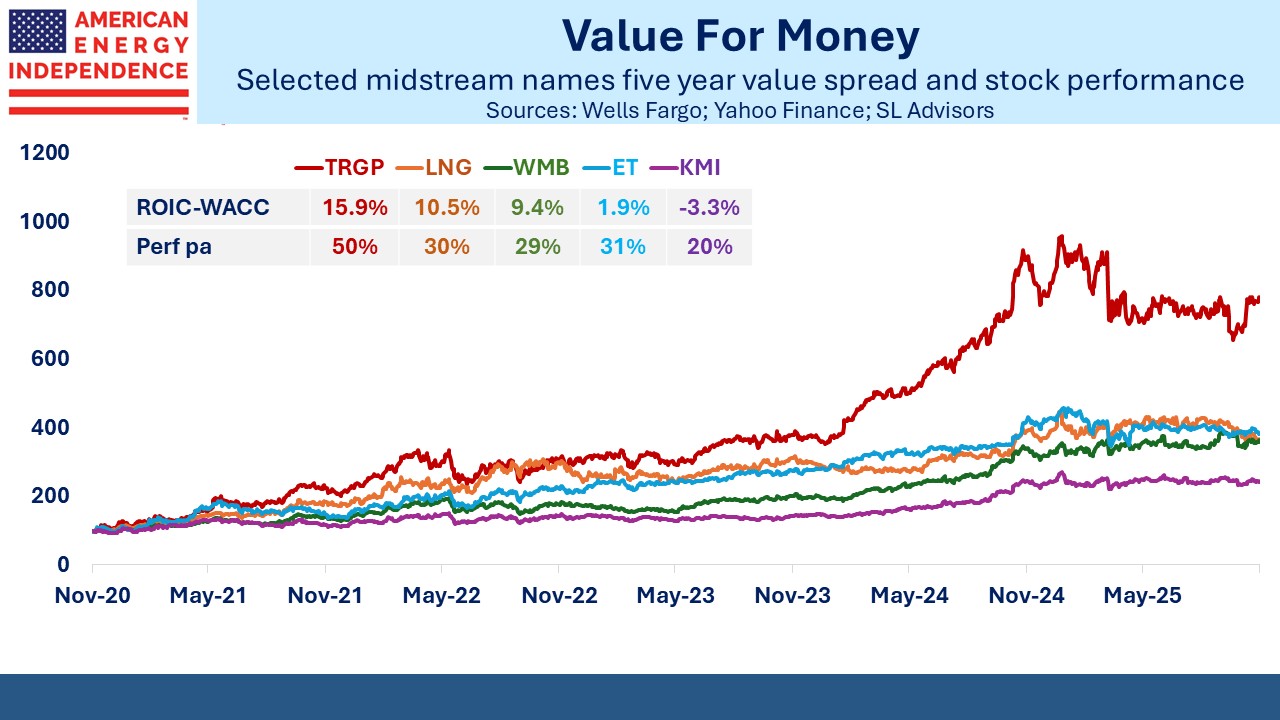
The first chart compares returns with cost of capital, or ROIC against WACC. Less risky businesses in theory enjoy a lower WACC, allowing them to profitably invest in lower return projects. The bigger the gap between ROIC and WACC, the happier the investors are. Cheniere (LNG) stands out as earning their owners a substantial return. Williams Companies (WMB) and Targa Resources (TRGP) are also very good.

At the other end, Kinder Morgan’s (KMI) capital allocation earned an inadequate return.  The calculation for Plains All American (PAA) shows that their projects generated negative EBITDA, although this was more accurately the result of lower fees on Permian oil pipeline tariffs when they negotiated new rates.

Five years may be too short a time to judge. But Wells Fargo shows that skill in capital allocation seems to be persistent, in that for KMI and PAA, the results don’t look much better over the past decade either. When these companies talk excitedly about the growth projects they’re planning to finance, the non-fawning analyst might enquire whether their track record justifies such enthusiasm.

Of course, a business can perform well because of great returns from assets it already owns. The weak capital allocators in recent years are being supported by better decisions made long ago by their predecessors on the management team.

.avia-image-container.av-qvbgcf-b8aef881c9ea181085d25b5e7762407b img.avia_image{ box-shadow:none; } .avia-image-container.av-qvbgcf-b8aef881c9ea181085d25b5e7762407b .av-image-caption-overlay-center{ color:#ffffff; }

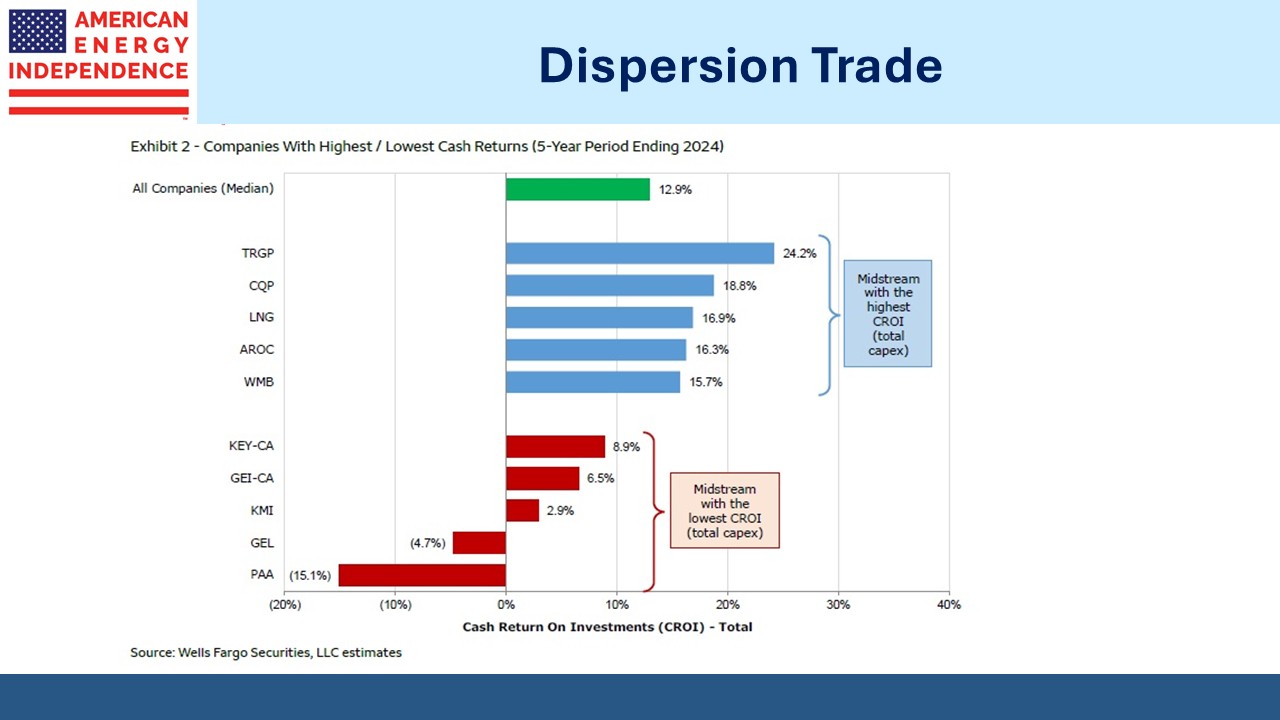
One would expect that proficiency in capital allocation drives longer term returns, and the second chart shows that’s generally true.

Targa Resources (TRGP) is the standout here. Five years ago TRGP was often criticized for its capex plans at a time when most companies were cutting spending after several years of poor returns. We were among the critics (see When Will MLPs Recover?).

In November 2019 we wrote, “Former CEO Joe Bob Perkins flippantly talked about new projects as ‘capital blessings’. Investors won’t miss his self-serving arrogance.”

It turns out that those decisions were on balance good ones. However, the same math showed that over the prior decade 2009-19, TRGP’s ROIC on capex ranged between 3% and 6%, so our skepticism was well founded. They showed that results can improve, although it’s uncommon.

One of TRGP’s best decisions was in 2018 when they took a majority stake in the Grand Prix NGL pipeline. By bringing NGLs from the Permian in West Texas to their Mont Belvieu processing facility and Galena Park export terminal in Texas they became more vertically integrated. In January 2023 they took complete control of Grand Prix by acquiring Blackstone’s remaining 25% interest.

Cheniere has both the best spread of ROIC vs its WACC as well as the highest overall ROIC. Completing projects on time and under budget helped. Cheniere also profited from the jump in global natural gas prices following Russia’s 2022 invasion of Ukraine.

Cheniere is benefiting from substantial capex in prior years. Their export terminals require comparatively little spending on upkeep. Their maintenance capex as a % of EBITDA is consistently at the low end of their peer group, which feeds through into a higher ROIC.

TC Energy was hurt by cost overruns on their Coastal Gas Link pipeline in Canada and spending on the proposed Keystone XL crude pipeline, which President Biden canceled in January 2021 shortly after taking office.

Looking ahead, Wells Fargo generally expects history to repeat, Differentiating among companies based on their capital allocation is one of the most important variables to consider in constructing a portfolio.  We expect the industry to continue delivering good results on this metric.

We have two have funds that seek to profit from this environment:
Energy Mutual Fund

Energy ETF


The Climate Benefits Of LNG

The pause in issuing new Liquefied Natural Gas (LNG) permits is among the least defensible energy policies of this Administration. It has been widely criticized. Jamie Dimon called it naive, and the International Energy Agency worries that it will impede the supply of natural gas on global markets.

The US Department of Energy (DOE), which grants LNG export permits, has published studies (2014 and 2019) which concluded that when buyers of LNG use it to switch away from coal for power generation, it reduces global Green House Gas emissions (GHGs). Coal use is widespread in developing countries and is increasing along with overall electricity demand.

.avia-image-container.av-1ycoc1i-25c571bd9fe8724f0eb8dc695cfa4207 img.avia_image{ box-shadow:none; } .avia-image-container.av-1ycoc1i-25c571bd9fe8724f0eb8dc695cfa4207 .av-image-caption-overlay-center{ color:#ffffff; }

Non-OECD countries represented 85% of global coal consumption last year, up from 82% in 2022. China is 56% of the global total, where it is by far their biggest source of primary energy.

In the hunt for votes, the White House dropped careful analysis in favor of pandering to climate extremists and granting the permit pause they’d long sought. LNG exports allow us to support our friends and allies with cheap, reliable energy, so are in our national interest. But even if you’re a far left progressive with little care for such things, they also reduce global emissions.

Climate extremists focus on the wrong things, like banning new natural gas connections in New York. Their opposition to LNG exports harms the climate. The following math shows why:

The US Energy Information Administration (EIA) estimates that a coal-burning  power plant generates 2.3 lbs of CO2 per Kilowatt Hour (KwH) of electricity, compared with 0.97 lbs for a natural gas power plant. Converting to metric, since GHGs are measured in Metric Tonnes (MTs), this is 1,044 grams for coal and 440 grams for natural gas.

Incidentally, in researching this I was interested to learn that virtually all the carbon atoms in natural gas (methane, CH4) attach themselves to oxygen when burned, creating CO2 in approximately the same volume as the methane that was used. CO2 is around 30% heavier than methane, both of which are denser than air*.

Returning to electricity – per KwH of power generation natural gas produces 604g less CO2. According to the EIA, it takes 7.42 cubic feet of gas to generate 1 KwH of power. So each cubic foot of gas reduces CO2 emissions by 81g (604/7.42) assuming it displaces coal in power generation.

.avia-image-container.av-1ipoueu-6b897b49b9d1261f61c4e648cd3bec22 img.avia_image{ box-shadow:none; } .avia-image-container.av-1ipoueu-6b897b49b9d1261f61c4e648cd3bec22 .av-image-caption-overlay-center{ color:#ffffff; }

The US currently exports around 12 Billion Cubic Feet per Day (BCF/D) of LNG. Maintaining the assumption that this gas is being used instead of coal, 81g  X 12 billion X 365 days means that our exports are reducing CO2 emissions by 356 million MTs annually.

Among non-OECD countries this is closest to the annual CO2 emissions of Vietnam (328 million MTs). Over the next five years our LNG exports will double, in spite of the LNG permit pause, because of LNG export terminals already approved and under construction. At that level the CO2 benefit will be almost equal to Indonesia’s emissions of 692 million MTs.

.avia-image-container.av-z3zr2u-3e1a3bd141c468ec2c80c51485577dff img.avia_image{ box-shadow:none; } .avia-image-container.av-z3zr2u-3e1a3bd141c468ec2c80c51485577dff .av-image-caption-overlay-center{ color:#ffffff; }

Most of the drop in US CO2 emissions over the past 15 years is because of coal-to-gas switching. US LNG exports offer the potential to spread that success to other countries. Climate extremists may argue that there’s no guarantee buyers of LNG will use it to reduce coal consumption. But it wouldn’t be hard to make this a condition of export approval.

Moreover, coal emits other local pollutants including nitrous oxides and sulfur dioxides which cause lung damage and lead to millions of premature deaths. So the benefits of natural gas are more than just the 58% reduction in CO2 emissions.

Some may point to methane leaks from gas production as weakening the case. But US standards are higher than elsewhere. We are the leader in having the lowest leaks per unit of production. The world benefits when countries buy from America rather than from another country with lower standards.

.avia-image-container.av-ph2gvq-87e516178875dd20d58d395987a52b59 img.avia_image{ box-shadow:none; } .avia-image-container.av-ph2gvq-87e516178875dd20d58d395987a52b59 .av-image-caption-overlay-center{ color:#ffffff; }

Climate extremists such as the Sierra Club and that wretched little girl Greta regularly push for policies that are impractical and will reduce living standards, most especially for people in developing countries. They have an outsized influence over the Democrats, which allows their poorly conceived ideas to sometimes escape into the light of day.

The US has already achieved substantial success in reducing emissions while renewables have remained an inconsequential part of our primary energy.

Texas is the country’s biggest user of windpower and Florida is 3rd in solar. Massachusetts imports LNG because it won’t allow new gas pipelines and California combines the highest electricity prices bar Hawaii with the least reliable grid.

Red states have more coherent energy policies than blue ones.

Betting on a shift to pragmatic energy policies has been the key to superior returns. We think that will continue to be the case. Long natural gas infrastructure and short renewables has worked for years.

If Kamala Harris loses next week, the influence of climate extremists will not be missed.

*A blog reader offered this detailed chemical analysis which is shown in full:

The mole balance equation for burning nat gas is pretty simple as there is only one carbon atom on both sides of the equation, which means (assuming complete combustion), each mol of CH4 generates 1 mol of CO2.

At standard temperature (0 degrees C) and pressure (sea level), all gases have 22.4 L of volume per mole, so the volumes of CH4 and CO2 should indeed be the same (assuming complete combustion). 

I am pretty sure that H is 1 g/mol, C is 12 g/mol, O is 16 g/mol, and N is 28 g/mol, so:

Methane (CH4) is 16 g/mol

Carbon Dioxide (CO2) is 44 g/mol

Each g of Carbon will emit 44/12 = 3.67 g of Carbon Dioxide if fully combusted. 

Air, which is roughly 80% N and 20% O is 29 g/mol

CO2 is roughly 50% heavier (denser) than air and natural gas is roughly 50% lighter than air, when all are at standard temperature and pressure. 

I believe the CO2 is considerably less dense upon emission because of the heat produced by combustion, but CO2 is still technically denser than air and almost 3x the density of CH4.

I think the EIA publishes that the average US gas-fired power plant consumes 7,730 Btu of energy per kWh and US nat gas contains on average 1,040 Btu / ft^3.

That means it takes 7.4 ft^3 of nat gas to generate 1 kWh. There are 3.28 ft / m, so 7.4 ft^3 = 211 L of nat gas to generate 1 kWh of electricity.

I think that the EIA uses 60 degrees F or roughly 15 degrees C (288 degrees K) for its reporting, so you adjust the volume of one mole of gas by 288/273 x 22.4 = 23.6 L, so I think that the density of nat gas is reported by EIA is 16/23.6 = 0.68 g / L, which means it takes 8.9 moles of of CH4 with 143 g of mass to generate 1 kWh of electricity.

The 8.9 moles of nat gas should produce 8.9 moles of CO2 with density of 44 g/mol = 392 g CO2. 

Pretty close to your number of 440 g. 

The math is a bit trickier for coal, because coal typically has a mix of long chain carbon molecules and various impurities, but I think thermal coal, which is now mostly Chinese coal, has on average energy density of roughly 19 MJ / kg and contains about 52% carbon by mass. 

The EIA reports that the average US coal-fired power plant consumes 10,500 Btu per kWh of electricity. At 948 Btu / MJ, that is 11 MJ or 11/19 = 0.58 kg of coal consumed per kWh. 

At 52% carbon content, that would be 0.30 kg of carbon generating 0.30 x 44 / 12 = 1.10 kg of CO2. 

Pretty close to your 1,044 g.

Note that natural gas energy density of 1,040 Btu per ft^3 translates into 57 MJ/ kg, which is 3x coal’s energy density of 19 MJ/kg. 

1,040 Btu/ft^3 / 948 Btu/MJ = 1.1MJ/ft^3

1.1 MJ/ft^3 x (3.28 ft/m)^3 = 38.7 MJ/m^3

38.7 MJ/m^3 / 0.68 kg/m^3 = 57 MJ/kg

The two simple reasons why natural gas produces 65% less CO2 that coal:

1) Natural gas has 3x the energy density of coal (57 vs. 19 MJ/kg).

2) Natural gas burns 36% more efficiently than coal: 7,730 vs 10,500 Btu input energy per kWh (3,412 Btu) of electricity produced.

As an aside, some people are concerned that fugitive methane emissions might change this answer, but the data from the EIA and the Energy Institute shows that coal production and processing actually generates more fugitive methane emissions per unit of useful energy than natural gas production and processing.

According to the IEA, in 2023 natural gas production and processing generated 29 Mtpa of fugitive methane for 144 EJ of primary energy, which is 0.20 g CH4 per MJ of primary energy.

Coal production and processing generated 40 Mtpa of fugitive methane emissions for 164 EJ of primary energy , which is 0.24 g CH4 per MJ of primary energy, 20% more than natural gas. 

Because coal requires 36% more primary energy that natural gas to generate a kWh of electricity, coal produces 0.74 g of fugitive methane emissions per kWh of coal-fired electricity. 

That is 64% more than the 0.45 g of fugitive methane emissions from natural-gas fired electricity.

Using the IPCC’s recommended 100 year Global Warming Potential values of 29 for CH4 and 1 for CO2, the 0.74 g of CH4 from coal-fired electricity translates into 21.5 g CO2 equivalent and the 0.45 g of CH4 from gas-fired electricity translates into 13 g CO2 equivalent.

After factoring in fugitive methane emissions, coal-fired power emits 1.13 kg CO2e / kWh, which us 2.8x the 405 g of CO2e per kWh of gas-fired electricity.

After factoring in fugitive methane, gas-fired electricity has 64% less CO2 equivalent emissions then coal-fired electricity. 

We have two have funds that seek to profit from this environment:
Energy Mutual Fund

Energy ETF


The Natural Gas Energy Transition

The long term demand outlook for natural gas continues to improve. India is likely to double its consumption by 2040, and much of that will rely on imports of Liquefied Natural Gas (LNG). This will offset coal consumption, lowering local pollution as well as CO2 emissions.

The International Energy Agency (IEA), normally a tireless promoter of renewables, is warning that insufficient investment in new gas production risks supply shortages. They blame regulatory challenges for impeding the growth of much-needed LNG exports. The White House should take note.

The US is seeing the fastest growth in new gas-fired power production in years, as utilities gear up for rising electricity demand from data centers. The renaissance that nuclear power is enjoying is a positive step, but the deals announced by Microsoft, Google and Amazon won’t deliver power until the 2030s. Data centers are being built now.

The media coverage of the energy transition is so relentlessly one-sided that you might think the constructive outlook for natural gas is a minority view. Current US exports of LNG should double over the next five years, from 13 Billion Cubic Feet per Day (BCF/D) to around 25 BCF/D. Domestic prices remain low, at around $2.50 per Million BTUs (MMBTUs). The European TTF benchmark is around $13 and the Asian JKM above $13.50. Increased US exports will close some of the regional price gap.

November 2026 US natural gas futures are at $3.80 per MMBTU, around $1.30 above spot prices. In a sign that prices may need to rise, on Friday the Energy Information Administration (EIA) reported that the output of dry gas from shale formations is on track to be down this year. This would be the first time since the EIA started tracking such data in 2000.

As our investors and blog readers know, we are biased towards natural gas. The belief that solar and wind would soon displace hydrocarbons as the world’s most important source of energy never convinced us. Energy demand is growing, driven by developing countries seeking higher living standards.

Media articles routinely hail the growth in solar and wind capacity, and yet that growth hasn’t even been sufficient to meet the demand for new energy. Hydrocarbons have provided around 80% of the world’s primary energy for decades and it’s barely changed during the 21st century.

The truth is the only energy transition going on is to natural gas.

.avia-image-container.av-21wdyo-c807c69978305c7d701954c7ec4b7d60 img.avia_image{ box-shadow:none; } .avia-image-container.av-21wdyo-c807c69978305c7d701954c7ec4b7d60 .av-image-caption-overlay-center{ color:#ffffff; }

Moreover, renewables are a lousy business. As we often note, if you want to make a small fortune, invest a big one in clean energy. Going back five years to before the pandemic briefly hit energy stocks, the S&P Global Clean Energy index has significantly underperformed both the S&P500 and traditional energy.

Midstream Energy Infrastructure, as defined by the American Energy Independence Index, has delivered triple the return.

BP, continuing its embrace of energy realism, is looking to sell its onshore US wind business for $2BN. Last year they wrote down their offshore US wind business by $1.1BN. “Ultimately, offshore wind in the US is fundamentally broken,” said the company’s former renewables chief Anja-Isabel Dotzenrath last November. She left BP in April.

It’s hard to find pure-play investments that offer a leveraged bet on growing gas demand. Natural gas futures are priced substantially above spot prices. E&P companies are an obvious choice. Range Resources (RRC) produces natural gas, Natural Gas Liquids (NGLs) and a modest amount of oil from the Marcellus and Utica shales in Appalachia. Although they hedge their output over the next year or two, a sustained increase in gas prices would clearly benefit them.

Unfortunately, RRC trades at 2X book value. Its hydrocarbon reserves are valued on its balance sheet using current prices, but the stock is priced at a significant premium. Other peer companies aren’t much better.

LNG export companies offer a good way to bet on higher export volumes. Cheniere dominates the sector, handling half the volumes we send overseas. The Administration’s pause on new export permits, which JPMorgan CEO Jamie Dimon called “naive”, will be lifted under a new Trump administration. Just as betting markets are signaling a Trump victory, there are signs that traders are buying stocks that will benefit from more coherent regulation.

NextDecade dropped sharply in the summer when an environmental group persuaded a judge to issue a stay on a permit issued by FERC (see Sierra Club Shoots Itself In The Foot). Although presidents have limited ability to impact volumes of oil and gas output, investors will welcome the more thoughtful implementation of energy regulation that will return to the White House with Trump. NextDecade is one stock that has rallied recently on such hopes.

We have two have funds that seek to profit from this environment:
Energy Mutual Fund

Energy ETF


Spinning Off Value

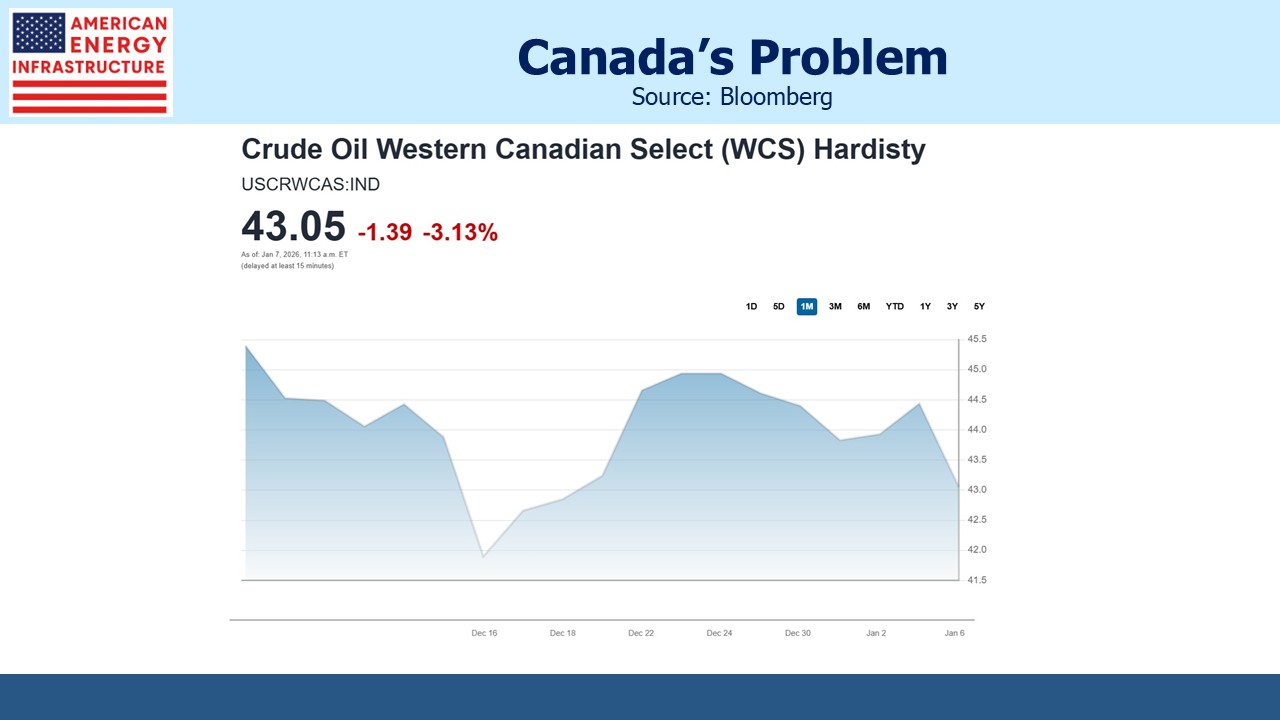
A couple of weeks ago South Bow Corporation (SOBO) began trading on Nasdaq. It’s a spin-off from TC Energy (TRP) which decided to split its liquids business off from its core natural gas pipeline activities. SOBO operates the Keystone pipeline that moves crude oil from Hardisty in Alberta south via Cushing, OK to Houston and Port Arthur, TX. They spent years trying to add the Keystone XL before incoming President Biden withdrew the permit, upon which TRP gave up. TRP’s $15BN lawsuit was dismissed in July by a tribunal.

TRP runs natural gas pipelines and storage facilities in Canada, the US and Mexico, along with solar and wind power assets.

The logic of the spinout was that although liquids represented around a tenth of TRP’s value, this was holding down the company’s stock price. Long term oil forecasts routinely contemplate peak oil demand on rising EV penetration. Natural gas forecasts tend to envisage continued growth as economies electrify. Data center demand has added to the positive gas outlook.

.avia-image-container.av-iob62s-30dc2b2b1dc10494fbccbb6bb6f35921 img.avia_image{ box-shadow:none; } .avia-image-container.av-iob62s-30dc2b2b1dc10494fbccbb6bb6f35921 .av-image-caption-overlay-center{ color:#ffffff; }

It helped that SOBO was launched with a dividend of its own while TRP’s remained unchanged. This meant the combined entities are paying out an additional $400MM annually to TRP investors who retained their new SOBO shares. Some sold, in spite of the new stock’s initial 9.2% dividend yield, which fell to 8% as it rallied.

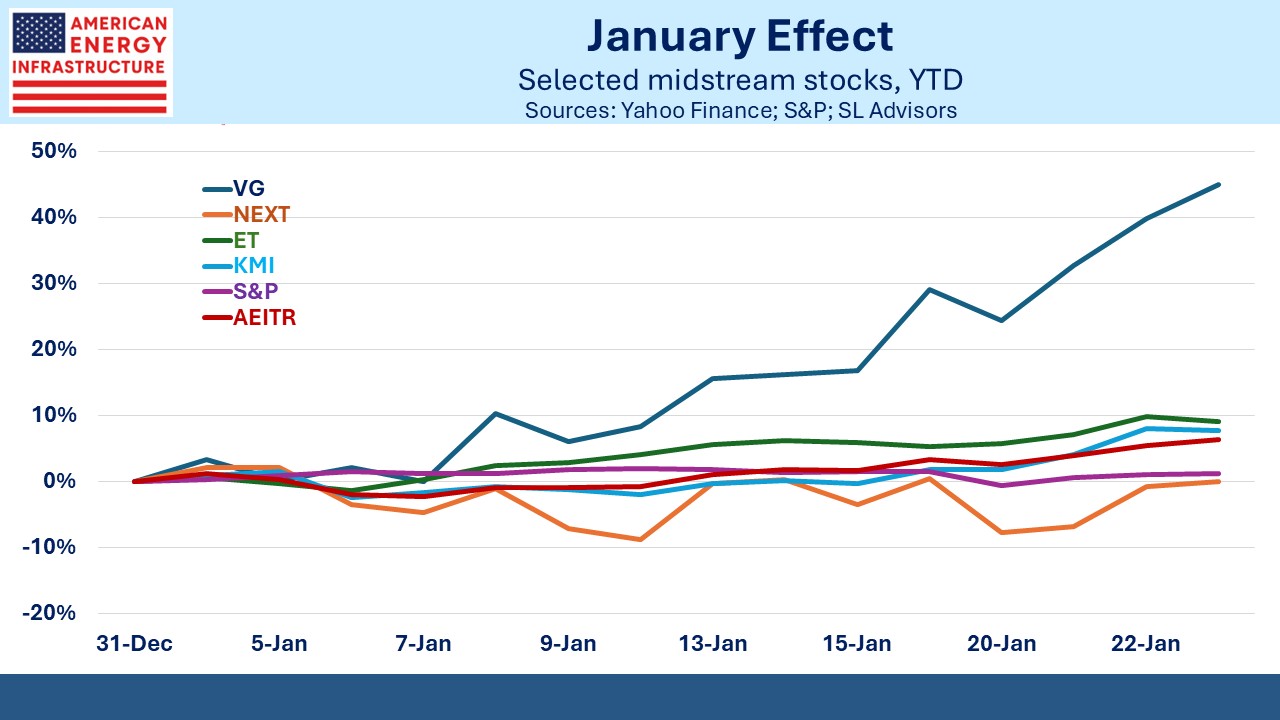
Since the SOBO business was spun out, the combined entity has rallied by over 8%, 4% more than the sector as defined by the American Energy Independence Index. The increase in TRP+SOBO market cap in excess of the AEIT’s rally is $2BN, the amount of value unlocked by the spin-out.

The 9.2% dividend yield at which SOBO began trading reflected the antipathy some TRP investors felt towards the liquids business. They owned TRP for the gas pipelines and were happy to dump their exposure to oil with its headwinds from transportation policy and EVs.

Other investors who had previously avoided TRP because of its liquids business found the now pure-play natural gas opportunity appealing.

It shows that the oil business was dragging down TRP’s overall value. Separating the liquids business allowed investors to self-segregate more precisely, reflecting their biases. Whatever synergies existed between oil and gas pipelines clearly weren’t that valuable.

For years Kinder Morgan (KMI) has operated an Enhanced Oil Recovery (EOR) unit with unclear benefits to the rest of its mainly natural gas pipeline business. EOR works by pumping CO2 into mature wells to raise the pressure and release more oil. We’ve long called for them to spin it out (see Kinder Morgan’s Slick Numeracy from 2020) because the unit adds oil price exposure into what is otherwise mostly a volume business.

The Inflation Reduction Act boosted the appeal of CO2 pipelines that could support Carbon Capture and Sequestration (CCS). Tax credits run as high as $185 per metric tonne for CCS that draws CO2 out of the air around us.

KMI operates one of the longest CO2 pipeline networks in the US. CCS in support of EOR also draws tax credits but the segment has shrunk to 8% of KMI’s business from 17% a decade ago. Its continued presence in KMI’s portfolio of business makes little sense. They are principally a natural gas and refined products pipeline company. The EOR business comes with commodity price volatility since lower crude decreases demand for EOR services.

When different business lines receive varying market valuations and offer limited synergies under the same corporate ownership, it can make sense to separate them to attract pure-play investors.

KMI’s earnings last week were slightly below expectations, with most segments including EOR lagging forecasts. Natural gas pipelines was the exception, beating expectations. Added capacity to the Gulf Coast Express gas pipeline should come online in 2026, alleviating the oversupply of natural gas in west Texas relative to its transportation options. The company sees up to 25 Billion Cubic Feet per Day of growth opportunities over the next five years to support growing domestic manufacturing and Mexican gas exports.

Perhaps after seeing the success of TRP’s spin-off they’ll consider something similar. Over the years KMI has delivered among the lowest returns on invested capital according to research by Wells Fargo. An EOR spin-out might unlock some value for shareholders.

A couple of years ago we showed that the ARK Innovation ETF (ARKK) run by Cathie Wood had destroyed investor capital due to unfortunate timing by many of its investors (see ARKK’s Investors Have In Aggregate Lost Money). A recent article added Chinese ETFs to this ignominious crowd.

They would have done better with pipelines.

.avia-image-container.av-19lp58k-81151c3d177520e4032aa5738cd1909a img.avia_image{ box-shadow:none; } .avia-image-container.av-19lp58k-81151c3d177520e4032aa5738cd1909a .av-image-caption-overlay-center{ color:#ffffff; }

My travels continued in New Orleans where I had good discussions about prospects in the energy sector with current and future investors.

Finally, The Economist ran a terrific section on the US economy titled The Envy of the World. If you have any doubts about why this country provides a high standard of living for more people than anywhere else, read this unashamedly upbeat analysis of what makes this great country great, from a UK-based publication with a global view. The average person in our poorest state, Mississippi, makes more than the average person in the UK, Germany or Canada.

The Economist’s positivity is intoxicating.

We have two have funds that seek to profit from this environment:
Energy Mutual Fund

Energy ETF


Energy Lifts Poor Countries Up

The International Energy Agency (IEA) released their 2024 World Energy Outlook last week. The IEA has become a renewables cheerleader in recent years, issuing projections of energy consumption that are frequently implausible. However, they still produce a Stated Policies Scenario (“STEPS”) which omits their more fanciful projections.

Electricity demand from data centers has been a regular topic of discussion with investors as US grids have increased ten-year demand projections from 1% to around 5% pa over the past year or so. The IEA concedes that it’s hard to precisely forecast the growth in global data center demand, but generally expects demand from air conditioning to be substantially higher.

Like almost all growth in energy consumption, this is driven by developing economies. An extended heat wave in India this summer resulted in a doubling of sales of air conditioning units. One homeowner said, “I’ve endured the worst summers under just a fan. But this year, my children suffered so much that I had to buy our family’s first air conditioner.”  His monthly electricity bill increased 7X.

40% of the world population (around 3 billion people) live in the tropics, where ChatGPT estimates only 8-10% have access to air conditioning. The IEA believes a/c penetration in emerging economies will rise from 0.6 per household to almost 1.0 by 2035, close to the US.

The natural response of people that are sweating profusely is not to blame CO2 emissions but to get cool. You can’t fight climate change if you’re too hot, don’t have access to electricity or cook dinner on a fire of animal dung.

This is why energy demand will keep going up.

The IEA provides figures on energy poverty. 750 million people (world population is around 8.2 billion) don’t have access to electricity. More than 2 billion don’t have access to clean cooking, meaning they use open fires of either wood or animal dung. To quote the IEA, “This results in over 4.5 million premature deaths worldwide each year due to ambient (outdoor) air pollution, and nearly 3 million deaths from household air pollution.”

The moral response of OECD countries, especially the US, should be to help provide these people with access to electricity and clean cooking, by exporting natural gas. Democrat policies that impede such US exports betray a philosophy that is deeply anti-humanity. We believe such pragmatic solutions will continue to gain traction, just as nuclear power is enjoying a US renaissance.

Energy exports are in the great US tradition of helping less fortunate countries prosper. They are ethically correct and in the interests of our national security.

.avia-image-container.av-2xzngf-c93a4ee366239e3427c92e384f76cb5c img.avia_image{ box-shadow:none; } .avia-image-container.av-2xzngf-c93a4ee366239e3427c92e384f76cb5c .av-image-caption-overlay-center{ color:#ffffff; }

Current policies assume China will begin reducing emissions in 2030, reaching zero by 2060, a decade later than the UN IPCC goal. China burns over half the world’s coal and a “show me” attitude is appropriate towards the country that generates 31% of global emissions. It’s not at all obvious that their emissions will peak as planned. New York City’s policy that forbids natural gas hookups to new buildings is a virtue-signaling, self-inflicted irrelevance.

I spent last week visiting clients in South Carolina, Georgia and New Orleans. I always enjoy such encounters, but they’re especially convivial when an advisor can report that 100% of his clients invested with us are profitable. This happened more than once, and I credit the advisor’s propitious timing. Nonetheless it is a great pleasure to be tangentially associated with such success.

Our investors tend to favor Republicans, and as a registered Republican myself I enjoy their company. But I often note that midstream energy infrastructure should appeal to moderate Democrats too since natural gas is the main driver of reduced US CO2 emissions. If climate extremists would get out of the way the benefit could extend to other countries.

Discussion topics usually included the election. It’s often believed that the “permit pause” on new Liquefied Natural Gas (LNG) export terminals announced by the Department of Energy in January to try and excite progressive climate extremists means current LNG exports are capped.

This is not the case.

LNG export terminals take years to build, and the pause did not impact already issued permits. Therefore, LNG exports will double from 12 to around 24 Billion Cubic Feet per Day (BCF/D) over the next few years as new capacity is completed. The US will be doing its part to provide electricity and clean cooking to developing countries in Asia as well as natural gas to friends and allies such as Ukraine.

From the moral high ground, the Sierra Club is an insignificant speck in the ditch.

We have two have funds that seek to profit from this environment:
Energy Mutual Fund

Energy ETF