The Virus Infecting MLPs

Closed end fund investors are passionate about the product. Because they generally own a portfolio of publicly traded securities, their NAV per share is easily calculated. The fixed share count means their share price can deviate from the NAV, and this attracts investors keen to buy something for less than it’s worth.

MLP closed end funds have been around for years. They’re a low-octane version of levered ETFs. If you’re good at market-timing, a skill claimed by far more than actually possess it, you can navigate the ups and downs. Leverage magnifies your exposure, and strategies with fixed leverage have to rebalance in the direction the market has moved (i.e. buy high and sell low).

We have warned investors about this before (see Lose Money Fast with Levered ETFs).

In 2015 we pointed out how the Cushing MLP Total Return Fund (SRV) had persistently destroyed value, because of leverage (see An Apocalyptic Fund Story).

.avia-image-container.av-134nwnd-27005fac84fce756ac522a86342711e4 img.avia_image{ box-shadow:none; } .avia-image-container.av-134nwnd-27005fac84fce756ac522a86342711e4 .av-image-caption-overlay-center{ color:#ffffff; }

MLP closed end funds use leverage. Because they are more than 25% invested in MLPs, they are non-RIC compliant and therefore their profits are subject to corporate income tax. The interest expense on their borrowings can be deducted against taxable income, thereby reducing or even offsetting the tax obligation that few holders realize exists.

But adding leverage to a single sector fund is a dumb idea. Investment grade midstream energy infrastructure companies generally operate at around 4.0X Debt:EBITDA. Non-investment grade are a little higher. The manager of a sector-specific leveraged fund is essentially rejecting this leverage as too conservative, even though such a fund has little diversification in a sharp fall in the market.

This is an expression of arrogance, that the managers of these funds have some insight superior to the collective opinion of CFOs and rating agencies. They don’t. They are just willing to gamble other people’s money that they do.

.avia-image-container.av-pr4ikp-287628c67413fa61f3faa0568a8089d7 img.avia_image{ box-shadow:none; } .avia-image-container.av-pr4ikp-287628c67413fa61f3faa0568a8089d7 .av-image-caption-overlay-center{ color:#ffffff; }

An investor pointed out to me leverage at some of these funds, from fact sheets recently published at the end of February. Goldman was running a fund with 35% leverage. Tortoise had one with 40%. YTD these funds were down 85% and 95% respectively as of 2pm today.

Given the collapse in March, these funds have all been forced sellers. As long-only investors we are down a lot. But the delevering of MLP CEFs has exacerbated the drop for everyone. Leveraged MLP closed end funds are a financial virus that is infecting the rest of the sector, by driving prices even lower. They harm all investors, but most especially the poor souls who sadly bought them. Fortunately, most of these funds are nearly dead, with little capital remaining to protect.


Enbridge Fireside Chat

Earlier today Enbridge (ENB) CEO Al Monaco held a “virtual fireside chat” with an analyst from RBC. ENB, like the other Canadians, is run more conservatively than many U.S. businesses. We’ve often noted that a bit more Canadian management would be beneficial in the U.S. energy sector.

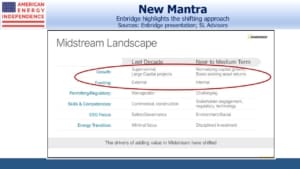
The slides below are from the ENB presentation deck that was published at the same time.

.avia-image-container.av-mgeojg-be535ce8d68e7fc4b2a9ff362c92ec93 img.avia_image{ box-shadow:none; } .avia-image-container.av-mgeojg-be535ce8d68e7fc4b2a9ff362c92ec93 .av-image-caption-overlay-center{ color:#ffffff; }

We estimate that within the American Energy Independence Index (AEITR), 80% of the customers are investment grade. ENB does better than this with 95% as this slide shows.

.avia-image-container.av-ptqtmk-668609374e131f0629148c41b9017527 img.avia_image{ box-shadow:none; } .avia-image-container.av-ptqtmk-668609374e131f0629148c41b9017527 .av-image-caption-overlay-center{ color:#ffffff; }

This chart lists the profile of their natural gas customers. Monaco noted that these customers are often “must-run” facilities such as power plants in the north east U.S. and Canada. He also said that many of their liquids customers run the most competitive, complex refineries.

.avia-image-container.av-19jq8ik-c9e5e6e120b30744ccc4f266af615893 img.avia_image{ box-shadow:none; } .avia-image-container.av-19jq8ik-c9e5e6e120b30744ccc4f266af615893 .av-image-caption-overlay-center{ color:#ffffff; }

This slide shows how their EBITDA showed no visible hit from the 2014-16 collapse in crude prices, even though Canadian tar-sands is among the most expensive crude oil to produce.

.avia-image-container.av-1qwiiqk-e269caf82a588b8881863c6d95d1fe3c img.avia_image{ box-shadow:none; } .avia-image-container.av-1qwiiqk-e269caf82a588b8881863c6d95d1fe3c .av-image-caption-overlay-center{ color:#ffffff; }

This chart lists their top ten liquids customers along with their credit ratings.

.avia-image-container.av-2qlkiu4-6c7f7f003497275a6af47a7c184fd85e img.avia_image{ box-shadow:none; } .avia-image-container.av-2qlkiu4-6c7f7f003497275a6af47a7c184fd85e .av-image-caption-overlay-center{ color:#ffffff; }

ENB has been reducing their leverage in recent years. This is because their backlog of growth projects has been coming down. In 2015-16 they had a $25BN backlog, whereas today they have half that with $6BN remaining to fund for new investments over the next three years.

.avia-image-container.av-m2api4-75d1a97ec807b112687e63a858dcd596 img.avia_image{ box-shadow:none; } .avia-image-container.av-m2api4-75d1a97ec807b112687e63a858dcd596 .av-image-caption-overlay-center{ color:#ffffff; }

Monaco sounded very calm about his company’s position. We think they’re the kind of company that can get through just about any plausible economic disruption.

We are invested in ENB.


With Energy Uncertainty, Natural Gas Offers Stability

The spreading coronavirus and effective end of OPEC+ were a one-two punch that caused the worst  collapse in midstream energy infrastructure stocks any of us have ever seen.

The IEA forecasts a 2.5 Million Barrels per Day (MMB/D) drop in demand for 1Q20, but clearly oil markets are pricing a bigger drop.

Medical experts typically describe Covid-19 as a form of flu that we’ll eventually learn to live with, albeit more infectious and fatal than flu. The economic disruption caused by every-day life shutting down so as to avoid infection is far harder to forecast.

.avia-image-container.av-2ucq6y-ebccc323de7ded1f2e92954457bffe6d img.avia_image{ box-shadow:none; } .avia-image-container.av-2ucq6y-ebccc323de7ded1f2e92954457bffe6d .av-image-caption-overlay-center{ color:#ffffff; }

For pipeline investors, it’s helpful to look back at U.S. energy demand during the 2008 financial crisis.

Crude oil demand did roughly follow the path of the S&P500, with demand dropping as much as 2 MMB/D, or about 10%.

.avia-image-container.av-1vekze-c8b815faca674368047c58bd5b1da02c img.avia_image{ box-shadow:none; } .avia-image-container.av-1vekze-c8b815faca674368047c58bd5b1da02c .av-image-caption-overlay-center{ color:#ffffff; }

But natural gas demand followed its regular seasonal pattern with no discernible response to the economic contraction.

The pie chart shows where we consume natural gas. The question is, how much of each different segment is vulnerable to lower demand? If the U.S. quarantines entire regions, or bans mass gatherings such as sporting events, even natural gas demand may dip somewhat. But it’s most likely fairly robust. Whether people are at home or in the mall, they’re still going to want air conditioning. They’ll still need to cook meals. Industrial use isn’t going to disappear.

.avia-image-container.av-t0rrne-4f2de180f9dfea00c7da1210655acba4 img.avia_image{ box-shadow:none; } .avia-image-container.av-t0rrne-4f2de180f9dfea00c7da1210655acba4 .av-image-caption-overlay-center{ color:#ffffff; }

So in trying to assess the wreckage after yesterday, stable natural gas consumption seems like one of the more reliable assumptions.


Updating the Coming Pipeline Cash Gusher

Almost a year ago, we published The Coming Pipeline Cash Gusher. Midstream energy infrastructure companies, especially MLPs, have long relied on Distributable Cash Flow (DCF) as a measure of profits available for distributions. As the funding needs of growth projects increased, the difference between DCF and Free Cash Flow (FCF) became stark. FCF is a GAAP term and more widely recognized by the broad investment community. MLPs have destroyed the trust of their original investors, because the gulf between DCF and FCF led to distribution cuts. Drawing a new set of investors requires describing results in a recognizable form, and FCF is part of that effort.

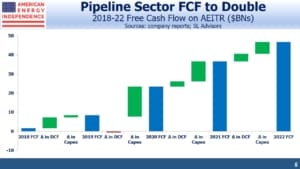
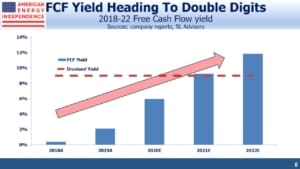
Last April, we showed that the need for growth capex had peaked, and that existing assets were generating increasing amounts of cash. Both of these developments are positive for FCF. In combination, they produced a startling trajectory. We calculated that over 2018-21, FCF would leap from $1BN to $45BN – very meaningful for a sector with a market cap of around $450BN.

We did this analysis on the American Energy Independence Index (AEITR), because it’s the broadest representation of North American midstream energy infrastructure companies. It’s the only index that omits companies that pay Incentive Distribution Rights (IDRs) to a controlling general partner. Paying IDRs increases a company’s cost of capital and is the most visible evidence of a misalignment of interests between management and investors. We never invest in a company that pays IDRs, and where available we hold companies that receive IDRs from someone else.

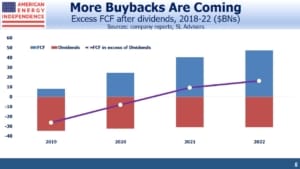
Now that 2019 earnings have been reported, capex guidance for 2020 is available and we’ve updated our forecast. FCF is still set to soar – albeit not quite as fast by 2021 as we found a year ago. But a closer look at the figures reveals a story just as positive. Growing FCF remains the most compelling bull case for this sector.

We should note that the forward guidance that we’ve used was all provided by companies before the market’s sudden drop in response to Covid-19. There’s a strong case to expect domestic pipelines to fare better than most businesses in an economic slowdown, but we’ll explore that topic in more detail in another blog post.

.avia-image-container.av-la96tw-07aa8b949f57d5ba9d161dec75365980 img.avia_image{ box-shadow:none; } .avia-image-container.av-la96tw-07aa8b949f57d5ba9d161dec75365980 .av-image-caption-overlay-center{ color:#ffffff; }

We now forecast 2021 FCF to be around $41BN, $4BN less than we thought last year. $0.5 of this is because of changes to index membership. Some names have joined the index – either because they dropped IDRs which had previously disqualified them, or because they’re a recent IPO. Others left the index because they were acquired, either by another public company or by a private equity buyer. For today’s index members who were in a year ago, our 2021 FCF forecast has come down by $3.5BN.

For the 28 members of the AEITR who remained in the index since last year, 2019 FCF came in $4.5BN ahead of our April 2019 forecast. TC Energy (TRP) was the biggest surprise here, with $1.1BN of FCF versus our prior forecast of $0.1BN. As we’ve noted before, along with Enbridge (ENB), which also came in $0.6BN ahead of our expectation, the two big Canadian firms generated $4.9BN of the $9.2BN in AEITR 2019 FCF. As more American companies emulate the financial discipline of our neighbors up north, FCF will grow.

Other positive surprises came from Energy Transfer (ET) at $2.1BN versus $0.9BN, Cheniere Energy (LNG) at $1.0BN vs $0 and MLPX at $1.3BN vs $0.5BN. The biggest miss came from Enterprise Products Partners (EPD). Over the 2019-21 period, we estimate their FCF will now be $3.6BN less than we thought a year ago. Their growth capex guidance is now $1BN per annum more than it was previously. Following their 3Q19 earnings report, EPD added $3.6BN to their backlog.  The bulk of this spending is going towards expanding the Midland to Echo crude oil pipeline system. They’re also  investing $1.5BN in a second propane dehydrogenation facility, which will convert propane into propylene for later use in combustion and plastics. The Shale Revolution isn’t just about oil and natural gas – natural gas liquids, such as propane, have also created new business opportunities. EPD’s history of capital discipline and reliable distributions gives them more latitude than many to pursue growth projects.

.avia-image-container.av-n4p5xw-80b02c8f08780faba61357b60847c493 img.avia_image{ box-shadow:none; } .avia-image-container.av-n4p5xw-80b02c8f08780faba61357b60847c493 .av-image-caption-overlay-center{ color:#ffffff; }

EPD stands out in significantly increasing their growth capex – most companies have made only modest changes, although ET raised their capex guidance too, partly because of their acquisition of Semgroup.

For 2021, Kinder Morgan (KMI) and ENB each raised growth capex by $1BN. So the $4BN drop in 2021 forecast FCF for the sector is largely because these two companies, along with EPD, have raised their spending plans.

.avia-image-container.av-u8gzf8-2fb0ddb4efc264d0abee3f4ffe82100c img.avia_image{ box-shadow:none; } .avia-image-container.av-u8gzf8-2fb0ddb4efc264d0abee3f4ffe82100c .av-image-caption-overlay-center{ color:#ffffff; }

Nonetheless, some of the increases in FCF 2019-21 are big. Ten names will collectively increase FCF by $12BN over this period. ENB and KMI could both add almost $3BN apiece 2020-21.

Energy remains out of favor, with pundits like Jim Cramer dubbing it the “new tobacco” and some calling it “uninvestable”. Climate extremists direct their anger at 80% of the world’s energy supply with no practical solutions. Although it may sound as if investors are shunning stocks because of fear that public policy will harm their prospects, TRP and ENB both outperformed the S&P500 last year. That these two were most of the sector’s FCF suggests that explanations for poor stock performance are more driven by capital allocation. As FCF growth becomes more widespread, investors will find more to like.


Fighting Climate Change with Trees


Planting a Cooler Climate

A little noticed sentence in President Trump’s State of the Union speech was that the U.S. would join the Trillion Trees Initiative. He didn’t mention climate change – most people like trees anyway, and the link was obvious. But planting trees to combat climate change is so seductively simple that it must be impractical. A trillion trees is a lot, and mentioning it in a prime time speech will have caused at least half the country to dismiss a political gimmick.

So we looked at the plausibility of harnessing nature to consume the excess CO2 humans are generating.

To grow, trees require CO2 and water, which through photosynthesis they convert into carbon and  glucose to form the tree, and oxygen which they emit. Growing 1 ton of wood requires around 1.55 tons of CO2. By atomic weight, carbon is 27% of a CO2 molecule. A dry tree is typically around 50% carbon.

Of course trees vary enormously in size. The University of Arkansas Division of Agriculture publishes a handy guide for estimating the weight of a tree given the measured circumference.

From this, we estimate that the average hardwood tree weighs 3.4 tons dry, or about 3.1 metric tonnes (the unit that’s used for CO2 emissions). Assuming it grows over 100 years, it’ll require half its weight in carbon (1.55 tonnes), which will be extracted from 5.7 tonnes of CO2 (i.e. 1.55 divided by 0.27).

.avia-image-container.av-qezzqc-29d70828f86543396f3bb9c8bf6a2cc3 img.avia_image{ box-shadow:none; } .avia-image-container.av-qezzqc-29d70828f86543396f3bb9c8bf6a2cc3 .av-image-caption-overlay-center{ color:#ffffff; }

The world generated 33 gigatonnes of CO2 last year. Divided by the 5.7 tonnes consumed by the average tree, planting 5.8 billion trees would, over their life, consume all the CO2 emissions of last year.

Is this possible? Earth currently has 3.04 trillion trees, so we’d need to increase the stock of trees by just 0.19% per annum to take a giant step towards combating global warming.

Last year, one million Indians planted 220 million trees in a single day, as part of a government campaign against global warming. Ethiopia planted 353 million trees in 12 hours.

America plants 1.6 billion trees a year – half by forest product companies. Costs are estimated to be as low as 30 cents a tree.

Even if this analysis is out by a factor of 10X, that would still leave the world needing to add 1.9% to global forests every year – certainly viable if embraced as a solution.

Planting trees is labor-intensive. But two companies, Droneseed and Dendra Systems, are developing plans to use drones that can plant seeds on hundreds of acres a day, versus the two acres that a professional tree planter typically covers. You can watch two interesting videos explaining how here, and here.

So it would seem that a global effort to add around 6 billion new trees every year is achievable.

Articles like World losing area of forest the size of the UK each year, report finds in the UK’s Guardian stoke fears of enormous global tree loss. Brazil is widely criticized for deforestation in the Amazon, but overall the portion of the world covered with trees has been growing. This is partly because a warming planet is raising the tree-line in mountainous areas, and allowing forests to creep into tundra.

Environmental extremists have instinctively rejected the Trillion Trees Initiative, for mostly predictable reasons: it doesn’t require overhauling our energy supply, or erecting millions of windmills, solar panels and tens of thousands of miles of ugly high voltage electricity lines. It seems so much more attractive than the Green New Deal.

Renewables, nuclear and natural gas are all part of the solution to climate change, along with adding billions of trees. Burning natural gas produces water and carbon dioxide, the two inputs trees need to grow. Burning coal releases nitrogen oxides, sulfur dioxide, particulate matter, mercury and other hazardous substances that the local population inhales. Everyone should be able to agree that coal use must drop.

Most of the criticism of the Trillion Trees Initiative stems from concern that it’ll weaken the case for dramatic interventions to the economy promoted in the Green New Deal. That’s precisely why it’s appealing.


U.S. Natural Gas Helps Lower Emissions Again

Blackrock’s ESG funds hold positions in pipeline corporations, consistent with Larry Fink’s recent letter on climate change (watch ESG Investors Like Pipelines).

Their inclusion is entirely appropriate. The International Energy Agency recently announced that global CO2 emissions last year were flat, at 33 gigatonnes (a gigatonne is 1 billion metric tonnes). The U.S. lowered emissions more than any country – by 140 million tonnes, a 2.9% reduction.

Increased use of natural gas was an important contributor, because it’s substituting for far dirtier coal. In 2018, using the most recent figures available, natural gas produced 35% of America’s electricity, versus 27.5% for coal. Wind was 6.5% and solar 1.5%.

Other developed countries also saw reduced emissions. The EU saw a drop of 160 million tonnes, and Japan 45 million tonnes. The U.S. not only had the biggest absolute reduction, but on these figures also the biggest per capita drop: 0.42 tonnes per American, versus 0.31 tonnes per EU citizen and 0.35 tonnes per Japanese citizen.

The U.S. Shale Revolution has made this possible. Natural gas prices may be ruinously low for E&P companies, but this has enhanced its competitiveness all around the world.

.avia-image-container.av-lrth1x-cfb92a9a4fdb0256f6fd5c7b9b6eef4d img.avia_image{ box-shadow:none; } .avia-image-container.av-lrth1x-cfb92a9a4fdb0256f6fd5c7b9b6eef4d .av-image-caption-overlay-center{ color:#ffffff; }

The CO2 reductions from developed countries were offset by increases from developing countries. China and other non-OECD countries are more concerned with raising living standards than lowering emissions, which is chiefly a rich world concern. The Paris Climate Accord accepted increasing emissions from developing countries for this reason.

One of the most damning statistics is that China’s annual per person CO2 emissions of 9 tonnes per annum are higher than the EU at 8 tonnes. India is at 2 tonnes.

The U.S. is at 16 tonnes, but this has been falling sharply over the past couple of decades.

China’s relatively high per person emissions are partly a result of their mix of inputs – they burn half the world’s coal. While developed countries are managing to lower emissions, China is undoing most of the benefit. Given their track record, rising Chinese living standards will represent a significant setback to global efforts on emissions – an issue rarely acknowledged by climate extremists.

Meanwhile, U.S. pipeline corporations are helping reduce America’s emissions, drawing ESG-dedicated capital from Blackrock and others. It’s one of the biggest successes in climate change


Today’s Pipelines Leave MLPs Behind

Last week Kelcy Warren, CEO of Energy Transfer (ET), defended the MLP structure. He’s definitely correct that MLPs possess a powerful tax advantage over corporations, in that their profits are only taxed at the investor level. Tax-deferred income free of the double-taxation to which corporate profits are subject is very appealing, and for years it drew countless buyers. Unfortunately, Warren is part of the reason that the MLP structure is losing favor. Midstream energy infrastructure and MLPs used to be synonymous, but widespread distribution cuts and investor abuse have left the old, rich Americans who used to be the investor base betrayed.  The names Kelcy Warren and Rich Kinder still elicit strong reactions from longtime MLP investors.

The Alerian MLP ETF, a good proxy for how MLPs have performed, has cut its distribution by 34% since the market peak in 2014. Companies chose to finance growth projects in excess of free cash flow, and ultimately resorted to either outright distribution cuts or “backdoor” distribution cuts by merging with a their lower yielding corporate general partner. Many MLPs abandoned the structure, and income seeking investors in turn have abandoned the remaining ones.

.avia-image-container.av-jpxkv4-f929f5c649b9349f67983f4f06d6bbc7 img.avia_image{ box-shadow:none; } .avia-image-container.av-jpxkv4-f929f5c649b9349f67983f4f06d6bbc7 .av-image-caption-overlay-center{ color:#ffffff; }

The result today is that MLPs represent 36.5% of the sector by market capitalization, as defined by the Alerian Midstream Energy Index — AMNA (see MLPs No Longer Represent Pipelines). Kinder Morgan, ONEOK, Enbridge, Targa Resoures and Williams Companies are among those that have fully adopted the corporate structure.

MLP-dedicated mutual funds and ETFs were originally designed to offer sector exposure to retail investors who didn’t want to deal with K-1s. They saddled their investors with a ruinous tax burden, because funds with over 25% of their portfolios in partnerships (which is what MLPs are) have to pay corporate tax. It seems odd to take a tax-efficient vehicle and add taxes to it, but showing how few investors read the fine print, these products took hold. And they’re now focused on just 36.5% of the sector (see Are MLPs Going Away?).

To illustrate how much things have changed, just two names, Energy Transfer and Enterprise Products, represent 43% of the market cap of all MLPs.  Dedicated MLP funds are forced to drastically underweight these two, which leaves them with outsized exposure to the smaller MLPs. They’ve moved a long way from diversified portfolios of large, fully integrated “toll road” pipeline systems that originally attracted investors.

The biggest of them, the Alerian MLP ETF, has since inception delivered less than one third of its index. This is probably the worst performing index ETF in history. Corporate taxes have taken a bite, and when the sector delivers a couple of big years the tax hit will be even more noticeable (see MLP Funds Made for Uncle Sam). The 1.04% since inception annual return is not far from the 0.85% advisory fee, putting AMLP in the company of the hedge fund industry in making profits while the clients don’t.

If you ever meet one of the hapless souls who’s chosen AMLP, you’ll find they’re probably unaware of the tax drag.

The shrinking number of MLPs has rendered MLP-dedicated funds less representative of the sector. Of the ten biggest North American pipeline companies, six are corporations and so excluded from AMLP and its cousins. Every time another pipeline company leaves the publicly-traded MLP universe, these funds are left with fewer names and a preponderance of small ones. The market has shifted since many of these were launched a decade or more ago (see AMLP’s Shrinking Investor Base).

.avia-image-container.av-36z41s-e93f76454674c640cd365e46a4cc119e img.avia_image{ box-shadow:none; } .avia-image-container.av-36z41s-e93f76454674c640cd365e46a4cc119e .av-image-caption-overlay-center{ color:#ffffff; }

If any of these funds decides to reduce their MLP exposure below the 25% threshold, so as to be more representative and avoid corporate taxes, it’ll depress MLP prices because many will have to sell three quarters of their holdings. A quarter of the $135BN in public float for all MLPs is held by $34BN in MLP dedicated-funds. It’s a crowded space.

Moreover, AMLP reflects the worst of MLPs – AMNA is 21% Gathering and Processing (G&P), the more risky end of the midstream business because it’s more dependent on production from specific areas. Due to limited choices, AMLP has 26% exposure to G&P. Even worse, natural gas pipelines are a big underweight in AMLP, even though the long term prospects for natural gas are more visibly positive than for crude oil and liquids. Natural gas pipelines represent 46% of AMNA, but only 27% of AMLP. So AMLP investors have an overweight towards crude oil and liquids.

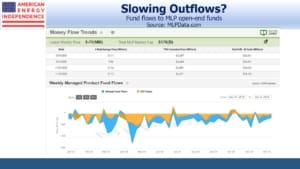
Investors are starting to act on the many flaws of MLP-dedicated funds. Over the past year, $4.1BN has left the sector. The American Energy Independence Index is investible (you cannot invest directly in an index) and has weights that are more reflective of the industry. Its holdings are mostly corporations, which reflects today’s pipeline business. Several names are ESG holdings for Blackrock and other big fund managers, but MLPs don’t pass ESG screens because of poor governance (watch ESG Investors Like Pipelines). The broader investor base and ESG qualities helped pipeline corporations outperform MLPs last year.

Disclosure: our affiliated investment products are structured to reflect the insights listed above.


Crude Catches a Virus

We’re in one of those times when everything is a macro call. Stocks and sectors are, for now, more highly correlated, since Coronavirus developments are dominant. Click here for some cool graphics illustrating its spread. The recent recovery in stocks echoes the information on the link.

We won’t attempt to offer any insight on the virus, but have some observations on energy markets.

Recent reports suggest that China’s crude demand is down by around 20%, or 3 million barrels per day (MMB/D). OPEC is apparently considering temporary cuts of 0.5 MMB/D and could perhaps reduce by 1 MMB/D. That still leaves the market over-supplied by 2.0-2.5 MMB/D, although China’s imports should hold up relatively better as it builds strategic reserves.

Libya’s production has fallen by around 1 MMB/D, from 1.2MMB/D to just 0.2 MMB/D recently, because of the ongoing civil war there. However, they are holding peace talks and a cease-fire agreement may be reached soon.

.avia-image-container.av-thx1oq-2fcf72748ed9de303f49a0a19194b2da img.avia_image{ box-shadow:none; } .avia-image-container.av-thx1oq-2fcf72748ed9de303f49a0a19194b2da .av-image-caption-overlay-center{ color:#ffffff; }

Before the Coronavirus hurt demand, we had thought U.S. shale output was likely to come in below expectations (see Why Oil Production May Disappoint).  Oil wells experience faster depletion than natural gas, which means that as shale production grows an ever increasing number of new wells is needed to compensate for the production drop-off experienced by older wells. We also noted the sharp drop in “DUCs” (Drilled but not yet Completed), which become the source of future production when they’re completed.

Schlumberger, the world’s largest oil field services company, recently announced plans to pull back from shale oil because they see so many E&P companies struggling to be profitable. In announcing results last month, CEO Olivier Le Peuch said, “North America revenue of $2.5 billion…dropped 14% sequentially due to customer budget exhaustion and cash flow constraints.”

Capital is clearly becoming constrained. Natural gas-dedicated E&P names such as Chesapeake and Range Resources have seen their stock fall 95% or more from peak levels more than five years ago. Even the biggest companies such as Exxon Mobil trade at historically low valuations.

The rig count has been sliding for some time amid weak crude oil prices and steadily sinking natural gas. The Coronavirus-driven sudden drop in crude prices is likely to cause a further pullback in the rig count drilling for shale oil, restraining production growth.

The caveat is increasing efficiency of production. The U.S. Energy Information Administration recently noted that oil and gas production grew in 2018 even while the number of wells in operation fell 10%. Doing more with less has been a hallmark of the Shale Revolution since its infancy. However, this reaches a limit as the least efficient rigs drilling the highest cost acreage are the first to be laid down, leaving the high-tech rigs in the sweet spots.

Depending on the length of economic disruption caused by the Coronavirus, supply may need to adjust. Low prices are the best cure for oversupply. Saudi Arabia has signaled they’re willing to cut production with OPEC to get the price of oil higher, and can maintain its lower production quotas after demand has recovered. U.S. activity demonstrates that shale oil growth was already moderating before recent developments. Meanwhile, many forecasts see the physical oil markets shifting to a multi-year deficit in the back half of 2020 and tension in the middle east remains elevated as the US continues its maximum pressure policy of sanctions on Iran.  With the many cross-currents, energy investors remain on the edge of their seats.


Kinder Morgan’s Slick Numeracy

A Chief Financial Officer needs to know her way around a financial statement. Presenting operating performance in the best possible light is a highly valuable skill. We watched Kinder Morgan’s (KMI) Analyst Day last week via webcast, and my admiration is split between (1) KMI President and former CFO Kim Dang’s deft maneuvering among numbers, and (2) my detail-oriented partner Henry Hoffman for spotting the sleight of hand.

The story begins where KMI uses a “bridge” chart to show how EBITDA changed from 2014 to 2020. Dang introduced the slide as answering a common investor question: if you’re doing so well, why isn’t EBITDA growing more?

.avia-image-container.av-jpc57s-ab4c4d46eb8c1029e9d73663c033c5b3 img.avia_image{ box-shadow:none; } .avia-image-container.av-jpc57s-ab4c4d46eb8c1029e9d73663c033c5b3 .av-image-caption-overlay-center{ color:#ffffff; }

The chart includes the much criticized CO2 segment, which sells CO2 for Enhanced Oil Recovery (EOR) as well as being used by KMI itself for that purpose. CO2 contributed a $0.6BN decline to EBITDA from 2014-20. Since its decline is shown on the chart, it must also be part of the $1.8BN EBITDA increase from Expansion Projects, because the $7.6BN 2020 Adjusted EBITDA is for all of KMI.

.avia-image-container.av-u8rp1k-bf3c1fc5bb9936b8e53f56183f8aff09 img.avia_image{ box-shadow:none; } .avia-image-container.av-u8rp1k-bf3c1fc5bb9936b8e53f56183f8aff09 .av-image-caption-overlay-center{ color:#ffffff; }

Another slide shows an attractive EBITDA multiple on capital invested, of 5.9X. In other words, $100 invested will return its capital invested over 5.9 years. The reciprocal of 5.9X is the return, a juicy 16.95% in this case and well over KMI’s assumed cost of capital. The 5.9X multiple implies these projects are generating $2.08BN in EBITDA.

But the small print notes that on this slide, CO2 segment Expansion Projects are excluded.

.avia-image-container.av-pe59bc-6e9b22e1a5cce87a95da0ae37af45bb3 img.avia_image{ box-shadow:none; } .avia-image-container.av-pe59bc-6e9b22e1a5cce87a95da0ae37af45bb3 .av-image-caption-overlay-center{ color:#ffffff; }

To find out what KMI invested in CO2 projects 2015-19, we turn to another slide, which shows annual figures.  Adding up the Capex for 2015-19 gives $2.18BN.

So KMI’s total capex over the period covered was not $12.3BN but $14.48BN,  once you add back CO2.

.avia-image-container.av-vyv7fs-cacefe3f1442c327a713151932ef9b24 img.avia_image{ box-shadow:none; } .avia-image-container.av-vyv7fs-cacefe3f1442c327a713151932ef9b24 .av-image-caption-overlay-center{ color:#ffffff; }

This makes the EBITDA multiple on new investments a little less stellar. The $1.8BN in EBITDA from Expansion Projects that required $12.3BN in investment equates to a 6.78X multiple. But since we know the $1.8BN EBITDA is from all Expansion Projects, including the CO2 business, it’s appropriate to add back the $2.18BN invested in CO2 Expansion Projects to get the true total.

.avia-image-container.av-tb0f1k-365d3e83871d1b71865c982ab686f735 img.avia_image{ box-shadow:none; } .avia-image-container.av-tb0f1k-365d3e83871d1b71865c982ab686f735 .av-image-caption-overlay-center{ color:#ffffff; }

That means the $1.8BN in “growth” EBITDA was earned on $14.48BN in capex, or a multiple of 8.04X. That’s 12.44% rather than the 16.95% calculated earlier. It’s pre-tax, and excludes interest expense as well as depreciation.

KMI uses more than one EBITDA definition through these slides, so you have to follow carefully. When calculating the EBITDA multiple, they like the “Year 2 Project EBITDA”, with its implied $2.08BN in EBITDA. The EBITDA bridge chart simply shows 2020 EBITDA of $1.8BN from all new projects initiated since 2015. Why are they different, and what does it mean?

Investment outlays have been falling since 2015, which means that the projects funded since then are, on average, past the two year mark. 2020 capex is almost a third lower than it was in 2015.

.avia-image-container.av-i9lkqw-a4e9f6367ed3831cfb4c2b038433c5e5 img.avia_image{ box-shadow:none; } .avia-image-container.av-i9lkqw-a4e9f6367ed3831cfb4c2b038433c5e5 .av-image-caption-overlay-center{ color:#ffffff; }

Since the $2.08BN “Year 2 Project EBITDA” is above the $1.8BN 2020 EBITDA from Expansion Projects in  the bridge chart, and we know the average project is more than two years old, it means that EBITDA from new projects is declining. Using the “Year 2 Project EBITDA” flatters the results. Management teams persist in using EBITDA multiples, which are easily manipulated, rather than NPV and IRR. It’s as if they don’t think their investors will understand them – or maybe they’ve concluded that EBITDA multiples are easier to obfuscate.

.avia-image-container.av-sndibs-66821f9902f3fdaf40f93085cfeeda74 img.avia_image{ box-shadow:none; } .avia-image-container.av-sndibs-66821f9902f3fdaf40f93085cfeeda74 .av-image-caption-overlay-center{ color:#ffffff; }

Following this is admittedly a complicated exercise, but it illustrates the agile numeracy required of today’s energy sector CFO, and of the investors interested in properly understanding their business. KMI is certainly not alone in using financial complexity to their benefit. In this case, we think it’s driven by their continued retention of the CO2 business, which they should sell. Apart from that, KMI has some great assets.

We are invested in KMI