Fighting Climate Change Is Hard
Incoming President Biden is expected to take the U.S. back into the Paris Climate Agreement, which will mean policies to reduce emissions of GHGs (Green House Gases) will figure in Administration policy.
Polls showed that two thirds of registered U.S. voters described climate change as “somewhat” or “very” important in how they voted. As we saw last week, opinion polls were poor predictors of the election, Democrats received a substantially smaller share of the vote than this poll would have suggested.
A survey last year found that 68% of Americans wouldn’t even pay $10 a month in higher utility bills to combat climate change. It seems fair to say that, beyond a small group of climate extremists, support for green policies doesn’t have widespread economic support. The Democrats’ weaker than expected electoral result reflects this.
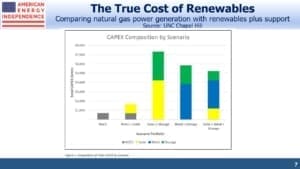
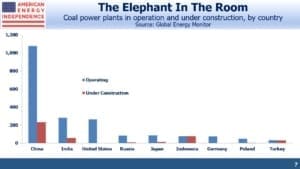
White House executive orders to combat climate change could even lead to a healthy debate about where emissions are growing and the cost of solutions. The two charts below are informative.
The first is from a 2018 paper called “Measuring Renewable Energy As Baseload Power” published in 2018 by the University of North Carolina. Proponents of solar and wind power often superficially claim that renewables are now cheaper than natural gas power plants. A true comparison needs to account for their intermittency (it’s not always sunny and windy). So the authors walk through a cost comparison of a 650 Megawatt (MW) Natural Gas Combined Cycle (NGCC) power plant running 85% of the time with solar or wind on equivalent terms. The 85% uptime for an NGCC plant allows for maintenance approximately 55 days a year. Solar intermittency means it’s producing power only 21% of the time, peaking around noon.
A correct comparison between the two requires combing the renewables power production with either (1) a smaller NGCC plant, or (2) battery storage. This raises the solar plus model to the 85% capacity utilization of the NGCC plant.
The study compares the cost of an NGCC plant with four different combinations of solar and/or wind plus supplemental power.
The point is that using renewables when they’re available can be cheap. But relying on them is not. California is finding that a purist approach to power generation of eliminating all fossil fuels plus nuclear is both more expensive and unreliable (see California Dreamin’ of Reliable Power). It’s not a combination many should find attractive.
The second chart shows coal-burning power plants in the world’s top ten users. China, the world’s biggest emitter of GHGs, doesn’t just operate far more coal burning power plants than any other country. They’re also building almost as many new plants as the existing U.S. coal fleet. This issue receives very little media attention, although the FT did highlight it recently (see Climate change: China’s coal addiction clashes with Xi’s bold promise). This is why China is planning to increase its GHG emissions over the next decade.
If the Administration pursues policies that impede the use of natural gas for power generation in favor of renewables, intermittency and China’s role in curbing emissions will receive more attention. It’s a debate worth having.
We are invested in all the components of the American Energy Independence Index via the ETF that seeks to track its performance.
Important Disclosures
The information provided is for informational purposes only and investors should determine for themselves whether a particular service, security or product is suitable for their investment needs. The information contained herein is not complete, may not be current, is subject to change, and is subject to, and qualified in its entirety by, the more complete disclosures, risk factors and other terms that are contained in the disclosure, prospectus, and offering. Certain information herein has been obtained from third party sources and, although believed to be reliable, has not been independently verified and its accuracy or completeness cannot be guaranteed. No representation is made with respect to the accuracy, completeness or timeliness of this information. Nothing provided on this site constitutes tax advice. Individuals should seek the advice of their own tax advisor for specific information regarding tax consequences of investments. Investments in securities entail risk and are not suitable for all investors. This site is not a recommendation nor an offer to sell (or solicitation of an offer to buy) securities in the United States or in any other jurisdiction.
References to indexes and benchmarks are hypothetical illustrations of aggregate returns and do not reflect the performance of any actual investment. Investors cannot invest in an index and do not reflect the deduction of the advisor’s fees or other trading expenses. There can be no assurance that current investments will be profitable. Actual realized returns will depend on, among other factors, the value of assets and market conditions at the time of disposition, any related transaction costs, and the timing of the purchase. Indexes and benchmarks may not directly correlate or only partially relate to portfolios managed by SL Advisors as they have different underlying investments and may use different strategies or have different objectives than portfolios managed by SL Advisors (e.g. The Alerian index is a group MLP securities in the oil and gas industries. Portfolios may not include the same investments that are included in the Alerian Index. The S & P Index does not directly relate to investment strategies managed by SL Advisers.)
This site may contain forward-looking statements relating to the objectives, opportunities, and the future performance of the U.S. market generally. Forward-looking statements may be identified by the use of such words as; “believe,” “expect,” “anticipate,” “should,” “planned,” “estimated,” “potential” and other similar terms. Examples of forward-looking statements include, but are not limited to, estimates with respect to financial condition, results of operations, and success or lack of success of any particular investment strategy. All are subject to various factors, including, but not limited to general and local economic conditions, changing levels of competition within certain industries and markets, changes in interest rates, changes in legislation or regulation, and other economic, competitive, governmental, regulatory and technological factors affecting a portfolio’s operations that could cause actual results to differ materially from projected results. Such statements are forward-looking in nature and involves a number of known and unknown risks, uncertainties and other factors, and accordingly, actual results may differ materially from those reflected or contemplated in such forward-looking statements. Prospective investors are cautioned not to place undue reliance on any forward-looking statements or examples. None of SL Advisors LLC or any of its affiliates or principals nor any other individual or entity assumes any obligation to update any forward-looking statements as a result of new information, subsequent events or any other circumstances. All statements made herein speak only as of the date that they were made. r
Certain hyperlinks or referenced websites on the Site, if any, are for your convenience and forward you to third parties’ websites, which generally are recognized by their top level domain name. Any descriptions of, references to, or links to other products, publications or services does not constitute an endorsement, authorization, sponsorship by or affiliation with SL Advisors LLC with respect to any linked site or its sponsor, unless expressly stated by SL Advisors LLC. Any such information, products or sites have not necessarily been reviewed by SL Advisors LLC and are provided or maintained by third parties over whom SL Advisors LLC exercise no control. SL Advisors LLC expressly disclaim any responsibility for the content, the accuracy of the information, and/or quality of products or services provided by or advertised on these third-party sites.
All investment strategies have the potential for profit or loss. Different types of investments involve varying degrees of risk, and there can be no assurance that any specific investment will be suitable or profitable for a client’s investment portfolio.
Past performance of the American Energy Independence Index is not indicative of future returns.


The reasons we quit the Paris Climate Accord was it was penalizing us more than anyone else and we’ve reduced our emissions while China and India haven’t and won’t have to for years.
Yes, I agree. I don’t think it’s a good deal for us.
Climate change started in the 1950 when CO2 level exceeded pre industrial levels. In 1990 about 1/3 of mankind was in extreme poverty. Pre COVID, that number had been reduced to less than 10%. If one looks at the maximum temperature of the 50 states, most were in 1920s and 1930s, with fewer happening post 1960 then one would expect with a random distribution (remember, climate change used to be global warming, and the US is perhaps the only large land mass with accurate temperature record going back 150 years). So why fight climate change, does keep mankind from reducing poverty or cause maximum temperatures to increase? Do any measure to combat climate change pass a cost benefit analysis? Perhaps that should be more of a focus.