Hedge Funds: Still Fleecing Investors with Expensive Mediocrity

A decade ago, the collapse of Lehman Brothers marked the psychological low of the 2008 Financial Crisis. Equity prices bottomed a few months later, in March 2009. Hedge funds had nimbly managed their way through the 2000-02 dotcom collapse, which led to substantial inflows over the next six years. By 2008 AUM had quadrupled, as less discerning investors piled in. In my 2012 book The Hedge Fund Mirage; The illusion of Big Money and Why It’s Too Good to be True, I showed that although early hedge fund investors had done very well, they weren’t that numerous.

The strong returns from the 1990s through 2002 had come with a much smaller industry. Consequently, hedge funds were far too big when the 2008 collapse came, and losses wiped out all the prior years’ profits. It meant that in the history of hedge funds, aggregate investor gains were offset by other investors’ losses. Hedge fund managers had profited; the clients had not. If all the money that’s ever been invested in hedge funds had been put in treasury bills instead, the results would have been twice as good. The Hedge Fund Mirage Turns Five showed that the book’s prediction of continued disappointment was right.

Equities Outperform Bonds

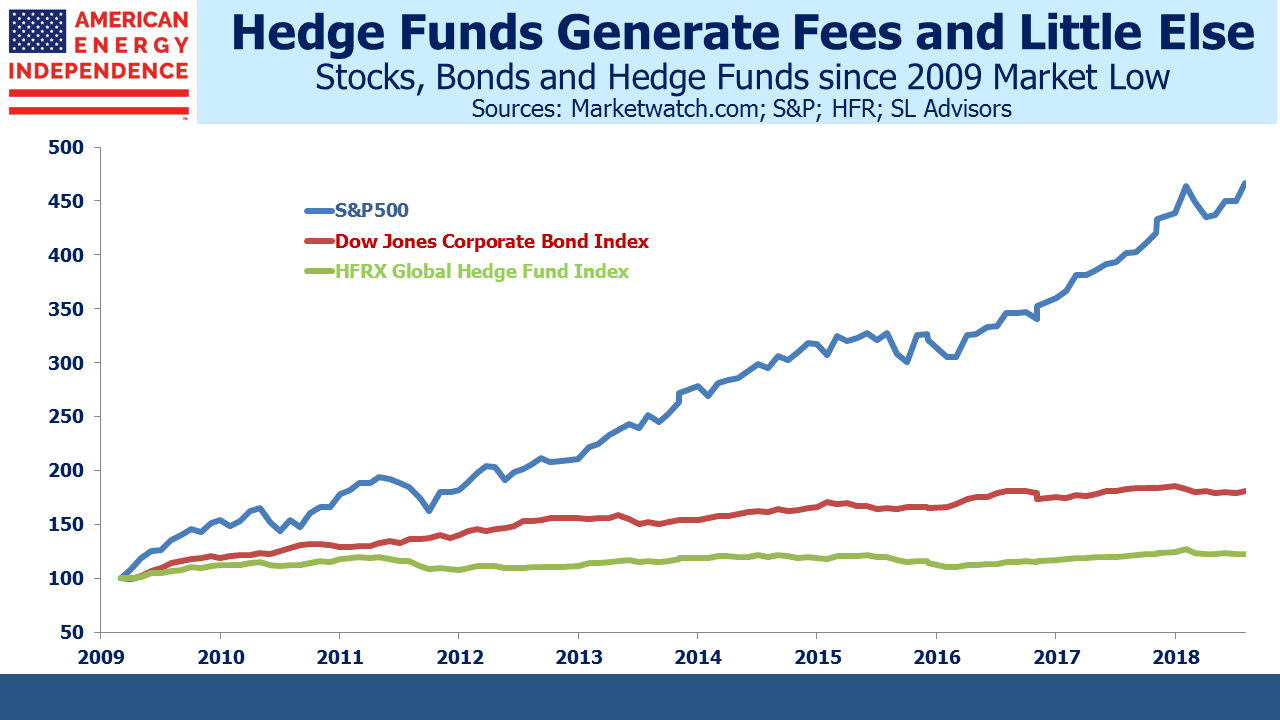
Having rudely reminded investors in 2008 that they take risk, one might think that hedge funds would have gained from the subsequent rebound in risky assets. Endure the downside, participate in the upside. Since the low in 2009 the S&P500 has returned 17.9% p.a. With dividends reinvested, it’s increased almost fivefold. Although it’s unfair to expect hedge funds to beat long-only stocks at that level, they’ve missed by such a margin that one wonders who still seriously recommends an allocation to the sector. The Dow Jones Corporate Bond index has delivered 6.4% p.a., three times the 2.1% annual return of hedge funds, even with a decade of ruinously low rates. Although worse investments are hard to find, hedge funds handily beat a fund launched in 2009 to follow Dennis Gartman’s newsletter recommendations.

Nonetheless, hedge fund managers have continued to do handsomely. Some of the smartest asset managers run hedge funds and they are highly talented at separating clients from their wealth via fees (see The Alpha Rich List Got 15% of Everything). Try thinking of anyone who became wealthy by being a hedge fund client.

Hedge fund AUM fell by half through the 2008 crisis, through investment losses as well as withdrawals from investors. Eventually some institutions saw through the false promises and left for good (see CalPERS Has Enough of Hedge Funds). But such is the attraction of investing with highly paid people that money flowed back in. Hedge fund promoters adapted their pitch. AR magazine, which published my original article on paltry returns, drew its name from covering the Absolute Return industry. When results showed that positive returns weren’t always assured, the goalposts were shifted and Relative Returns became the new mantra. But results turned out to be relatively worse than anything else. The shameless consultants moved to Uncorrelated Returns, which has turned out to be enduring since they’ve lagged just about everything outside of Venezuela. The July 2013 front cover of Bloomberg Businessweek needed few words.

Bloomberg The Hedge Fund Myth

It’s therefore no surprise that David Einhorn’s fund Greenlight is making its owners far richer than its clients. Investors in his $1.7BN flagship fund have endured almost four years of miserable performance, with a drop of 36% since November 2014. Like virtually all hedge fund managers and the industry overall, Greenlight was better when it was smaller.

Don’t blame David Einhorn. It’s a common story and he’s only the most recent former star to crash to earth. Einhorn must sincerely believe in his ability. Blame the enablers, the consultants and other advisors who drive clients to hedge funds. They still fail to recognize that high returns come from limited opportunities, and that competition from increased AUM drives them down. Last year Ted Seides (then, but no longer, co-CIO at Protégé, a fund of hedge funds) famously lost his 2007 $1million bet with Warren Buffett that hedge funds would outperform the S&P over the subsequent decade – and that was made before the financial crisis decimated stocks (see Buffett’s Hedge Fund Bet).

Protégé owner Jeff Tarrant later argued that a decade of lunches and dinners with Buffett following the bet made it money well spent – and based on what an auctioned Buffet lunch goes for, he has a point. But drawing attention to hedge fund performance is rarely a good marketing strategy, so the Ted Seides bet was ill-advised. The poor guy must have actually believed he’d win, betraying a gaping absence of investment acumen and common sense.

There are some thoughtful hedge fund investors around that add value for their clients. A few of them are friends of mine. They’re the ones who recognize the conflict of size with performance, adapting their portfolios to avoid the crowd. But the majority of hedge fund promoters orbit the truly talented to whom they only aspire, promising their gullible investors gold over the rainbow that they must know really isn’t there.

British Shale Revolution Crushed: America’s Unique Ownership of Oil and Gas

A Cuadrilla is the matador’s supporting cast. Before the bullfighter takes on his next victim, the bull is tormented and weakened by a gang (a “Cuadrilla”) of toreadors and picadors. Of course, the bull always loses, because it’s a spectacle not a sport. Cuadrilla is therefore an oddly antagonistic name for a UK company using horizontal fracturing (“fracking”) to extract natural gas from beneath communities in Lancashire, northwest England. Its opponents, who seem to include a sizeable portion of the local population, are determined to fare better than the bull against their adversary. Cuadrilla has just begun fracking tests. The company was founded in 2007 and has been trying to get started ever since. In 2011 the government halted work because it was linked to local earth tremors.

Cuadrilla UK Fracking

Based on news reports and op-ed columns, it’s Cuadrilla supported by the UK government and Matt Ridley (a well-known British writer and peer) against pretty much everyone else. Britain’s energy increasingly relies on natural gas from Norway and electricity from France. Supplies of North Sea oil peaked long ago, and the domestic coal industry has mined what’s commercially accessible. Last winter, Britain had to import liquified natural gas from Russia – possibly the least attractive energy supplier on the planet. Among the many possible consequences of a “hard” Brexit (i.e. one that happens without a successful negotiation by March 29th), is that Northern Ireland (part of the UK) will suffer widespread electricity outages. This is because its power comes from the Republic of Ireland (not part of Brexit) to its south, and a breakdown between the EU and UK would disrupt the grid.

By contrast with the U.S., Britain is increasingly energy dependent. The porous shale rock holding oil and gas that America is efficiently exploiting is found in many other parts of the world. A substantial resource is thought to be beneath the towns and farms of Lancashire and Yorkshire across northern England. The British Geological Survey estimates this Browland Shale region contains over 1,329 Trillion Cubic Feet of natural gas, more than 920 years of consumption at current levels. Such estimates of what’s recoverable are usually multiples of what actually comes out of the ground, but even with a 90% haircut, it’s a substantial amount.

Notwithstanding Britain’s commitment to reduce harmful emissions from fossil fuels, it would seem pretty clearly in the national interest to develop domestic sources of energy. Currently, the main proponents are (1) Cuadrilla, who obviously has a commercial interest, and (2) the UK government, seated in London a long way from the noise and disruption of drilling. Local communities including the Lancashire County Council are all opposed to fracking in their neighborhood, but have been over-ruled by national courts and, finally, the national government.

Fracking has its opponents in the U.S. too, and some states (such as New York) ban it. However, Texas, Louisiana, Pennsylvania and North Dakota among others have enjoyed the economic boom that the Shale Revolution has ushered in. A critical and unappreciated difference between the U.S. and Britain in this regard concerns mineral rights. American landowners typically also own anything found beneath their land, including oil and gas. They can lease the exploration rights to a drilling company in exchange for royalties from the sale of the output. This is a uniquely American concept; in Britain, mineral rights belong to the government. The result is that residents of, say, Little Plumpton have no prospect of economic gain but are expected to submit to the substantial disruption of noise, truck traffic and other inconveniences because it’s in the national interest.

Fracking is highly disruptive to American communities too, but even if you’re not the direct recipient of royalties, you know your local economy is benefitting from the jobs and higher spending that come with it. Sharing some of the profits locally creates local support, or at least tolerance, for what comes with it.

Cuadrilla has partially recognized the problem. Their website attempts to highlight the local benefits to the community, which include £10 million pounds in local spending ($13 million), £15,000 in local community donations and 24 full-time employees. You have to verify that it’s legitimately a corporate website and not run by Monty Python, given the humorously low figures which would scarcely resonate even in a third world country.

Households within one kilometer of the site are entitled to £2,000 each, while those beyond but within 1.5 kilometers get £150 each. That’s probably enough to get your family drunk at the pub for a couple of evenings. It’ll distract them from the drilling. Cuadrilla is not yet trying to bribe its adversaries into submission.

The point here is that the American system, while not perfect, is by design, far more effective than those in most other countries. The Shale Revolution has come about not just because of the geology, but also because of America’s vibrant capitalist economy, the labor force, technological excellence and, perhaps most importantly, privately owned mineral rights. If a developed country like Britain has this much trouble accessing its own resource, the era of American energy dominance will be long.

Bond Investors Agree With the Fed…For Now

The Federal Reserve has brought transparency to their decisions. The famous “blue dots” which show visually each FOMC voting member’s forecast for rates provides insight into their thinking, even if it doesn’t attach names to each dot. We’ve come a long way from Alan Greenspan’s Senate testimony, “Since becoming a central banker, I have learned to mumble with great incoherence. If I seem unduly clear to you, you must have misunderstood what I said.”

Transparency has removed the mystique. It’s now clear that the Fed doesn’t know much more than the rest of us about the economy. They’re also only average forecasters. Ever since the blue dots laid out the likely path of short term rates, which the Fed largely controls, they’ve consistently overestimated where they would set rates. It’s been a source of some amusement – if they can’t even forecast their own actions with accuracy, how can they forecast the economy?

10yr Treasury Yield Matches Feds Long Run Rate

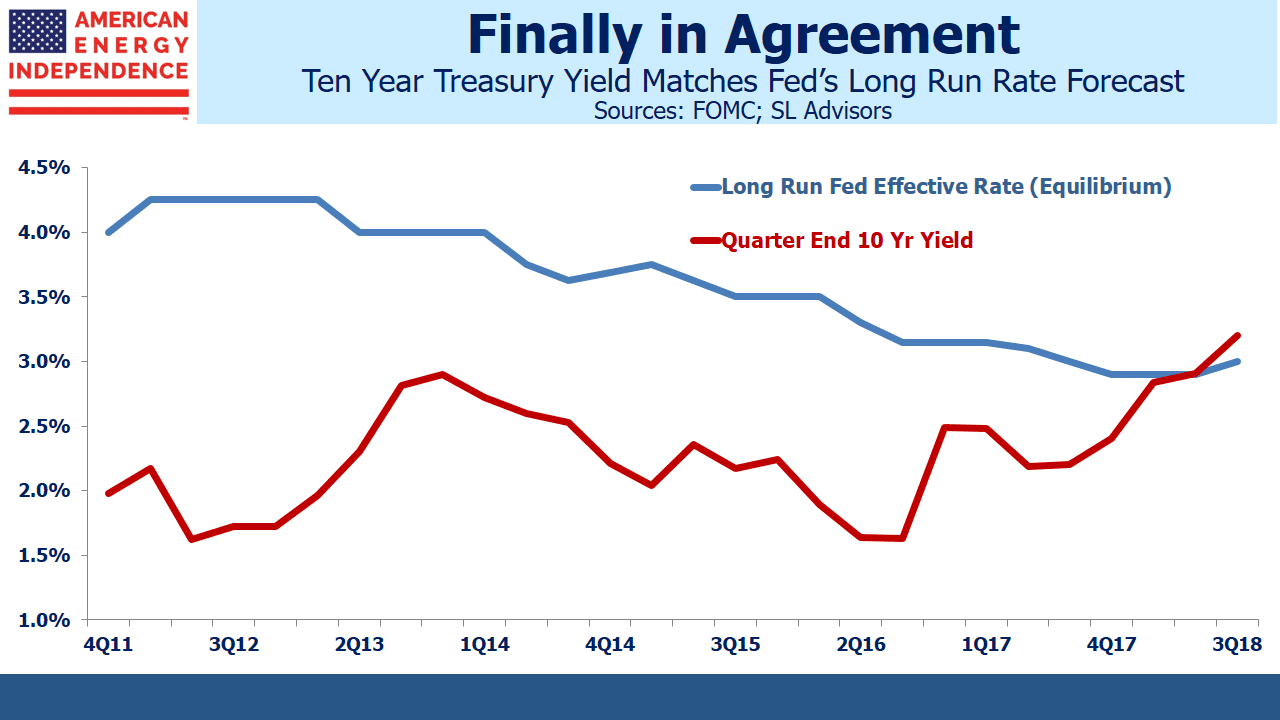
Bond investors long ago concluded that rates would stay lower for longer than the FOMC thought. Ten year treasury yields approximately reflect the bond market’s expectation for short term rates over the next decade. If the FOMC’s thinking aligns with investors, the Fed’s long run forecast of the Federal Funds rate should be similar to the ten year yield. This is the neutral rate, the equilibrium that they regard as being neither accommodative nor restrictive. Historically, it was believed to be around 2% above inflation, for a “real” rate of 2%. Since the inflation target is itself around 2%, 4% was held to be the equilibrium Fed funds rate.

As the Fed provided greater transparency, it revealed a yawning gap between their thinking and that of bond buyers. The bond market turned out to be right, and low treasury yields correctly reflected that short term rates would rise very slowly.

Interestingly though, the Fed’s equilibrium rate also began to slide lower. Since their inflation target of 2% hasn’t changed, it means their equilibrium real rate has dropped to only 1%.

One of the enduring puzzles of the past 25 years is why inflation has been so well behaved. Countless forecasters have been wrong-footed in expecting inflation to rise – with the U.S. unemployment rate at 3.7%, the lowest in living memory, few could be surprised if inflation does move sharply higher. But the FOMC implicitly expects that a less restrictive (i.e. lower real rate) will be needed than in the past to slow things down.

With the Great Recession now ten years old and the need for ultra-low rates gone, views are starting to converge. The Fed’s moderating long run forecast has now crossed the ten year treasury yield. For the first time since the regime of greater transparency, the market and the Fed are in agreement.

However, if treasury yields continue to rise, this will show that the bond market’s forecast of equilibrium rates is higher than the Fed’s. It’ll cause commentators to worry that the Fed is reacting too slowly to the threat of inflation.

It looks likely the Fed Funds rate will approach the 3% equilibrium by next year. The Fed expects moves beyond those levels to become restrictive, which is a normal part of the rate cycle. The interplay between bond yields and Fed Funds forecasts will become more important. So far, investors have been more accurate than voting FOMC members. If treasury yields head towards 3.5% it’ll suggest that the FOMC has allowed their equilibrium rate to drift too low. In that case, expect more White House tweets on rates.

Another MLP Jumps Ship

Last week Antero Midstream (AM) became the latest MLP to simplify their structure. This is further evidence of the declining opportunity set for MLP-dedicated funds, and cause for investors to seek exposure to energy infrastructure that goes beyond MLPs to include corporations (see The Uncertain Future of MLP-Dedicated Funds).

Like many MLPs before them, Antero is becoming a corporation. Broader institutional ownership and enhanced trading liquidity were cited as the reasons.

The benefits of being an MLP persist – our friend and regular commenter Elliot Miller would note that the tax benefits remain significant: MLPs don’t pay Federal corporate income tax, leaving more money available for distributions. And those distributions are largely tax deferred, with the possibility of being tax-free to one’s heirs given thoughtful estate planning.

Nonetheless, Antero concluded that the MLP structure no longer suited them. They joined a long list of companies who’ve reached the same conclusion, including Kinder Morgan (KMI), Targa Resources (TRGP), Semgroup (SEMG), Oneok (OKE), Archrock (AROC), Williams (WMB), Dominion (D) and Enbridge (ENB). Tallgrass (TGE) has retained the partnership structure for governance but chosen to be taxed as a corporation, and Plains All American offers a option for both 1099 (PAGP) and K-1 tolerant (PAA) investors.

They’ve all found that MLP investors are too few and fickle to be a reliable source of equity capital. Tax impediments add cost and complexity to tax-exempt and non-U.S. institutions, a substantial portion of the investor base for U.S. public equities. The K-1s are how investors achieve the tax benefits noted above, but their complexity dissuades most retail investors. Once you eliminate these different classes of investor, almost the only buyers left are taxable, high net worth individuals. In other words, older, wealthy Americans.

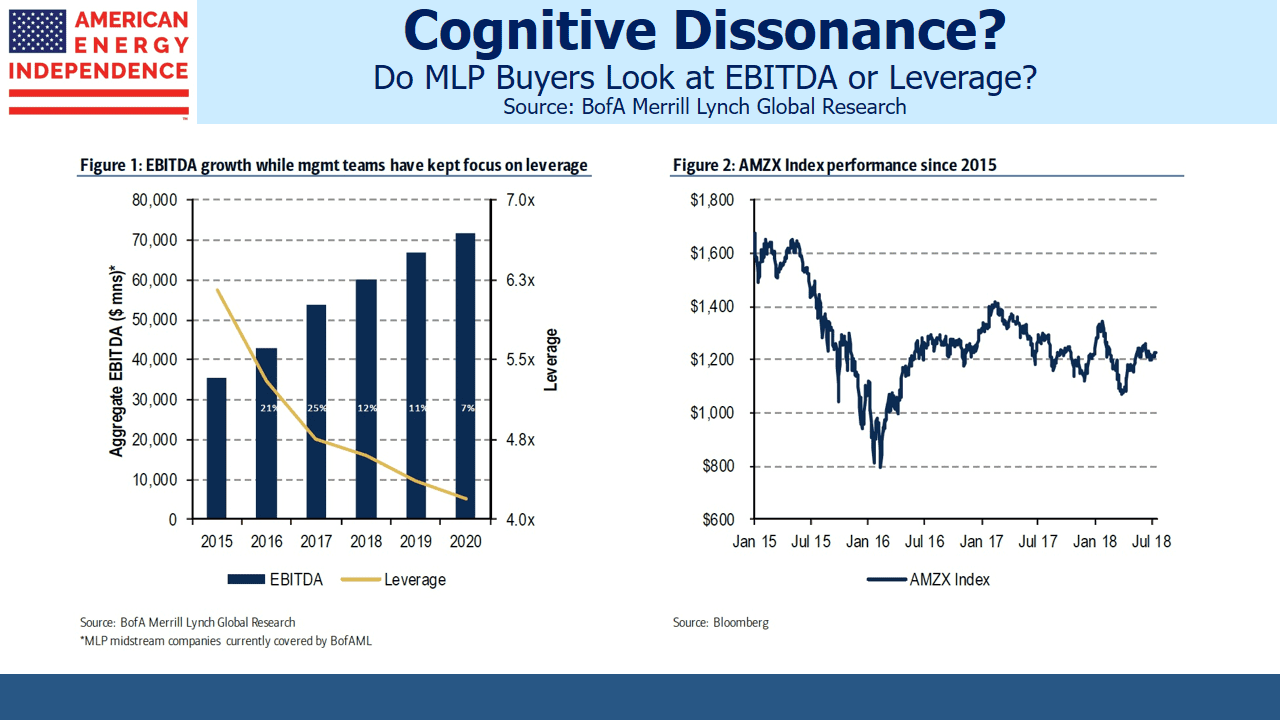
These investors like their income, and the several dozen distribution cuts imposed in recent years have done irreparable harm. The high payout ratios of MLPs left little cash for funding growth projects (see It’s the Distributions, Stupid!). This wasn’t a problem until the Shale Revolution created the need for investments in new infrastructure, to support the huge increases in U.S. oil and gas output. Cash was duly diverted from payouts to growth projects, leading to a 30% drop in distributions (see Will MLP Distribution Cuts Pay Off?).

EBITDA improved and leverage came down, but MLP investors only care about distributions, which were cut by 30%. Consequently, the sector fell hard and is still 30% below its 2014 peak.

MLP Investors EBITDA v Leverage

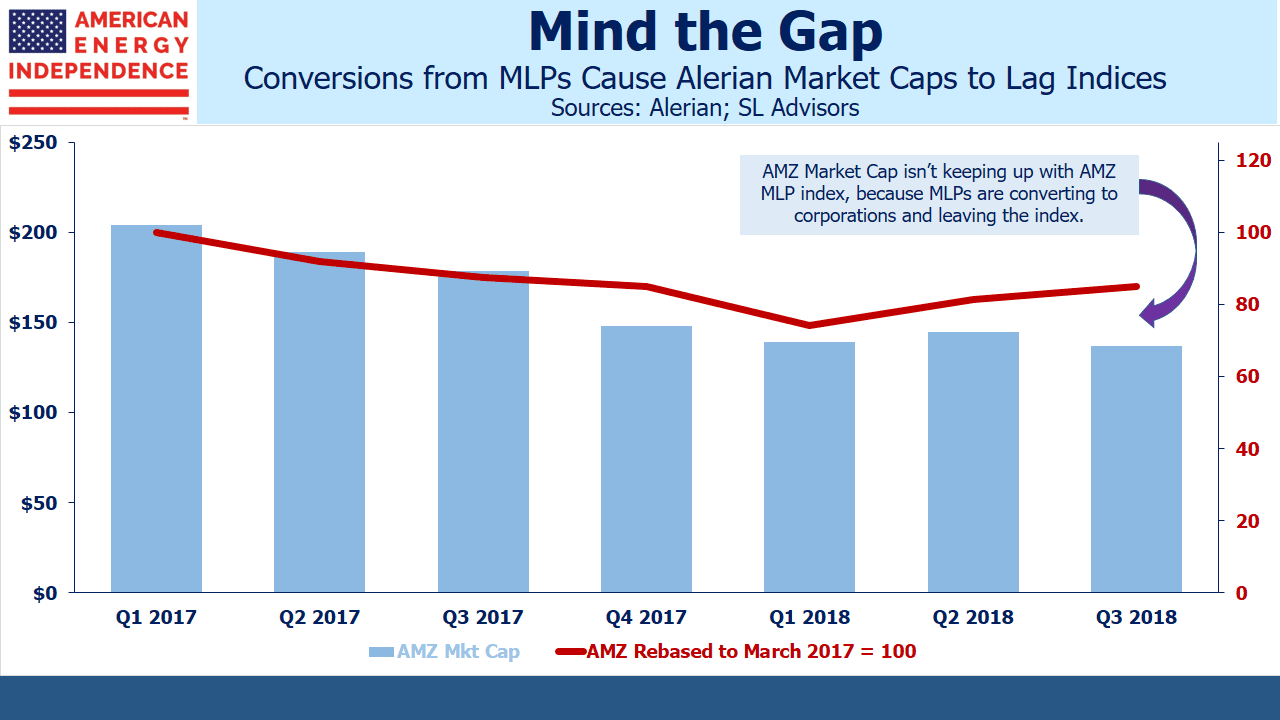
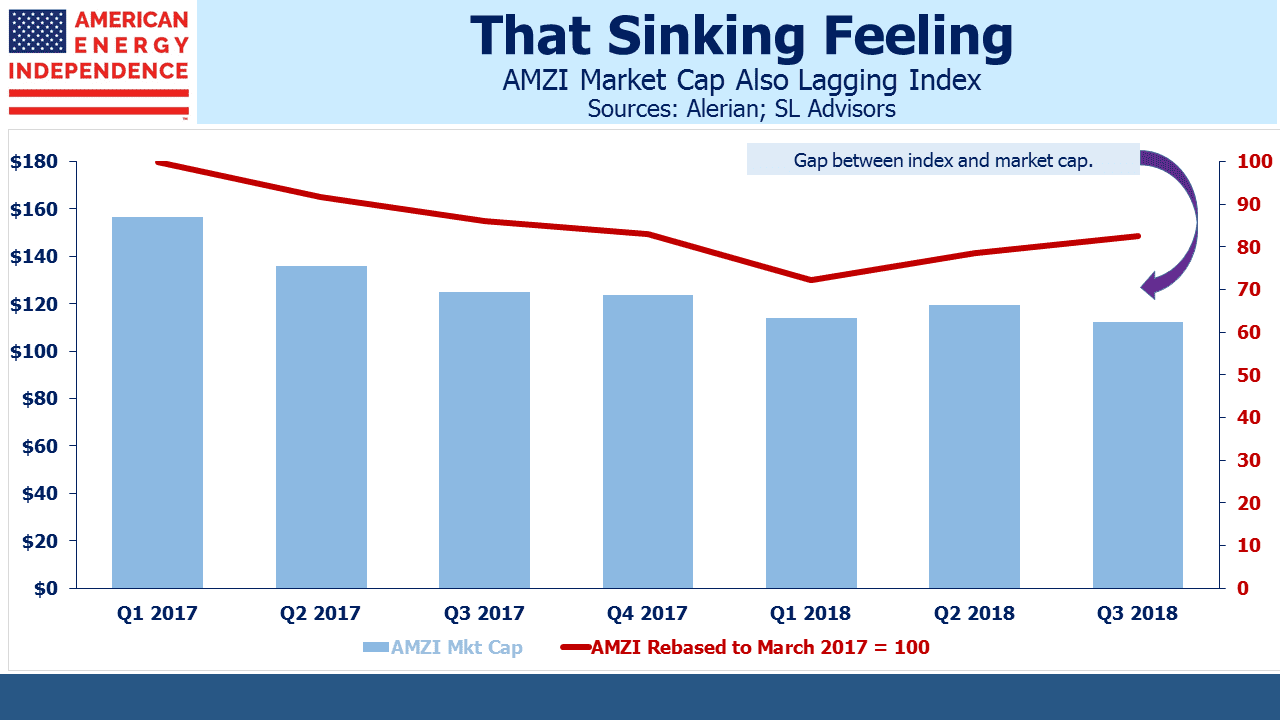
MLP-dedicated funds are left with fewer, smaller fish to catch. Their promoters still defend them, in spite of their flawed structure rendering them taxable with correspondingly eye-watering expenses (see MLP Funds Made for Uncle Sam). As pipeline companies continue to abandon the MLP structure, it’s showing up in the sinking market cap of the MLP indices. The market cap of both the Alerian MLP Index (AMZ) and the Alerian MLP Infrastructure Index (AMZI) are decreasing even while the sector is up this year.

It’s stark evidence of the declining role MLPs play in U.S.energy infrastructure. Affected ETFs include those from Alerian (AMLP) and InfraCap (AMZA). Mutual funds from Oppenheimer Steelpath, Centercoast, Mainstay Cushing and Goldman Sachs are similarly stuck with a declining opportunity set.

MLPs convert to Corporations

These MLP-dedicated funds can’t easily change their structure to avoid taxes by becoming RIC-compliant – they’d have to sell 75% of their MLPs, which is prohibitively disruptive. Some smaller funds whose MLP sales weren’t market moving have done so, which shows that others would if they could. Instead, MLP fund proponents are left to argue that their fund structure is optimal, even though no new MLP-dedicated funds are being launched any more.

Some big MLPs are happy enough. Enterprise Products (EPD), Magellan Midstream (MMP) and Energy Transfer (ETE) are all sticking with the structure. It works best if you don’t need external financing. We are invested in all three companies through our funds and separately managed account strategies.

MLPs can still be good. An MLP-only approach is not. MLP-dedicated funds are the worst place to be, given the shrinking MLP market cap and tax burden. But broad energy infrastructure, growing as we pursue American Energy Independence, is cheap.

We are long AMGP, AROC, ENB, EPD, ETE, KMI, OKE, MMP, PAGP, SEMG, TGE, TRGP, WMB. We are short AMLP.

Rising Rates Reflect Strong Pipeline Fundamentals

Will rising interest rates hurt pipeline company stocks? Ten year treasury yields are at 3.25%, a seven year high. The bond market is commanding the attention of equity investors once more.

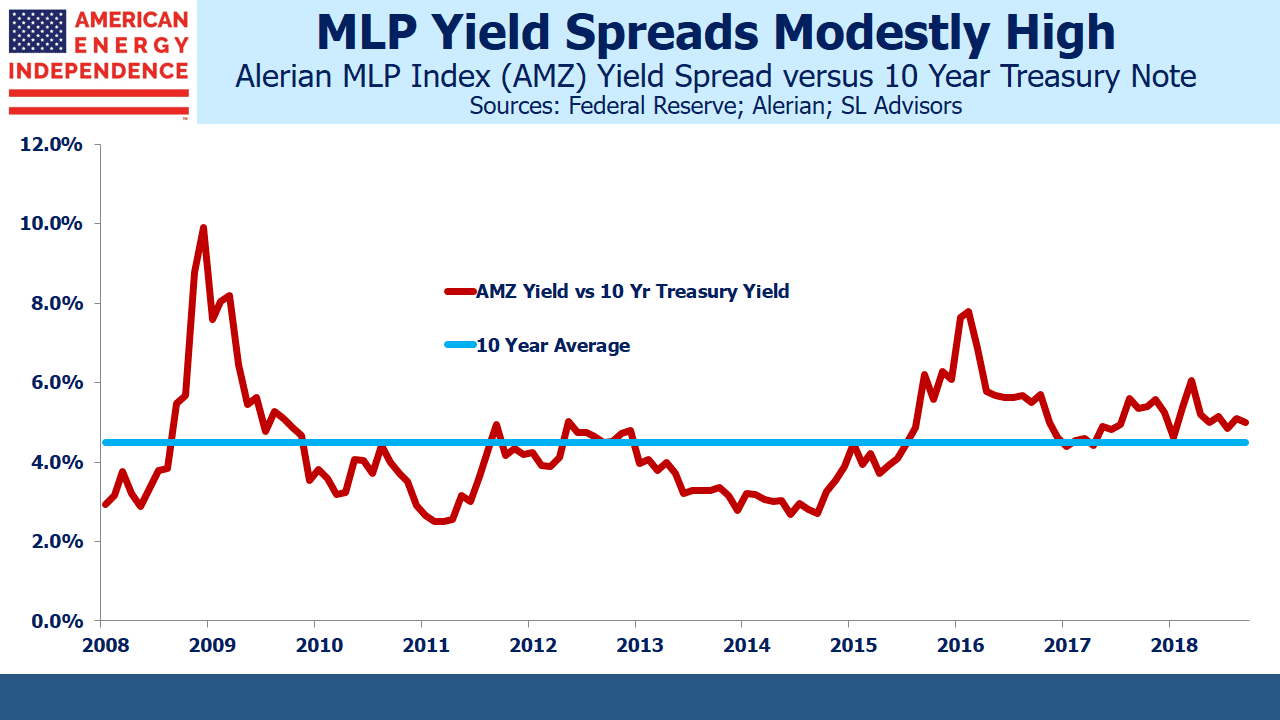
The high yields on MLPs have long attracted income-seeking investors. A common valuation metric is to compare the sector’s yield with the ten year treasury by measuring the yield spread. This is currently around 4.8%, compared with the twenty year average of 3.5%. In comparison, REITs and Utilities both have yield spreads under 1%.

While the MLP yield spread is historically wide, it’s been wider than average for almost five years, which probably means that the relationship has changed. Over the past decade it’s averaged 4.5%. MLP investors require a richer premium to other asset classes than in the past, which is why the bigger MLPs have been converting to corporations, so as to access a wider investor base (see Growth & Income? Try Pipelines).

MLP Yield Spread vs 10 Year Treasuries

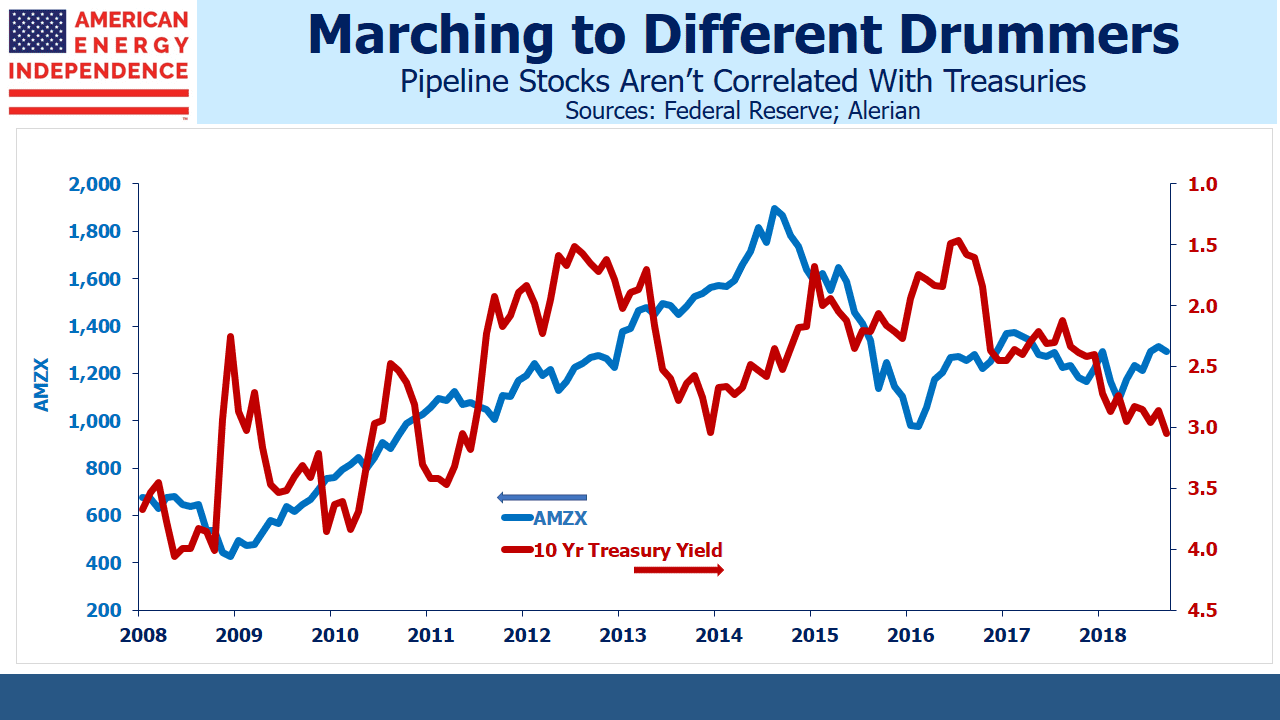
While MLP yields have remained stubbornly high, they continue to move independently of the bond market. Visually, energy infrastructure and ten year treasuries have no relationship at all. The correlation of monthly returns is -0.35 over the past decade and 0.16 over the past five years – practically speaking, there is no correlation between the two.

Pipeline Stocks Uncorrelated to Treasuries

Over short periods of time, fund outflows from income alternatives can depress MLP prices, but the effect is rarely enduring. Tariffs on regulated pipelines often include an inflation escalator, allowing increases pegged to the Producer Price Index (PPI), which creates some inflation protection for pipeline owners if inflation was to spike higher. This is why we often tell investors that the impact of higher rates depends on whether inflation is rising or not. If rising inflation drives up yields, the higher PPI will feed directly into higher revenues where contracts are correctly structured.

However, if rates move up independently of inflation (i.e. higher real rates), then all assets are affected. Any investment is worth the sum of its future cashflows discounted at an appropriate interest rate. Pipeline stocks would likely be affected like many other sectors.

But economic growth is very strong, which mitigates the effect of rates. Unemployment is the lowest in living memory at 3.7%. Everyone who wants a job has one, and demand is up for many things including pipeline capacity. The U.S. recently became the world’s biggest crude oil producer (see America Seizes Oil Throne).

Permian volumes in west Texas are overwhelming available pipeline capacity, which led to a price discount on Midland crude versus the WTI benchmark of as much as $17 in summer. It’s recently narrowed to $7 – still more than the typical contracted pipeline tariff, but less than the $10-20 cost of truck transportation.

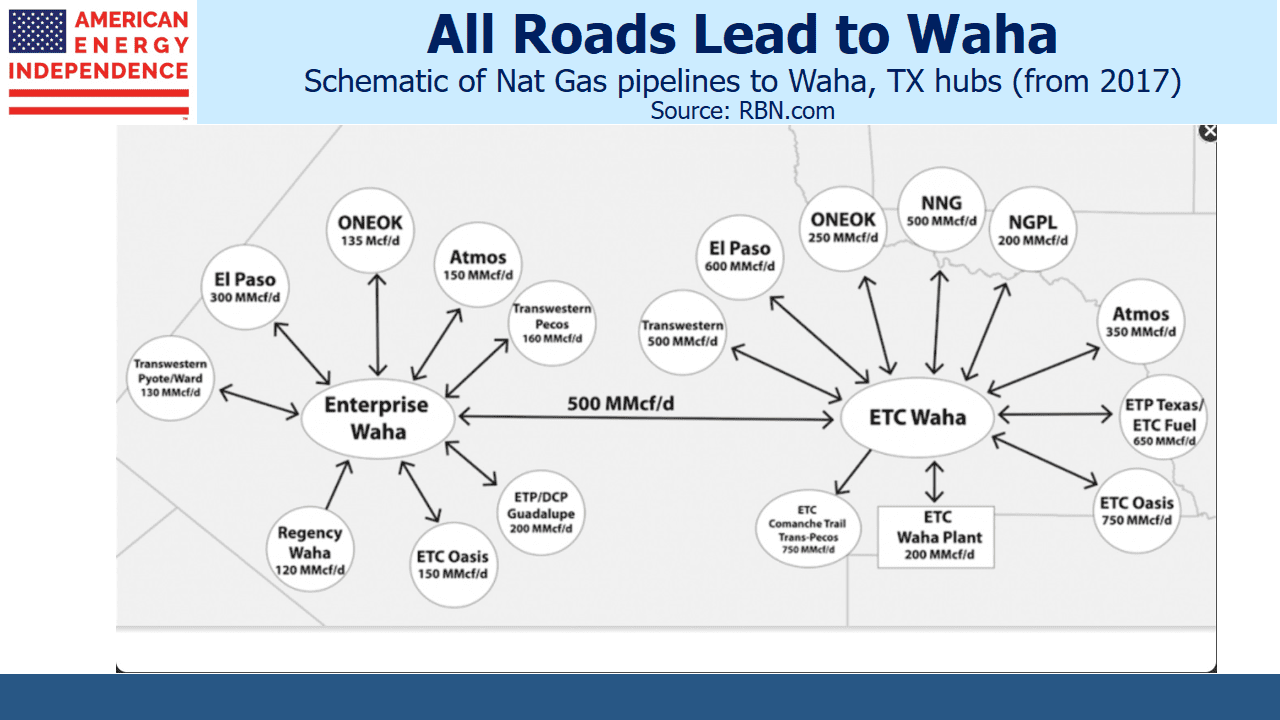
Natural gas currently trades at around $3 per Thousand Cubic Feet (MCF). The natural gas basis between Waha in West Texas and the Henry Hub benchmark location is $2, meaning Waha natgas is worth only $1 per MCF. Permian gas output is 10 Billion Cubic Feet per Day (BCF/D), whereas pipeline capacity is only 8 BCF/D. Some of this excess production is flared, meaning it’s worth zero.

Unlike crude oil, natural gas can’t easily be moved by rail or truck because of the pressure required to compress it. Pipelines are the only option, and the price discount persists because the takeaway infrastructure isn’t available.

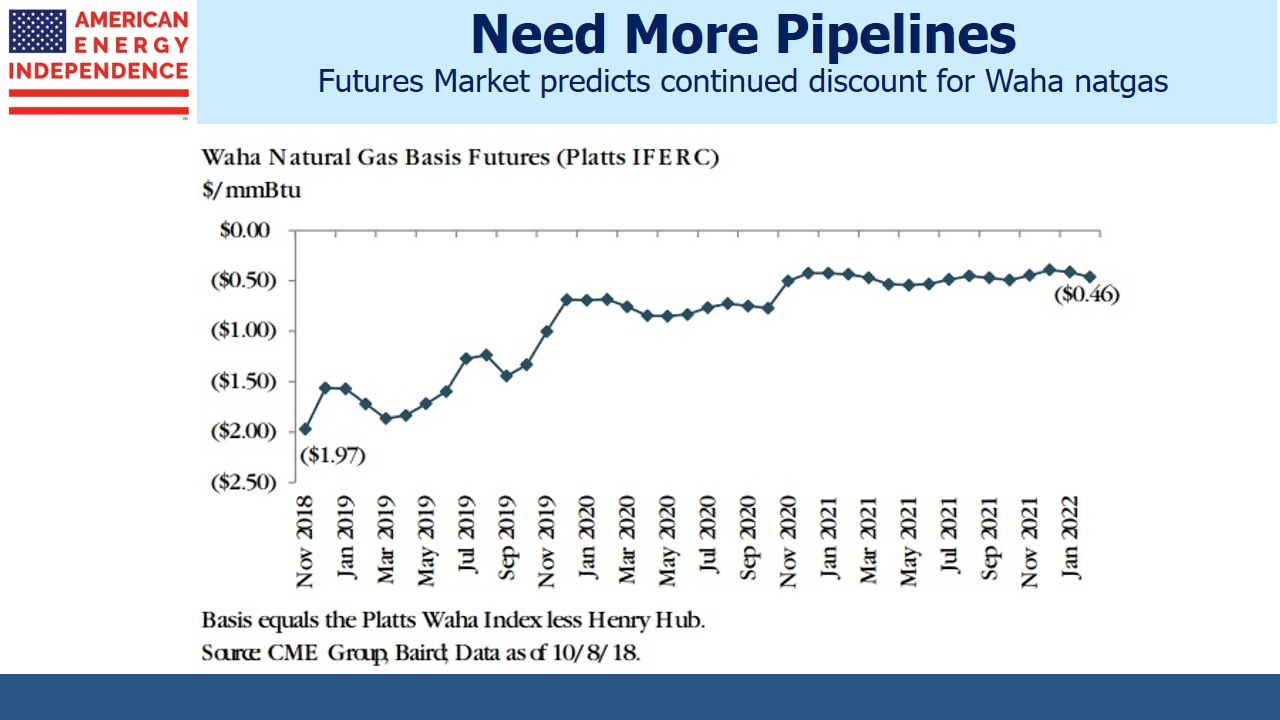
Anticipated Mexican demand is awaiting completed infrastructure south of the border. Futures traders expect the discount to persist for a while longer, which should benefit Kinder Morgan (KMI), Energy Transfer (ETE) and Oneok Inc (OKE). Beginning in 2020, additional capacity will be made available via KMI’s Gulf Coast Express and Permian Highway pipelines, adding around 4 BCF/Day.

Natural gas production is going to keep growing. Shell recently told investors they expect 2% annual growth through 2035, twice the growth in global energy demand overall. Although natural gas is often touted as being a bridge to a world of renewables, another energy executive said, “Gas not a transition fuel, but a destination fuel.”

Waha Natural Gas Basis Futures

The point is that these price differentials, which reflect unmet demand for additional pipeline capacity, are unlikely to be harmed by a modest rise in interest rates. The bond market is under pressure because the economy is booming.

Moreover, today’s battle-hardened MLP investors have endured several dozen MLP distribution cuts. The secular growth in U.S. hydrocarbon production is what attracts them (see Can Anyone Catch America in Plastics?). The companies themselves have also changed, with many of the biggest abandoning the MLP structure to become corporations (see The Uncertain Future of MLP-Dedicated Funds). As a result, broad energy infrastructure is less reliant on MLP investors (often older, wealthy Americans). The adoption of a corporate form, widely followed by the biggest MLPs and most recently by Antero Midstream GP (AMGP) has resulted in a broader, more institutional investor base.

The bottom line is that there’s little reason to fear the current rise in interest rates. Historically, there’s no statistical relationship between bonds and pipeline stocks. Output of oil, gas and natural gas liquids is rising, fueling demand for infrastructure. And the investor base is probably the broadest it’s ever been, as companies move away from the fickle MLP investor towards more conventional holders of U.S. equities. The broad-based American Energy Independence Index, which includes the biggest U.S. and Canadian energy infrastructure stocks, is up almost 2% in October even with treasury yields up 0.20%. So far, the sector has not been impacted by the headlines around rising rates.

We are long AMGP, ETE, KMI and OKE

Can Anyone Catch America in Plastics?

Ethane prices recently hit a four year high. Although this garnered far less attention than the crude oil rally, increasing supplies of ethane is an unappreciated element of the Shale Revolution.

“Dry” natural gas consists of methane, most commonly supplied to residential gas stoves but also increasingly used by power plants to produce electricity. “Wet” gas includes other natural gas liquids (NGLs), such as ethane (more below), propane (used in your outdoor BBQ), butane (cigarette lighters) and other more obscure NGLs such as isobutene. Typically, the NGLs and other impurities are separated out from the wet gas, leaving methane as the natural gas that flows to customers. Because NGLs have marketable value, wet gas is more desirable.

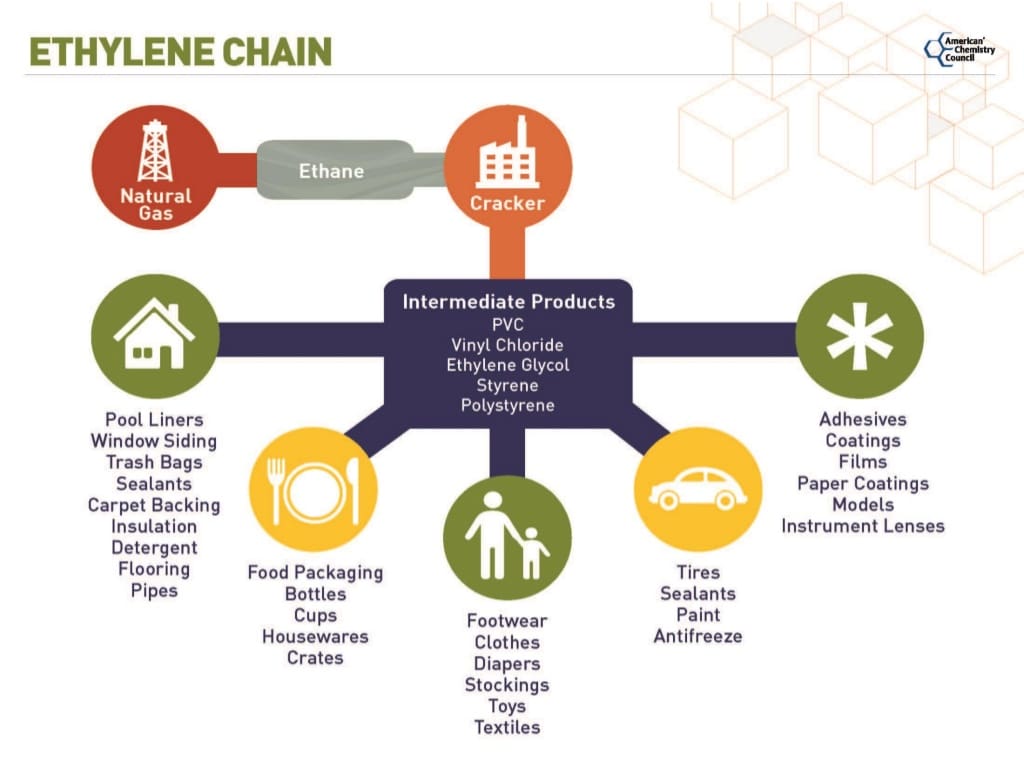
Ethane, once converted to ethylene through “cracking” is the principal input into production of polyethylene. Simply put, ethane is turned into plastic. Polyethylene is manufactured in greater quantities than any other compound.

Plastics are the by-product of ethane

The process is fascinating, and naturally the internet provides ample information. Ethane molecules are broken through heating (“cracked” in industry parlance), and the ethylene produced undergoes further processing into polyethylene pellets. These plastic pellets come with different properties such as strength, flexibility and melting point, which determine their ultimate use. They are heated and molded into many thousands of consumer and specialty products. For an absorbing description that follows ethane molecules from extraction to ultimate use, the Houston Chronicle’s three-part series Texas petrochemical plants turn ethane into building blocks of plastic is highly readable.

Among many fascinating steps, we learn that molten polyethylene pellets are blown into a very thin cylindrical balloon, several hundred feet long. This is then turned into sheets by passing through rollers, and multiple sheets are combined depending on the desired thickness. In the article, these ethane molecules ultimately traveled as plastic pellets to Vietnam where they were processed into packaging for frozen shrimp that was shipped back to the U.S. The petrochemical industry makes this happen.

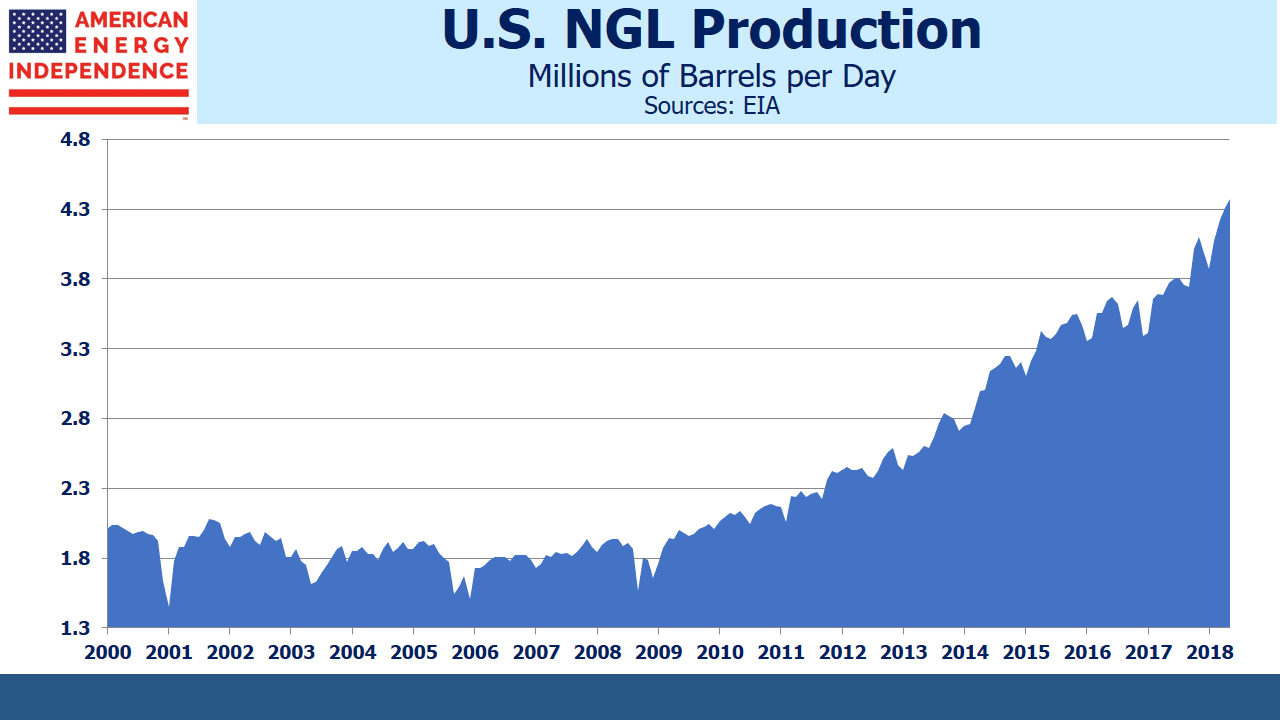
U.S. ethane production has more than doubled in the past decade, to 1.5 Million Barrels per Day (MMB/D). Ethane is a gas and isn’t shipped in barrels. The MMB/D unit of measure converts the energy content of the ethane to that in a barrel of crude oil. Barrels of Oil Equivalent (BOE), allows volumes of most hydrocarbons to be measured using a common metric. What further sets the U.S. apart is that shale’s light crude comes with relatively high concentrations of NGLs, including ethane. It simply needs to be separated out.  The alternative source of ethane is as a by-product from refining crude oil, a more costly approach.

Plastics are the by-product of Ethane

The U.S. is producing so much ethane that some of it is being mixed in with the methane natural gas stream as it can’t be profitably used elsewhere (known as “ethane rejection”). Low ethane prices with the promise of ongoing ample supply have led to a flurry of new petrochemical investments.  Cheap natural gas lowers processing costs, since the conversion of ethane to plastic pellets requires heat. For example, Exxon Mobil (XOM) operates one of the world’s largest polyethylene plants in Mont Belvieu, TX, with ethylene provided by a new facility at their nearby Baytown complex.

But the big increase in natural gas output is in Appalachia, where the Marcellus and Utica shale formations are providing most of this new supply. Royal Dutch Shell is building a new ethane cracker in western Pennsylvania, close to its supply. In total, $202BN of investments in 333 projects have been announced since 2010. U.S. ethane exports have been rising, but as these new facilities become operational they will increase domestic demand. Two thirds of the investments involve foreign companies. The recent jump in the ethane price is partly attributable to new domestic buyers.

The result is that ethane trade flows are shifting, and the U.S. is becoming a more important supplier of plastics.

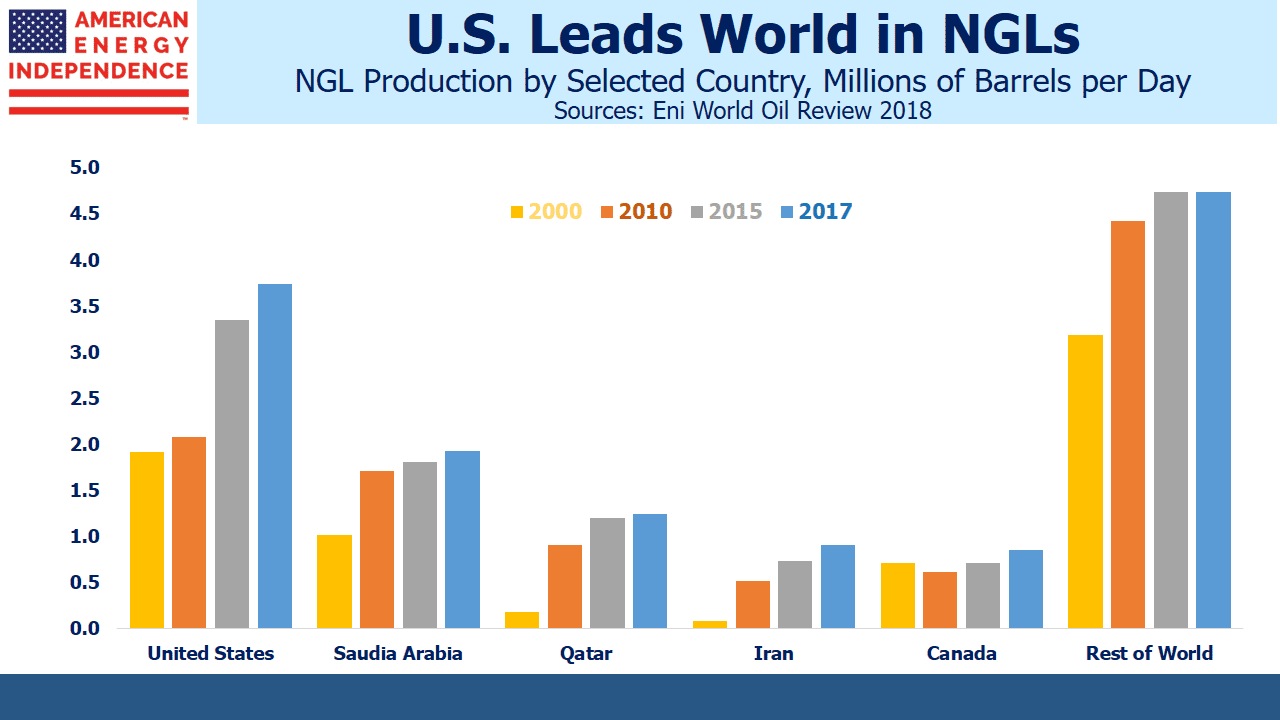
The Shale Revolution draws attention for the growth in fossil fuels — crude oil and natural gas, where the U.S. leads the world.  But we’re even more dominant in NGLs, contributing one-third of global production. The impact of NGLs and consequent growth in America’s petrochemical industry receives far less attention, although it’s another huge success story.

Plastics are the by-product of Ethane

Enterprise Products Partners (EPD), Energy Transfer Equity (ETE), Oneok Inc. (OKE) and Targa Resources Corp (TRGP) are well positioned to benefit from America’s growing NGL production. Our funds are invested in all of them.

Saudi America: Why the Shale Revolution is Real

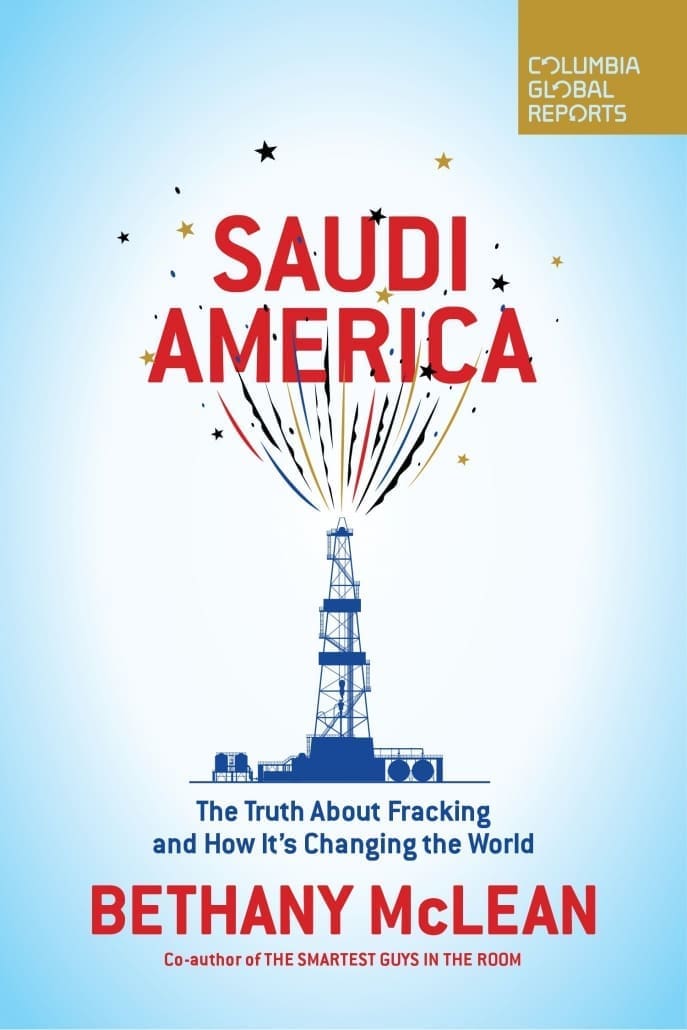
Bethany McLean didn’t intend her latest book, Saudi America: The Truth About Fracking and How It’s Changing the World, to be a booster of the Shale Revolution. The New York Times got it all wrong when they titled her promotional op-ed, The Next Financial Crisis Lurks Underground. Before reading her book, I therefore assumed that in forecasting a collapse in the U.S. energy sector, the very recent one in 2014-16 had simply passed her by (see New York Times Forecasts the 2014-16 Energy Sector Collapse). But McLean accurately chronicles how OPEC nations failed to bankrupt the nascent U.S. shale industry with low oil prices, thereby demonstrating its resilience. She notes the importance of privately-owned mineral rights, an almost-uniquely American concept that facilitated onshore oil and gas exploration long before shale. Those who don’t fear a crash are well represented. The IEA’s chief economist, Fatih Birol, says, “There is a silent revolution taking place in the United States, so silent that nobody’s aware of it.”

Saudi America - Book Review

In fact, McLean’s warnings of collapse are based on such weak arguments and are so half-hearted that she’s grudgingly conceding the secular change in world energy markets that’s occurring. A private equity investor (“titan”) suggests “…the Federal Reserve is entirely responsible for the fracking boom.” Really? Did the Fed buy energy sector bonds? Are low interest rates failing to benefit any other sector? In 2016, non-investment grade bond yields for some energy names reached 25%. Although there were bankruptcies, the industry survived as assets moved from weak hands to strong. She also finds some bearish hedge fund managers who have lost money shorting shale drillers. If these are the best arguments for another crash in the U.S. energy sector, investors have little to fear. In fact, the weakness of McLean’s arguments against Shale offered a more convincing defense of its longevity than many authors who set out to do just that.

As is often the case, the characters are most interesting. Although McLean relies heavily on past writings on Chesapeake founder Aubrey McLendon, it’s still absorbing to reread about his enormous risk appetite. McLendon’s fiery death while driving alone two years ago looked like suicide, given his mounting financial and legal problems, but it was ruled an accident. The industry lost a colorful believer whose single-minded approach was financially unsuccessful. By contrast, the methodical, analytical approach of companies like EOG demonstrates that the resurgence of hydrocarbon production in the U.S. is not driven by leveraged operators that are permanently bullish.

Shale firms have long been criticized for outspending their cashflow. The industry’s continued access to capital demonstrates that many expect this to reverse. The world’s biggest oil companies, like Exxon Mobil, are now investing in shale, bringing financial discipline and less reliance on capital markets financing, exactly what McLean believes is needed.

You have to work pretty hard to find a downside to American Energy Independence. It’s a bit like complaining about an outsized capital gains tax bill. Shale is pretty obviously an enormous U.S. benefit; less clearly good for others. Nonetheless, McLean tries to get us worried: if we buy less oil from unstable parts of the world, we’re less likely to care about their security. That’s not obviously bad for our young men and women in the military.

McLean fears that the Trump Administration’s desire to drill for oil in the Arctic National Wildlife Refuge (ANWR), “…will crater prices, thereby making the economics of drilling even less attractive than they already are.” Little thought went into that sentence – there are reasons to leave ANWR alone, but crashing the oil market is not one of them. This is where the real McLean emerges – as an environmentalist opposed to fossil fuels, trying to marshal non-environmental arguments against.

Having made a convincing if unintended case that financial challenges will not derail America’s energy renaissance, McLean then warns that renewables will soon bring its demise. But even here, she makes a strong argument for natural gas as a complement to intermittent solar and wind. She quotes Michael Cembalest, JPMorgan’s thoughtful chief strategist, who wrote that, “An electricity grid with less coal, less nuclear, and more renewable energy would be highly dependent on abundant, low-cost natural gas.” We completely agree.

The short-cycle nature of shale production is its enormous strength, something McLean overlooks. Predicting long term demand for crude oil is never easy, but the development of electric cars makes it exceptionally risky to invest in projects with a 20 year payback, which is what conventional oil projects look like. Shale production relies on drilling hundreds of wells that cost under $10MM each. Output declines sharply from a high rate, but capital invested is repaid quickly, often within two years. Output can be hedged in the futures market. If prices drop, drillers stop completing new wells. This quick payback offers a substantially better risk profile, something the industry recognizes. It’s why capital continues to flow in that direction (see Why Electric Cars Help the Shale Revolution).

Saudi America is a quick read – at only 138 pages, I finished it in around four hours. You won’t gain many insights, but as a chronicle of why the Shale Revolution will continue to transform energy markets, it’s worth a quiet afternoon.

Pipeline Stocks Chart a Higher Path

Technical analysis shows that the outlook for pipeline stocks is bullish.

We rarely write on technicals, since we’re relentlessly focused on the fundamentals. But fundamental news has been light, with prices drifting irregularly lower. Investors are overwhelmingly frustrated with the failure of pipeline company stocks to reflect growing throughput volumes. The U.S. just claimed World’s Biggest Oil Producer (see America Seizes Oil Throne). Liquified Natural Gas exports are set to more than double next year (see U.S. Oil and Gas Exports: A New Weapon). In willful defiance, pipeline stocks sagged. One sell-side analyst described recent investor meetings as, “at times blurred between market discussions and therapy sessions.”

For a chartist relying on technical analysis, we think the sector is setting up for a sustained rally. We don’t make investment decisions based on charts. As a visual price history they are helpful, but our portfolio adjustments are driven by shifts in long term fundamentals. However, many investors use technical analysis as a timing aid. Some pore over charts carefully before making decisions. Absent much market-moving news, such analysis is more relevant.

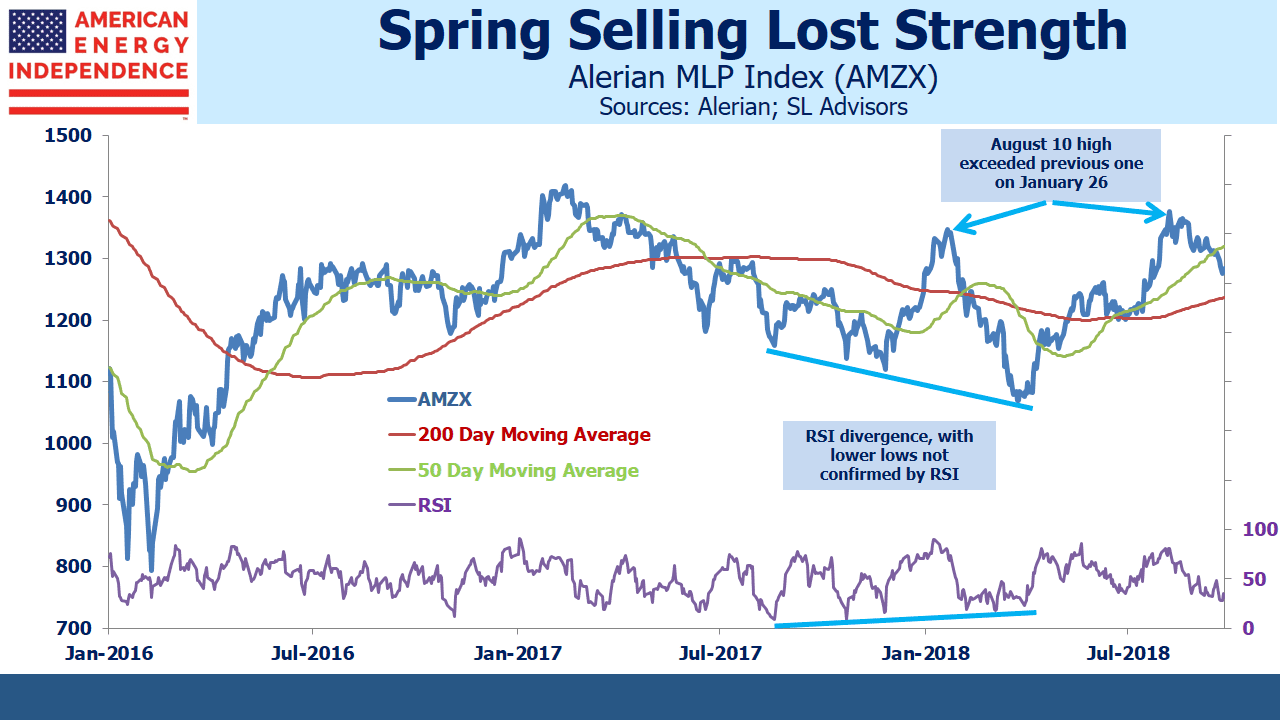
Energy infrastructure charts show three bullish patterns. The first is that the sequence of lower lows from late last year into Spring was not confirmed by the Relative Strength Index (RSI) readings. This type of divergence typically indicates weaker conviction among sellers on each successive dip, warning of a change in trend. Sure enough, the recent August high exceeded the prior one in February, revealing that a new uptrend has begun.

Pipeline Stocks Chart Higher

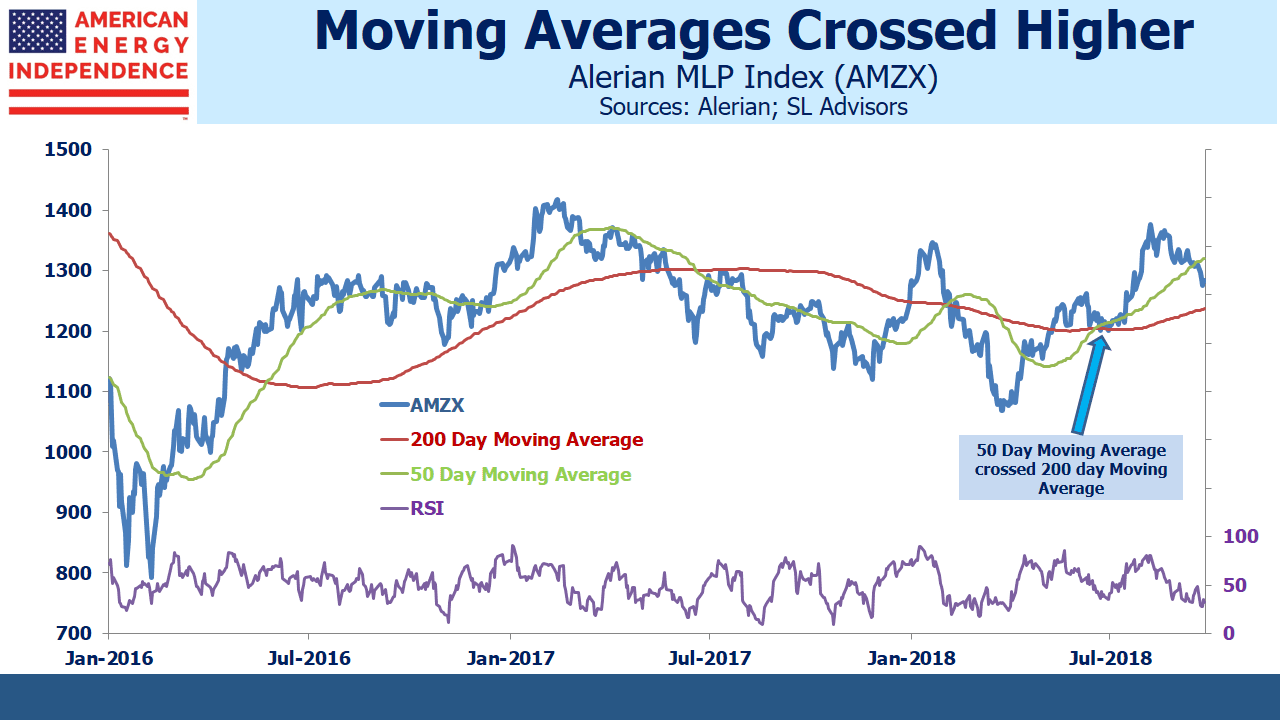
Supporting this, in June the 50 day moving average convincingly crossed the 200 day moving average, following which the sector moved smartly higher.

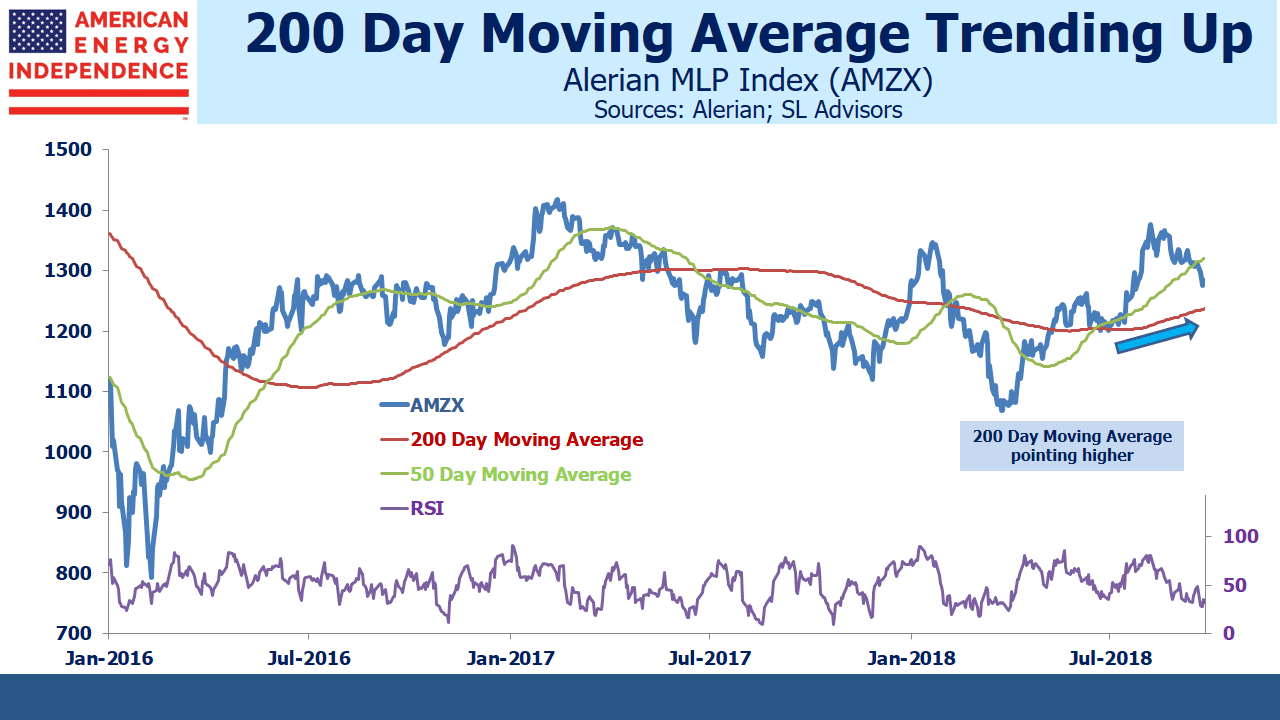
Further confirmation is provided by the clear upturn in the 200 day moving average.

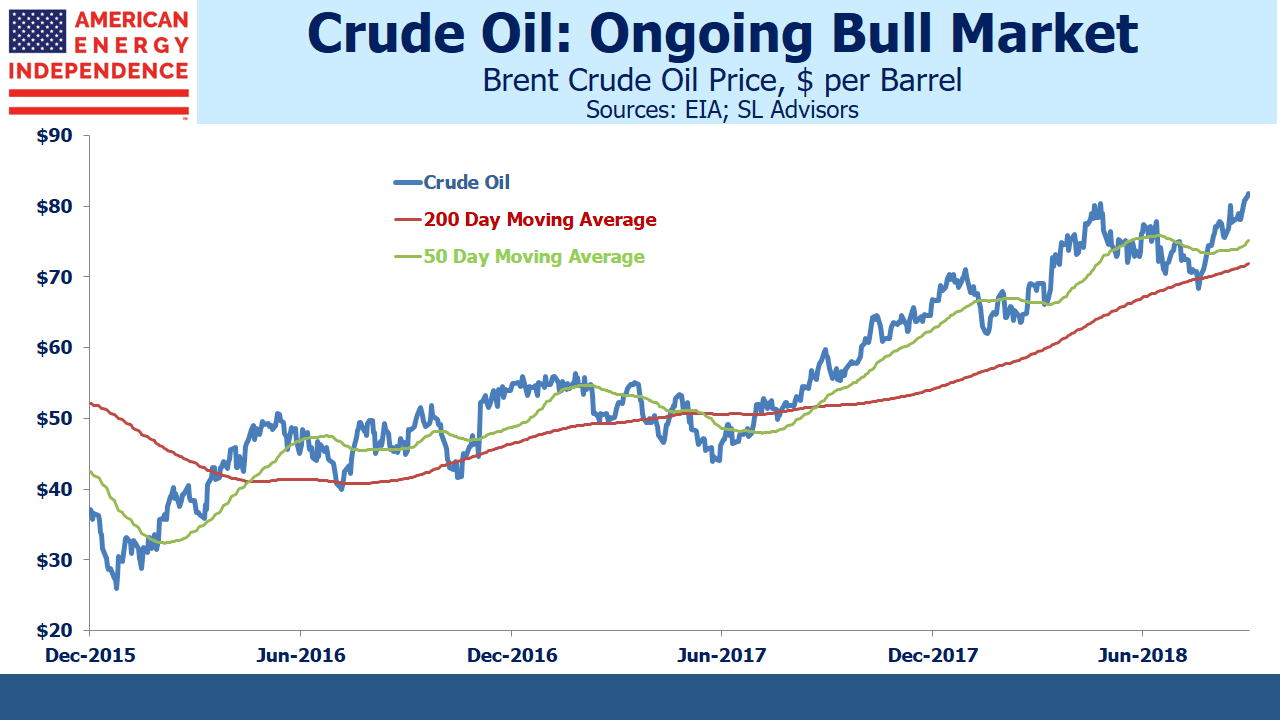
This all points to a sector in which medium term (i.e. 3-12 months) momentum is turning up, with the recent softness not that material over a longer perspective. Crude oil technical analysis shows a bull market many months old, adding to the frustration of  investors in pipeline stocks who feel the two are only correlated on the downside.

Nonetheless, the sector has been weak. It might be in part because the Alerian MLP ETF (AMLP) has experienced steady outflows since June. Its shares outstanding have dropped by 8% in spite of the fact that 2Q18 earnings were generally good. Some of this is probably due to growing awareness of its flawed tax structure (see Uncle Sam Helps You Short AMLP) and shrinking pool of MLPs (see The Uncertain Future of MLP-Dedicated Funds). One reader on Seeking Alpha described it as “obsolete and tax inefficient”.

Oil and gas volumes continue to grow, which augurs well for the next earnings reports in October. Examples of infrastructure shortages abound. Natural gas at the Waha hub in west Texas trades at $0.82 per thousand cubic feet, a steep discount to the $3 Henry Hub benchmark because gas production exceeds pipeline capacity. Gas is being flared in the Permian basin.

Crude oil in Midland, TX trades at a $12 per barrel discount to Cushing, OK (the delivery point for CME futures). This similarly reflects a shortage of pipeline capacity, since tariffs on long term contracts are around $3-$5. The 2015 collapse was due to fears of pipeline overcapacity, so today’s bottlenecks ought to be positive.

Proposition 112 is the Colorado referendum question that would greatly impede future oil and gas development.  Fear of it passing in November has weighed on affected stocks, such as Noble Midstream (NBLX) and Western Gas (WES). But there’s no indication that other states are considering similar moves, so its impact is limited to those with significant Colorado exposure.

We expect solid 3Q18 earnings, which will support 10% dividend growth across the sector.  This might well provide the fundamental impetus needed for pipeline stocks to rally. When that happens, technical analysts can point to chart patterns that predicted it.

We are invested in Western Gas Equity Partners (General Partner of WES), and are short AMLP.

image_pdfimage_print