Income Investors Should Return to Pipelines in 2019

MLPs have become more attractively priced compared with other income-oriented sectors. One way to see this is to compare the trailing four quarter yield. REITs and utilities have remained within a fairly narrow range, while MLPs rose sharply during the 2014-15 oil collapse. After a partial recovery, weakness over the past year or so has caused MLP yields to drift higher again.

MLP Yields on the Rise


For many years prior to the 2014 sector peak, MLP yields were around 2% above utilities. Currently, they’re around 5% wider. This ought to attract crossover buying from income-seeking investors, switching their utility exposure for MLPs, but so far there’s limited evidence of this happening. Although the yield advantage over REITs isn’t quite as dramatic, the same relative value switch exists there too.


The broad energy sector has remained out of favor. MLPs used to track utilities and REITs fairly closely until 2014 when they followed energy lower. However, even compared with energy, midstream infrastructure remains historically cheap. Research from Credit Suisse shows that on an Enterprise Value/EBITDA basis, pipelines are the cheapest vs the S&P energy sector they’ve been since 2010.

Midstream Cheap vs Historical Valuation

The Shale Revolution has challenged the MLP model in ways that few anticipated. Increasing U.S. output of crude oil, natural gas liquids and natural gas is creating substantial benefits for the U.S. Improved terms of trade, greater geopolitical flexibility and reduced CO2 emissions underpin America’s greater willingness to buck the global consensus. However, investors are still waiting for the financial benefits. This is partly because the capital investments required have demanded more cash. E&P companies had to fund investments in new production, which drew criticism that they were over-spending on growth. Similarly, MLPs pursued many opportunities to add infrastructure for transportation, processing and storage in support of new production. All this left less cash to be returned to investors through buybacks and dividends. It remains the biggest impediment to improved returns.


Unlike MLPs, both utilities and REITs have both been increasing dividends. Even the energy sector has raised payouts, although this was achieved in part through less spent on stock buybacks, which has led their investor base to insist on improved financial discipline. MLPs have both increased cash flows and lowered distributions.  Oil & gas executives seem unable to turn down a growth project.

By contrast with the income sectors with which MLPs used to compete, they have been lowering dividends. This makes yield comparisons less reliable, and likely explains why there’s been little evidence of shifts away from lower-yielding, traditional income sectors.

It’s why the biggest pipeline companies have dropped the MLP structure in favor of becoming corporations, so as to access the broadest possible set of investors. However, that hasn’t always worked out either, as the history of prior distribution cuts continues to weigh on sentiment. Williams Companies (WMB) is an example of a corporation that combined with its MLP, Williams Partners (WPZ). WMB CEO Alan Armstrong claims to be puzzled by persistent stock weakness. Meanwhile, legacy WPZ investors well recall the multiple distribution cuts they endured along the way (see Pipeline Dividends Are Heading Up).

In our experience, one of the issues that makes current investors nervous and gives new ones pause is that they don’t understand the continued weakness when volumes are up and management teams bullish. In December most sectors were down sharply, and global growth concerns depressed the energy sector along with most others. But for most of 2018 and certainly the second half, the disconnect between strong operating performance and poor security returns has perplexed many.

We’ve sought to explain this, and regular readers will know we’ve concluded that reduced distributions are the most important factor. The investor base was originally drawn for stable income, which in recent years MLPs have failed to provide. The Shale Revolution, perversely, has so far been a lousy investment theme even while it’s been terrific for America.  The charts in this blog post present a narrative now familiar to many.

Next year we expect rising dividends for the companies in the American Energy Independence Index to draw increasingly favorable attention to the sector. Although the MLP model no longer suits most of the biggest operators in the industry, midstream energy infrastructure offers compelling value. The best way to participate is by investing in the biggest companies, which are mostly corporations but do include a few MLPs. When the sector begins its recovery, it’ll start from far below fair value.

We are invested in WMB.

SL Advisors is the sub-advisor to the Catalyst MLP & Infrastructure Fund.  To learn more about the Fund,  please click here.

SL Advisors is also the advisor to an ETF (USAIETF.com).

Stocks Are the Cheapest Since 2012

Christmas couldn’t come soon enough for investors – at least the market can’t fall when it’s closed. Record outflows from equity funds accompanied one of the worst Decembers on record (so far). So sharing traditional fare on Christmas Eve (fish) and Christmas Day (turkey) with family and close friends was especially enjoyable. We have much to be thankful for. Insignificantly low on that list but gratifying nonetheless is my children’s disdain for Christmas pudding (also known as plum pudding). Years ago I tried to impart to them my love for this very English Christmas dessert of dark, rich fruit cake with heavy cream – but since portions are finite, I didn’t press the issue. I now face little competition for a second slice. Appetite well sated, the convivial holiday period reminds that, in spite of falling stocks, long term optimism about America and our economic outlook remains overwhelmingly the only sensible posture.

In October we noted that the Equity Risk Premium (ERP) was still historically wide, meaning that the earnings yield on stocks is sufficiently high relative to bond yields that investors should favor equities (see Bonds Still Can’t Compete with Stocks). Since then, stock prices and bond yields have both fallen. 2019 consensus earnings forecasts for the S&P500 have moderated somewhat, with growth of 8.8% versus 10.1% in October. As a result, the ERP has jumped, from 3.4 to 4.3. Stocks are now the cheapest they’ve been in six years, compared with bonds. In 2012 the ERP was 5.6, and the following year stocks rose +30%.

History shows that a relatively wide ERP is associated with above average subsequent equity returns, and the more extreme the ERP the better stocks do. Today, bonds offer little value compared with stocks.

The inputs are bond yields, along with the level and future earnings of the S&P500. Shifts in any of these will alter the ERP. 2019 S&P earnings are currently forecast at $176 by Factset, down from $178 in October. The decline in earnings growth (from 10.1% to 8.8%) reflects developing concerns around global growth, and it’s quite possible that downward revisions lag, meaning there’s farther to fall. Treasury Secretary Steve Mnuchin interrupting his golf vacation to assure us that he’d made a few calls and can confirm banks are liquid didn’t help either. However, stocks have fallen so far so fast that earnings forecasts would have to swing to negative to bring the ERP back to where it was in October.

Fed chairman Jay Powell’s press conference added to investor angst. Even though the FOMC’s central forecast of two further tightenings of policy in 2019 was down from three previously, his comments gave the impression that rates could go still higher: “Maybe we’ll be raising our estimate of the neutral rate and we’ll just go to that, or maybe we’ll keep our neutral rate here and then go one or two rate increases beyond it.” It was a clumsy communication to a market already worried about growth. The Fed has a dreadful record at forecasting the path of short term rates even though they set the Fed Funds rate (see Bond Investors Agree With the Fed…For Now). They’ve consistently overestimated the long run equilibrium rate, gradually lowering their forecast to meet that of bond investors (as reflected in ten year treasury yields). In spite of Powell’s comments suggesting several more steps higher in rates, current bond yields suggest the market doesn’t believe it’s likely.

The Economist recently published The perils of  trying to time the market. They noted shortcomings in relying on Cyclically-Adjusted Price-Earnings ratio (CAPE), which has wrongly been warning investors to sell stocks ever since it was first published. CAPE simply takes the average P/E over many years, to smooth out economic cycles. As my partner Henry Hoffman notes, because it doesn’t adjust for interest rates it’s of little use. CAPE says stocks are historically expensive, but overlooks that bonds are even more so. That’s what the ERP picks up, that CAPE doesn’t.

Make Your Own Bond 6_94

The attractiveness of stocks versus bonds can be illustrated by calculating what percentage of stocks in a simple stocks/cash barbell portfolio would deliver the same ten year return as bonds. It relies on some key assumptions: that the 1.8% dividend yield on the S&P500 prevails in ten years; that we know the growth rate of dividends, the return on cash, and that tax rates don’t change. Holding all these variables constant, it shows that a very small stock investment beats ten year treasuries. That’s because the yield curve is now so flat that there’s very little benefit to extending maturities. Even the most risk averse fixed income investor can surely tolerate switching out of bonds and putting 6% of the proceeds in stocks. Cash returns of around 2.5% are looking quite reasonable, so why risk longer maturities? That only makes sense if you think the Fed’s next move will be to lower rates.

We’ve also illustrated the same portfolio but using the American Energy Independence Index (AEITR), which holds North America’s biggest pipeline stocks. It yields 6.7% and we expect dividends to grow high single digits in 2019. A mere 2% in AEITR, with 98% in cash, will deliver the equivalent of the ten year note’s 2.8% return, pre-tax.

Stocks (especially an allocation to pipeline stocks) remain a preferable long term investment over bonds. Recent moves in both markets make the case even more compelling today.

English Christmas Pudding

SL Advisors is the sub-advisor to the Catalyst MLP & Infrastructure Fund.  To learn more about the Fund,  please click here.

SL Advisors is also the advisor to an ETF (USAIETF.com).

Pipeline Dividends Are Heading Up

For investors who seek despondent sellers, look no further than energy infrastructure in late 2018. The Alerian MLP Index made its all-time high way back in August 2014. It currently sits 43% lower (including dividends). Barring a strong recovery in the last days of December, returns for three of the past four years are negative. Not coincidentally, MLP distributions are down for their fourth straight year. The Alerian MLP ETF (AMLP) has cut payouts by 34%, with its most recent one last month. Investors don’t want dividend cuts, they want dividend hikes – and in 2019 they will see them.

The shift of MLP Distributable Cash Flow (DCF) from distributions to funding growth projects has been well documented (see Will MLP Distribution Cuts Pay Off?). Growth capex (i.e. where that money went) dipped in 2016 but has been robust since then. Valuations continue to be more reflective of Free Cash Flow (FCF), which is after capex, whereas we think DCF (before capex) is more relevant (see Valuing Pipelines Like Real Estate). But investors are skeptical that cash formerly paid out is being well spent, and resentful of the dozens of cuts. Rising payouts should help.

Pipeline company earnings calls are full of positive reports with optimistic guidance. Business has rarely been this good. In August, Energy Transfer (ET) CEO Kelcy Warren memorably said, “A monkey could make money in this business right now.” (see Running Pipelines is Easy). Business conditions have only improved since then. In November, ET reported another strong quarter, beating Street estimates of EBITDA by 11%. Yet ET’s stock slumped, and is down 33% from its late July “business is easy” level, even though that description seems accurate.

No other metric explains sector performance as well as the path of dividends (or distributions for MLPs).

WMB Quarterly Distributions

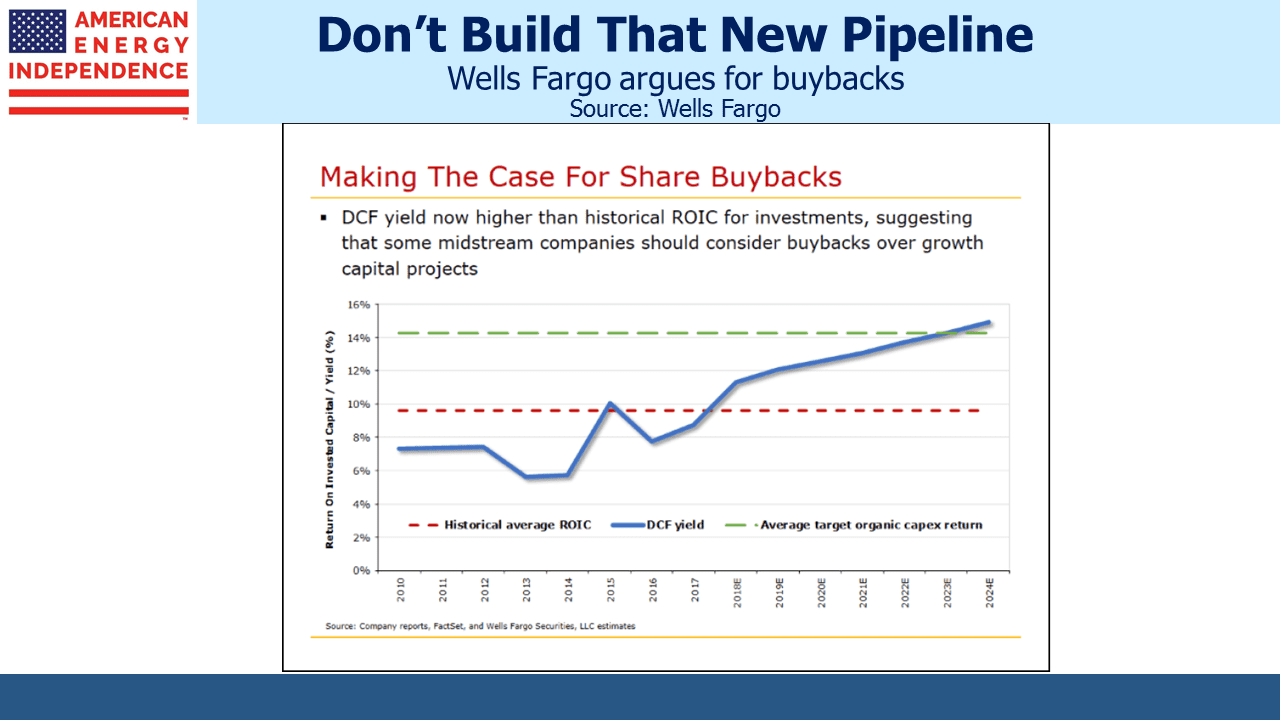
It’s rare for an industry to cut dividends when profits are growing, but that’s exactly what this sector has done. Falling dividends are so often associated with poor operating performance that investors reasonably equate the two – especially yield investors. Pipeline management teams consistently report on terrific business conditions and lament their stock’s low valuation. Part of the reason is that management teams too often invest in new projects rather than buying back stock. Buybacks with DCF yields of 14% and higher must surely be more compelling (and less risky) than all but the most attractive new investments. It’s no wonder investors question their judgement.  Williams Companies (WMB) CEO Alan Armstrong recently said, “I don’t recall a time in my years in executive management when the business has been this healthy but the equity markets so poorly reflecting that.”

While business is booming and valuations are very attractive, Alan Armstrong and others still fail to appreciate (or at least don’t acknowledge) the crushing effect dividend cuts have had on investor appetite for their stocks. No other explanation fits the facts as well. Some blamed crude oil for the 2014-16 collapse, but MLPs only modestly participated in the subsequent crude rally. Recently we read an analysis that attributed stock weakness to rising leverage, but leverage peaked in 2016 at around 5.5X Debt/EBITDA and is comfortably heading lower. We estimate that our portfolio companies’ will exit next year at 4.1X, comfortably within the range that prevailed before the 2014 MLP market peak.

EBITDA vs Leverage

For almost a decade, Williams Partners (WPZ) investors were trained to expect gently rising distributions that came with a tax deferral and a K-1. This happy arrangement was abandoned when Shale Revolution growth opportunities presented themselves. The first cut came when WPZ combined with Access Midstream (ACMP), formerly Chesapeake’s midstream business before it was spun out. WPZ adopted the lower, ACMP payout which resulted in an effective cut for legacy WPZ holders. Two years later, partly due to concerns about leverage, WPZ imposed a second outright cut. The final one came when WPZ was folded into Williams Companies (WMB), in a “simplification”. WMB’s lower payout was applied to WPZ holders, along with a tax bill on recaptured income.

Long-time WPZ investors have endured a 53% cut in their payouts, which are back to the levels of 2006. Having been taught to focus on distributions and ignore market gyrations, they must find Alan Armstrong’s upbeat comments incongruous if not insulting.

Nonetheless, Alan Armstrong is right that business is good. It’s just that he and his peers have so mistreated their investors that his enthusiasm is less infectious than he might like.

A useful perspective on valuations is to compare pipeline companies’ current EV/EBITDA premium to the energy sector versus its long term average. Even by the unloved standards of the energy sector, midstream infrastructure is historically undervalued.

Midstream Stocks Undervalued

The American Energy Independence Index (AEITR) includes North America’s biggest pipeline companies, and is 20% weighted to MLPs. Dividends paid by corporations have been more reliable than MLPs; 2018 dividends on the index are up 7%, following a 3% increase last year. By contrast, dividends on the Alerian MLP and Infrastructure Index, as represented by its index fund AMLP, are down 6% following a 16% drop in 2017. Since MLP payouts are a bigger portion of their available cash flow, they had farther to fall. But the limited investor base (largely U.S. individual investors) has inhibited their flexibility in managing cash.

As a result, many large MLPs have converted to corporations, so an MLP-only view of energy infrastructure (as with the Alerian MLP Index for example), fails to fully represent the sector. Moreover, MLP investors invest for income, which has made them an unreliable source of capital when their income is being cut.

In 2019 we expect AEITR dividends to grow high single digits. MLP distributions should also begin growing for the first time since 2014, although not by as much. Corporations generally offer faster, more reliable growth.

We wish all of our readers a Happy Christmas and holiday season. Enjoy the time with family, and we’ll all look forward to a rebound in 2019.

We are invested in ET and WMB. We are short AMLP.

SL Advisors is the sub-advisor to the Catalyst MLP & Infrastructure Fund.  To learn more about the Fund,  please click here.

SL Advisors is also the advisor to an ETF (USAIETF.com).


Asset Classes: There’s Nowhere to Hide

If you feel like it’s been a tough year in the market, you’re not alone. In 2018, virtually no asset class has provided safety. At -3%, US equities are down less than many other asset classes. Developed market equities have slumped 16%, similar to emerging markets equities (-17%) and energy (-15%). The Trump Administration strategy of using tariffs to alter terms of trade is blamed for growing concerns over global growth. The U.S. economy’s huge domestic market renders it less affected by trade than most others. Nonetheless, lower global growth is having an impact.

No Place to Hide: Asset Classes Down in 2018

In a startling survey, CNBC found that almost half of U.S. corporate CFOs expect a recession to begin within twelve months. 82% expect a recession within two years. One doesn’t normally consider Federal Reserve members wildly optimistic, but in September they revised their 2019 GDP forecast up modestly (from 2.4% to 2.55%). Although they expect a slowdown by 2020, they’re still forecasting around 2%. The Fed is more bullish than corporations.

Bonds have not provided any protection either this year, with returns of -3%. Unusually, about the only asset class to provide positive returns is cash. The last time this happened was 1969.

The recent sharp drop in stocks has led to fund outflows. Last week’s $39 billion pulled from global equity funds was a record, and it was accompanied by $8 billion in withdrawals from investment grade bonds. Asian stock and bond funds are on track for their first year of net outflows since the 2008 financial crisis.

For a while, rising interest rates were felt to be the biggest threat facing the economy. The Fed is still projecting short term rates of around 3.5% next year, but the recent market turmoil has lowered ten year yields back below 3%. Two year yields of around 2.7% show the market thinks rate hikes next year are unlikely.

The Fed continues to unwind its balance sheet.  Beginning with $10B/month in the fourth quarter of last year they’ve increased the pace to $50B/month as quantitative tightening is now in full swing.

That leaves trade tensions as the meaningful source of investor angst. Given how traders react to Presidential tweets suggesting a resolution, a deal with China could provide quite a boost. Although it’s hard to forecast with any confidence, both sides must recognize that they benefit from reduced trade barriers. Given the decision-making freedom afforded both leaders, a compromise could come at any time and be arrived at quite quickly.

Earlier this year, growth concerns were limited to emerging markets, where tariffs and the strong dollar have greater impact. But the S&P500 has fallen 13% since its September all-time high. Although it’s not yet a bear market (defined as down 20%), emerging markets and oil have both passed that threshold.  Within the S&P, more cyclical sectors including financials, materials and energy have also reached that threshold signaling market concern around a slowing economy while the less economically sensitive utilities sector is near its highs for the year.  Although the steady cash flow businesses of midstream MLPs & energy infrastructure companies more closely resemble utilities they have traded with energy stocks.

2019 S&P earnings are expected to grow by 12% according to Factset. Bond yields below 3% scarcely offer much return, and equities continue to look relatively attractive based on the Equity Risk Premium (see Bonds Still Can’t Compete with Stocks). The bearish outlook of corporate CFOs is troubling, but isn’t yet showing up in, for example, lower capital spending. As long as that remains the case, relative valuation will continue to favor equities.


SL Advisors is the sub-advisor to the Catalyst MLP & Infrastructure Fund.  To learn more about the Fund,  please click here.

SL Advisors is also the advisor to an ETF (USAIETF.com).

Buybacks: Why Pipeline Companies Should Invest in Themselves

Weakness in the pipeline sector over the past couple of years has caused soul-searching and changes to corporate structure. Incentive Distribution Rights (IDRs), which syphon off a portion of an MLP’s Distributable Cash Flow (DCF) to the General Partner (GP) running it, have largely gone. Many of the biggest MLPs have abandoned the structure entirely, leaving its narrow set of income-seeking investors to become corporations open to global institutions.

The debate among investors, management and Wall Street about how to unlock value received some useful ideas recently from Wells Fargo. In a presentation titled The Midstream Conundrum…And Ideas For How To Fix It, they make a persuasive case that stock buybacks offer a more attractive use of investment capital than new projects.

This would be a significant shift for MLPs. As recently as five years ago, they paid out 90% or more of their DCF to unitholders and GP (if they had one). The Shale Revolution was only beginning to demand substantial new infrastructure, so they had little else to do with their cash. New projects were funded by borrowing and by issuing equity through secondary offerings.

Shale plays were in regions, such as the Bakken in North Dakota and the Marcellus in Pennsylvania/Ohio, inadequately serviced by pipelines. This broke the model, because the amounts of investment capital required grew substantially. The capital markets loop of paying generous distributions while simultaneously retrieving much of the cash through new debt and equity was no longer sustainable. Dozens of distribution cuts and lower leverage followed, leading to projects being internally financed. This is the new gold standard for the sector – reliance on external capital to fund growth is out.

Wells Fargo takes this logic a step further, asking why excess cash always needs to be reinvested back in the business rather than returned to investors via buybacks. In spite of professed financial discipline, midstream management teams invariably find new things to build, all expected to be accretive (i.e. return more than their cost of capital). Pipeline companies are not alone – the entire energy sector has been dragged by investors to prioritize cash returns over growth. But MLPs rarely buy back stock. Free of a corporate tax liability, MLP distributions aren’t subject to the double taxation of corporate dividends, so raising payouts is a simple way to return cash.

The Midstream Story over the past several years has largely been about financing growth projects. Investor payouts were sacrificed, but rarely did a company admit that its internal cost of capital was too high to justify a new initiative. Wells Fargo is challenging management teams to regard buying back their own stock as a more attractive use of capital than building or acquiring new assets. This is capital management 101 for most industries, but unfamiliar terrain for pipeline stocks. Growth is embedded in the culture. The original justification for the GP/MLP structure with IDRs was to incent management to grow the business. CEOs in other industries find the motivation without such complexity.

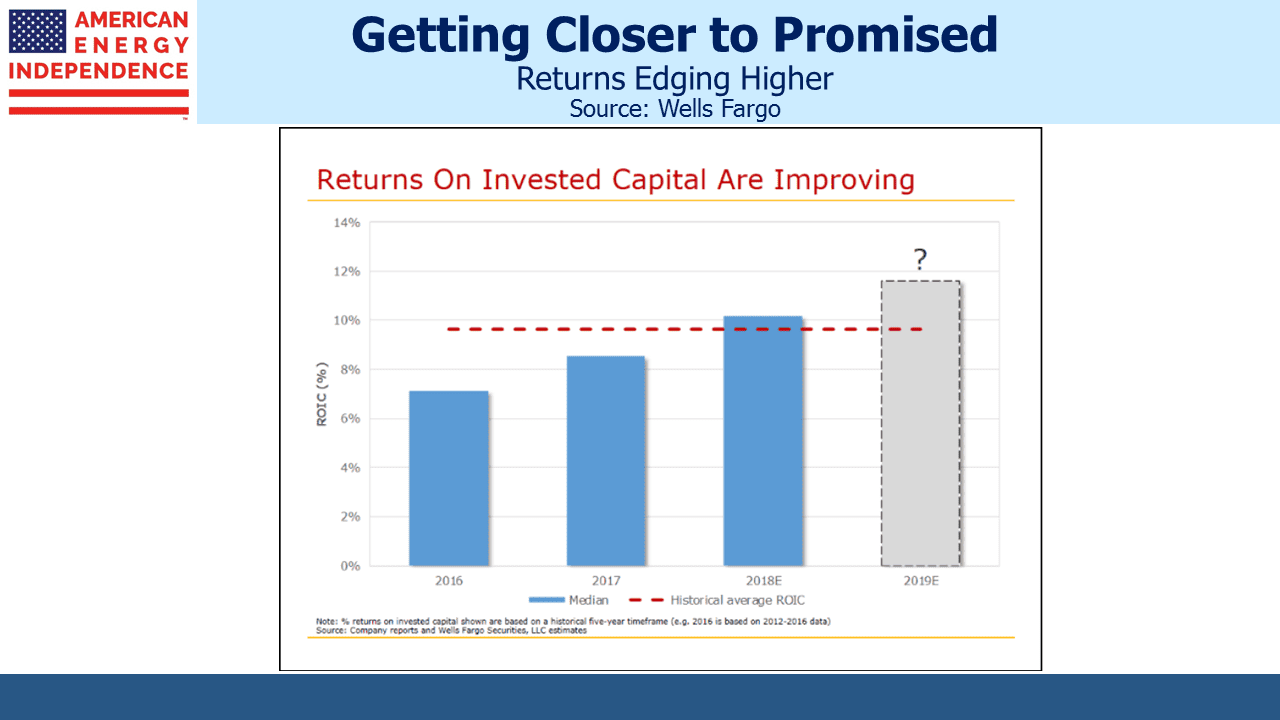
In October, virtually every 3Q18 earnings call included an optimistic outlook from management, usually coupled with disbelief at the continued undervaluation of their stock. Attractive valuations mean a high internal cost of capital. Valued by DCF, or Free Cash Flow (FCF) before growth capex, midstream yields are in some cases higher than many companies’ stated Return on Invested Capital (ROIC) targets. Moreover, historic ROIC for the industry has often turned out lower than promised, although it has been improving.

Energy Transfer’s (ET) 16% DCF yield almost certainly offers a higher return than all but their best projects, and suggests they should be repurchasing stock. SemGroup’s (SEMG) DCF is 20%, twice the industry’s historic ROIC.

Growth caused the past four  years’ upheaval, and today’s low valuations are the result. Capital discipline has been less present than CEOs often claim, which is why they’ve apparently responded coolly to Wells Fargo’s buyback recommendation.

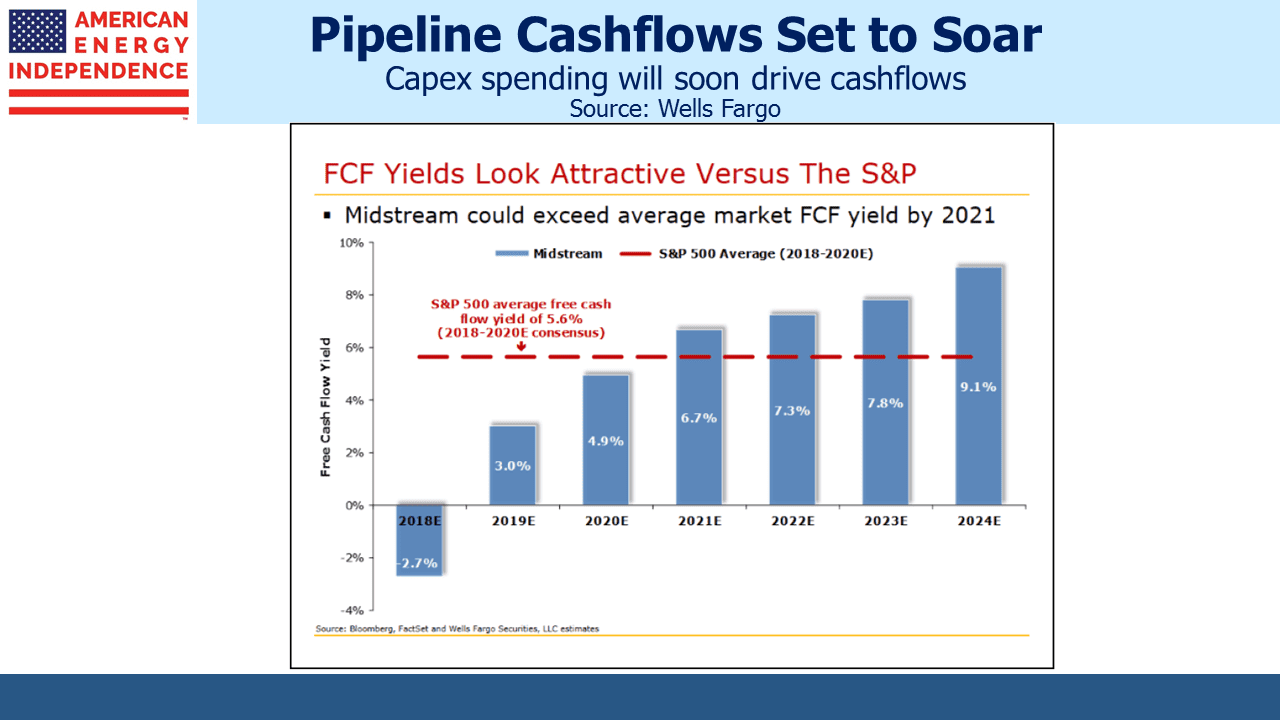
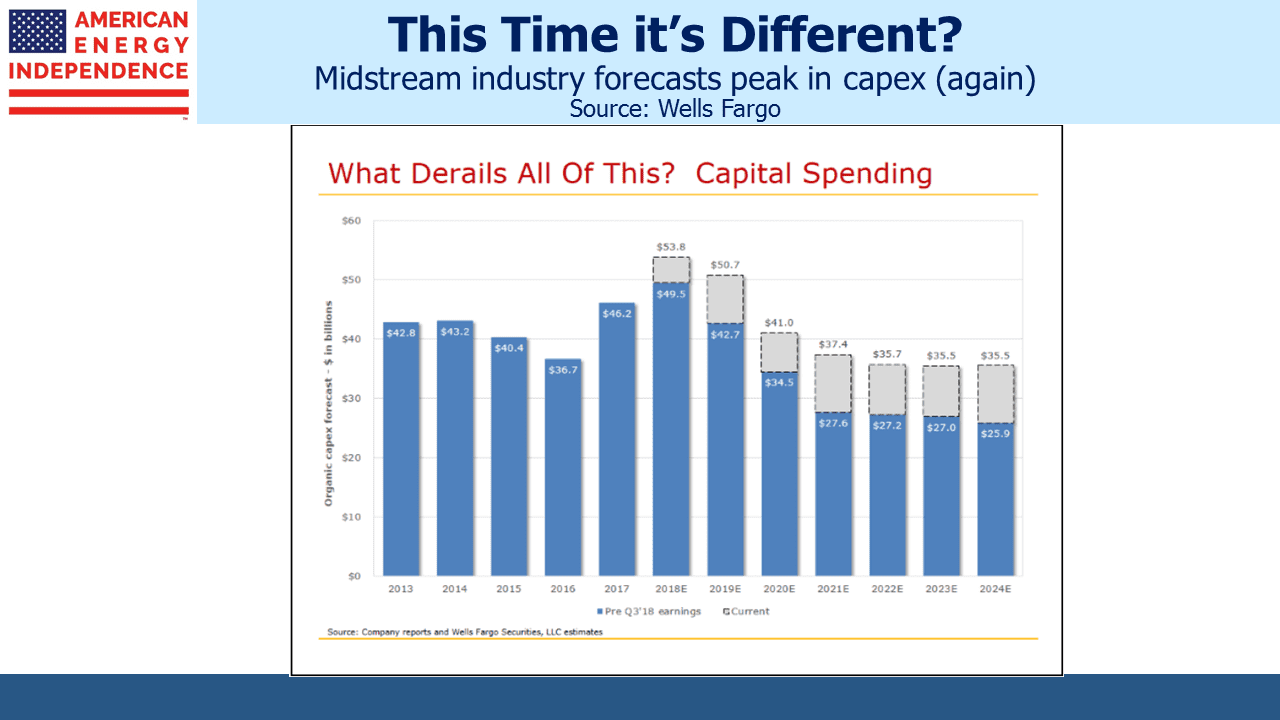
DCF yields of 10-14%  or more (as with ET’s 16%) are dramatically higher than FCF yields of 3%, because DCF measures cash generated before funding for growth projects while FCF is after.  FCF yields are set to rise sharply over the next few years, but this crucially relies on new investment coming down. The industry has a habit of showing that peak spending on new projects is imminent, only to push that back another year. 3Q earnings calls saw 2019 estimated capex creep up by almost 20%.

Midstream Industry Forecasts Peak in CAPEX

2018 is the fourth year of distribution cuts for MLPs, as reflected in the Alerian MLP ETF (AMLP). Corporations have fared better, and next year we expect dividends on the American Energy Independence Index to grow by 8-9%. If midstream companies are as financially disciplined as they claim, they’ll follow the advice from Wells Fargo in evaluating stock buybacks alongside new investments under consideration. It would complete their metamorphosis into more conventional companies.


We are invested in ET and SEMG.

We are short AMLP.

SL Advisors is the sub-advisor to the Catalyst MLP & Infrastructure Fund.  To learn more about the Fund,  please click here.

SL Advisors is also the advisor to an ETF (USAIETF.com).

Leaderless Britain Stumbles Towards Brexit

Although it’s 36 years since I last lived in England, I retain a deep affection for the country where I grew up, as well as my English accent (so say my American friends, anyway). I’m often asked my opinion of Brexit – I have British friends on both sides of the Leave/Remain divide. While I would have voted to stay in the EU, I can understand the opposite view, even while Leavers willfully ignore the strong economic arguments against their position.

Few Americans would accept the loss of sovereignty required by EU membership. Freedom of movement means in theory all 440 million EU citizens not living in the UK could move there without the government being empowered to stop them. It’s not the only issue, but the biggest. Regulations imposed by Eurocrats in Brussels cover mind-numbingly trivial standards for goods and services, all in the interests of creating a seamless market. Many of them are easily criticized and sometimes stupid. Nonetheless, the EU remains in Britain’s interest, in spite of these substantial drawbacks.

A thoughtful essay in the Wall Street Journal (The Great Brexit Breakdown) insightfully noted that “You can have national sovereignty—and that’s fine. Or you can have economic integration—and that’s fine. But you can’t have both.” America has always been the EU’s vision. Its enormous domestic market and free movement of people are fully integrated, which partly explain faster productivity growth. Texans have no sovereignty (though some in the Lone Star state will disagree). But Europe is older and far more tribal. Texans share more values with New Yorkers than the English do with neighboring France. For an island nation, centuries of repelling European invaders isn’t easily replaced with passive acceptance of rule from “the Continent” (how the British refer to the rest of Europe).

Since Britain voted by 52%-48% to leave the EU in the ill-considered June 2016 referendum, negotiations have plodded forward in a predictable, crisis-free fashion. The UK is not alone of course in drifting towards regional political affiliations. As with the U.S., voting patterns were strongly linked to demographics, income and education. London and other major cities voted overwhelmingly to Remain, embracing Europe because of their ethnic diversity. Rural, older voters wanted to Leave. The more white your neighborhood, the less you liked Romanians arriving in your country, even if you rarely encountered them. It was also Old versus Young; those with less life ahead of them imposed their desire for yesterday’s Britain on others with decades still ahead.

Brexit has already been a most awful own goal. Conservative PM David Cameron called the referendum expecting to win handily, thereby ending a corrosive debate within his own party. His subsequent resignation ushered in Theresa May, who had campaigned for Remain like most MPs. Echoing her predecessor’s poor judgment, she gambled on an early election to increase her parliamentary majority, and lost it completely. Her government is propped up by the votes of a small Northern Irish party whose allegiance was bought with higher government spending in their region.

Theresa May has conceded on the major points, as was inevitable to anyone who considered the two sides’ relative negotiating strengths. The result was that the Brexit deal she negotiated with Brussels united both camps in opposition. Facing overwhelming parliamentary defeat, she cancelled a vote she would have lost heavily. Britain has almost no high cards to play, while the EU can’t tolerate a departing member skipping happily into the sunset. Although it’s hard to imagine how anyone could have made a success of negotiating Brexit, she has failed to reach even low expectations.

If Brexit happens (still not certain), it will be on EU terms. The EU rarely makes crucial decisions without the clock ticking down to midnight. Politically, the March 29th deadline (when Brexit is scheduled to happen) remains a long way off. A wide range of outcomes is still possible, including an early election, a second referendum, reopening negotiations with the EU and even no Brexit.

Few in Britain will care to consider how a Trumpian PM would have handled the issues, but they would not be facing today’s unattractive options. PM Trump would have responded to domestic concern over free movement of people attracting too many east Europeans by imposing a unilateral halt. Disliked EU court rulings would have been ignored. It would have caused a different type of crisis than the current one, but the British would have known someone was in their corner, fighting for them. Instead, Leavers promised what was undeliverable. Theresa May has clung to power at the expense of her principles, while passively negotiating Britain onto a path of permanently weaker growth. The country of my youth has been poorly led. It’s a terrible shame.


Environmental Activists Raise Values on Existing Pipelines

Canada’s struggles to get its crude oil to market have been a source of immense frustration if you’re an Albertan oil producer, or a huge success if you’re an anti-fossil fuels activist. Last week, Alberta’s premier Rachel Notley imposed almost a 9% cut in production in order to raise prices. Shortage of available infrastructure had opened up a price discount as wide as $50 per barrel between the bitumen-based Western Canadian Sedimentary Basin, and the WTI benchmark. Unusually, it led to Canadian producers asking the government to intervene.

The heavy, viscous crude from Canada’s oil-sands is reviled by activists because its extraction is particularly disruptive to the local environment, as well as requiring substantial energy inputs to heat it. The Obama Administration repeatedly held up the Keystone XL expansion because of its view that this type of crude should remain in the ground. Alberta has been frustrated at every turn in obtaining cost-effective transport for its output. Earlier this year, Kinder Morgan (KMI) gave up on their Trans Mountain Expansion, intended to increase pipeline capacity west to British Columbia’s Pacific coast. Navigating inter-provincial politics threatened to derail the project, and KMI managed to unload it on the Canadian Federal government not long before an adverse court ruling added further delays (see Canada’s Failing Energy Strategy).

Canada has unique challenges, revealing the weak hand their Federal government has in dealing with its sometimes unruly provinces. But pipeline construction has been hampered in the U.S. too. Energy Transfer’s (ET) Dakota Access Pipeline (DAPL) was delayed by Obama because of concerns over its proximity to land held sacred by some native American tribes (others were supportive, generally depending on the likelihood of financial gain through the use of their land). Shortly after his inauguration Trump allowed DAPL to move forward. But ET has at times run afoul of regulators during construction, drawing hundreds of violations during the construction of two natural gas pipelines. The industry needs ET to do better.

Shortages of infrastructure in west Texas have led to flaring of natural gas as well as impeding the growth of crude production. The completion of new pipelines by late 2019 should help. The Energy Information Administration expects Permian output to grow by 600 thousand barrels per day next year, to 3.9 Million Barrels per Day (MMB/D). The new pipeline takeaway capacity could enable it to reach 5 MMB/D by 2020, bringing U.S. output close to 13 MMB/D.

New England suffers from too little investment in natural gas infrastructure, with the result that during cold winter months they import liquefied natural gas from Trinidad and Tobago (see An Expensive, Greenish Strategy).

In many parts of the country (apart from Texas and Louisiana), energy infrastructure is becoming steadily harder to build. The losers clearly include consumers, such as those in the north east who have to pay more for electricity. In Canada, clearly oil producers suffer from the steep discount on their production. But less growth in infrastructure increases the value of what currently exists. Because Permian crude can’t all get to its desired destination (usually Cushing, OK or Houston for refining/export) by pipeline, the price differential has at times exceeded $15 per barrel. Regional differentials can support pipeline profits, since when they exceed pipeline tariffs it reflects high demand. Plains All American (PAGP) has been able to charge higher prices on parts of its crude oil pipeline network in Texas for just this reason.

New pipelines enjoy network effects. Connecting a new pipeline to an existing network adds value by increasing destination choices for shippers. This has always represented a hurdle for new entrants to surmount. But the increasing role of judicial challenges by environmental activists serves to further entrench existing operators. The pipeline business is one in which companies needn’t worry too much about a disruptive new upstart taking market share. As a result, today’s big energy infrastructure companies are highly likely to be dominant for many years to come. If new pipelines are harder to build, existing pipelines must be correspondingly more valuable. An unintended consequence of pipeline opposition is to develop a pipeline oligopoly.

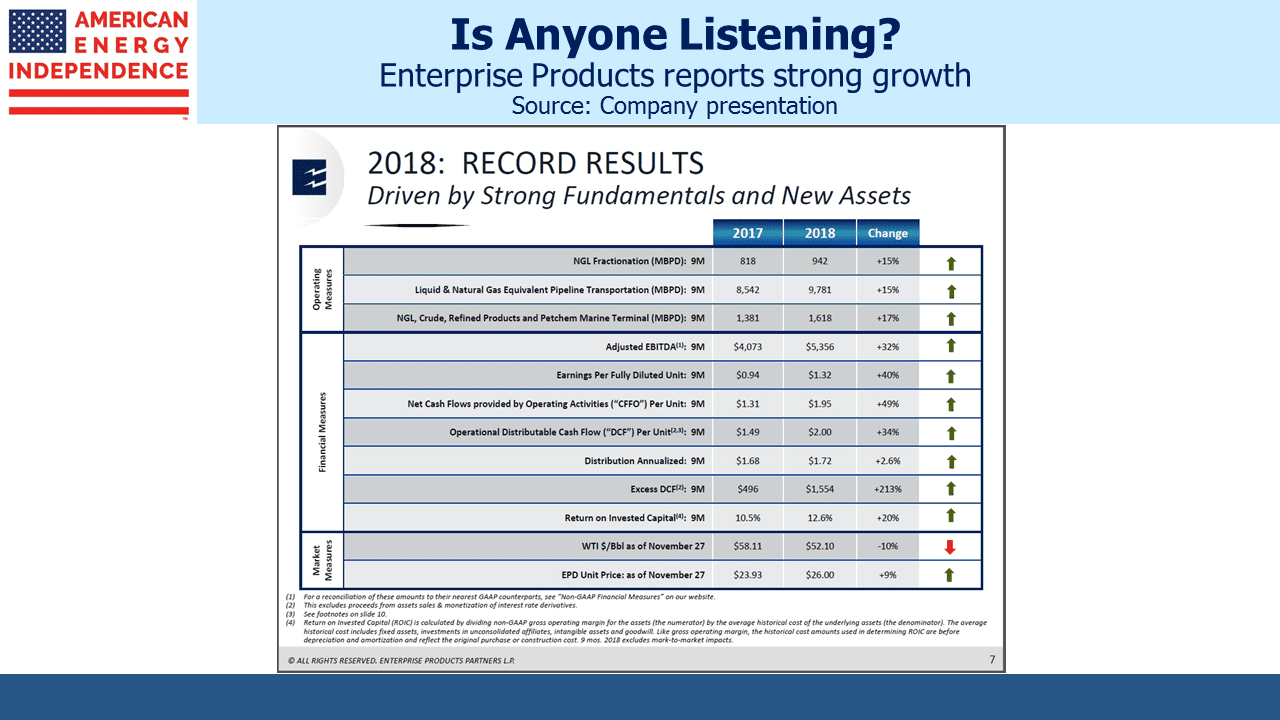
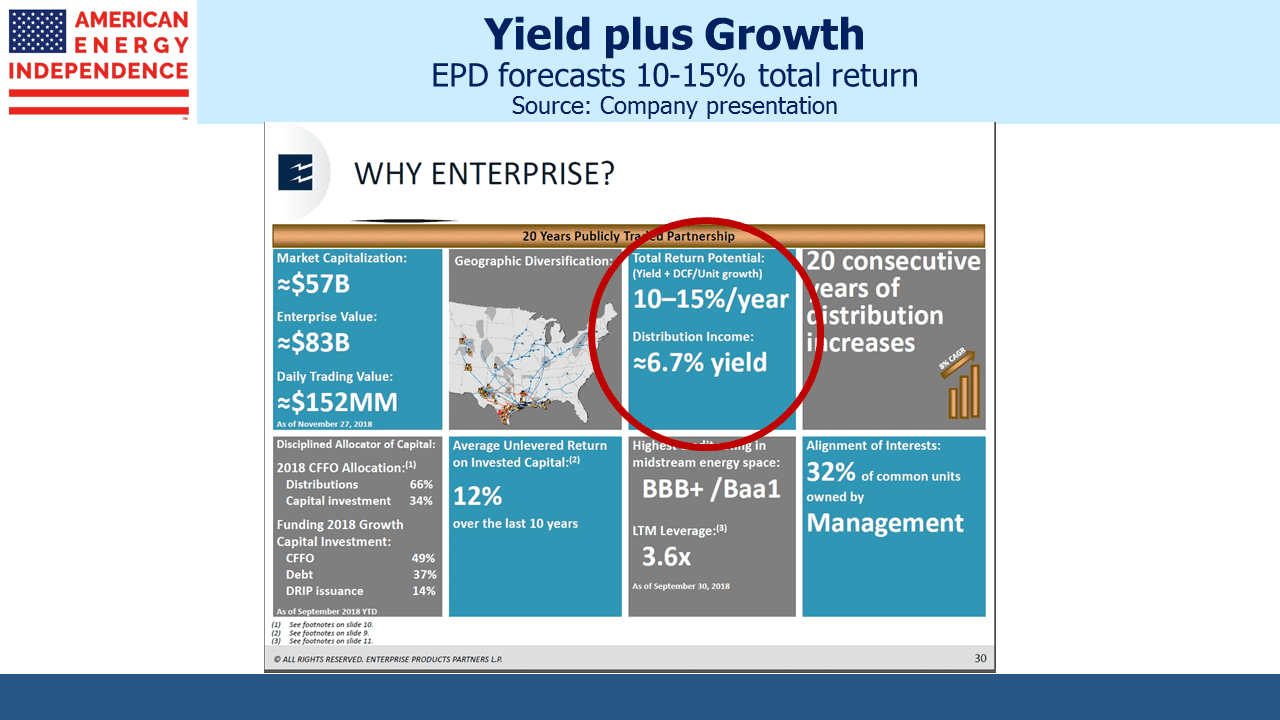
Last week Enterprise Products Partners (EPD) gave a presentation at a Wells Fargo conference which emphasized corporate (rather than MLP) measures of performance. By referencing more familiar terms, such as Cash Flow From Operations, rather than the MLP-oriented Distributable Cash Flow, they hope to draw more generalist investors to consider valuations, even while EPD has no plans to convert from an MLP to a corporation. We think it’s a good move – we recently highlighted EPD’s value using discounted cash flows (see Valuing MLPs Privately — Enterprise Products Partners). We also compared pipelines with buildings (see Valuing Pipelines Like Real Estate). A consistent theme from management teams is the disconnect between the strong fundamentals of their businesses and weak stock prices.

Retail sentiment remains poor. Our friend John Cole Scott of Closed End Fund Advisors notes that discounts to NAV on MLP closed end funds are at 8%, more than twice the three year average and 10% wider than the best levels of last spring.

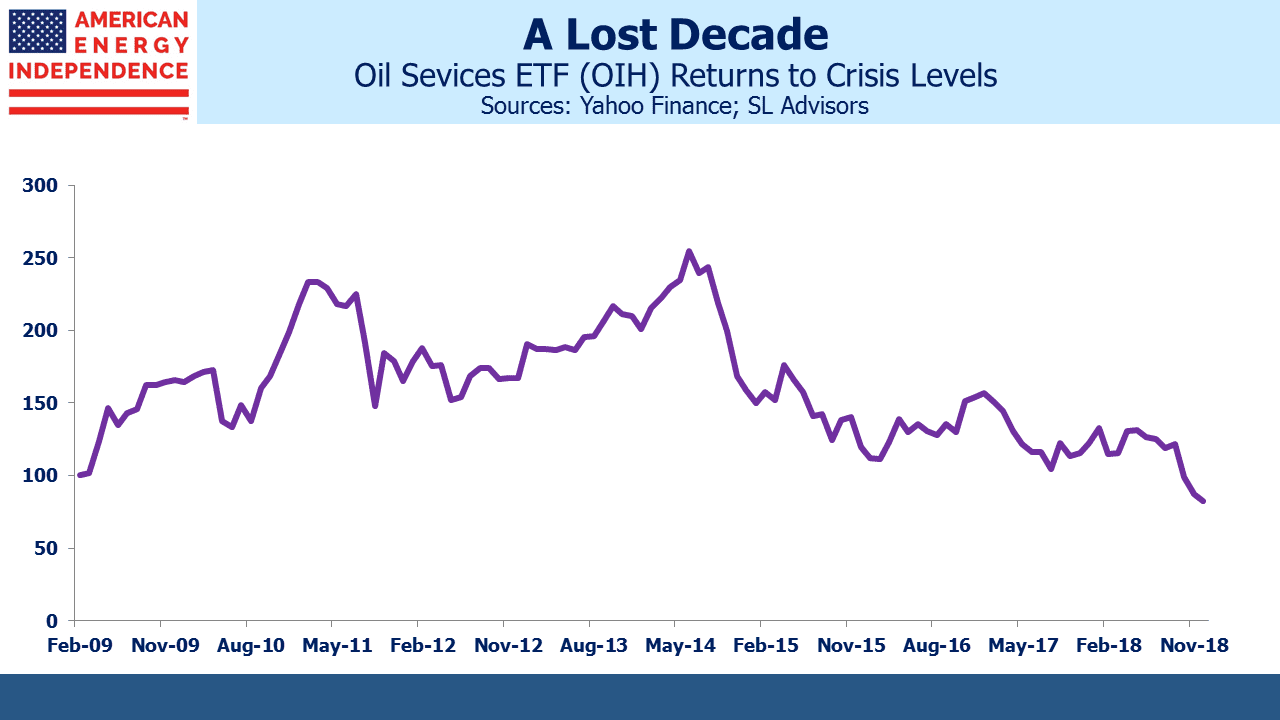
In the Britcom Fawlty Towers, the manic hotel manager Basil Fawlty (played by Monty Python’s John Cleese) is told during one crisis, “…to remember there’s always somebody worse off than yourself.” To which he replies, “Well I’d like to meet him, I could do with a laugh.” (see here at the 1:25 mark).

In that vein, pipeline investors who nowadays believe they’re in the world’s least loved sector should spare a thought for energy services, which have recently exceeded the lows of the 2008-09 financial crisis.

For energy infrastructure investors, we think rising dividends will finally put to rest the concern over serial cuts in payouts.  The American Energy Independence Index contains North America’s biggest pipeline companies, which are mostly corporations but include a few MLPs. It yields 6.25%, and we expect 7-8% dividend growth next year.

We are invested in EPD, ET, KMI and PAGP

SL Advisors is the sub-advisor to the Catalyst MLP & Infrastructure Fund.  To learn more about the Fund,  please click here.

SL Advisors is also the advisor to an ETF (USAIETF.com).

Steel Tariffs Show Up in Surprising Places

The G20 meeting on the weekend produced a mildly surprising rapprochement between the U.S. and China on trade. Most commentators regard the Administration’s serial imposition of tariffs negatively. Stocks certainly liked the possibility of a lower temperature around this rhetoric.

In spite of the U.S.’s many trade disputes, the economy shows little sign of suffering. Unemployment is 3.7% and interest rates remain supportive, with ten year treasury yields at 3% offering scant competition for equities (see Bonds Still Can’t Compete With Stocks). Consensus expectations are that next year S&P500 earnings will increase by 10%.

Nonetheless, tariffs do have an impact. Steel shipments have been a controversial topic, with many developed countries accusing China of selling below cost (“dumping”). The Administration has imposed tariffs on steel imports from a wide range of countries, on the grounds of national security. Commerce Security Wilbur Ross said, “Economic security is military security. And without economic security, you can’t have military security,”

Tariffs have their effect in subtle ways. They are a form of sales tax, and taxes are borne both by the producer and the customer in proportions determined by their relative elasticities. For example, if a buyer of a product now subject to tariffs had no alternatives available and had to have the product, the price would go up by the amount of the tariff. The more choices a buyer has, the less impact the tariff has on the product’s price, meaning more is absorbed by the producer.

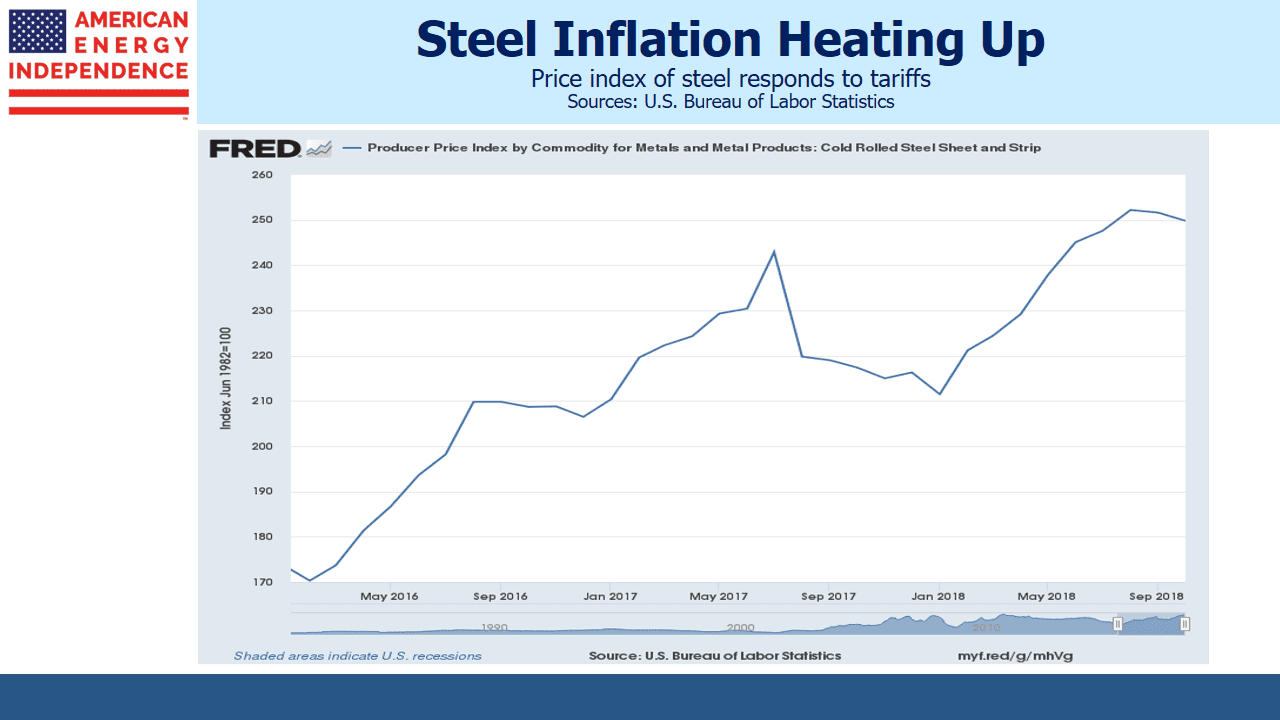
The Federal Reserve Bank of St. Louis shows that steel prices have risen by around 17% since the 2016 election, the point at which steel buyers and sellers might have begun to contemplate tariffs. The tariffs ultimately implemented were 25%, which suggests that buyers have borne more of the cost than producers. Domestic producers were able to raise prices protected by tariffs. Since the 17% increase relates to all steel whereas the tariffs were only imposed on imports, producers benefitted further at the expense of buyers. The Bureau of Labor Statistics forecast that steel prices would rise by 21%, so further price hikes may be ahead.

Steel Inflation

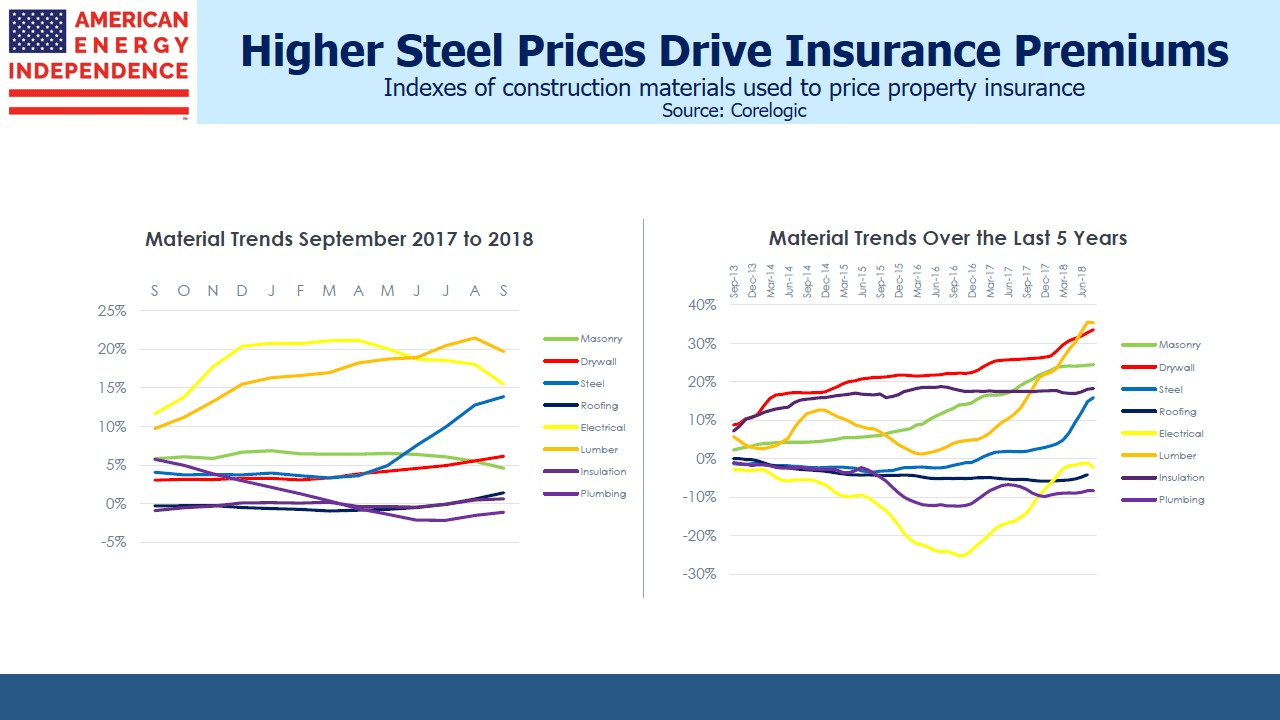
Few of us buy steel directly so the impact appears inconsequential. A recent report by CoreLogic, who advise the insurance industry on construction costs, showed steel prices rising at 14% year-on-year. Property and casualty companies will factor this in to the cost of insurance coverage for buildings that use steel – excluding one-to-four family houses, most other structures require it. So apartment dwellers and office building owners will see an incremental cost increase through insurance premiums higher than they would otherwise be.

Steel Prices Drive Insurance Premiums Higher

Another example relates to energy infrastructure. Plains All American (PAGP) was inadvertently caught up in the tariffs because of specialty steel they had ordered from Greece to complete their Cactus II crude oil pipeline. In effect it was a retroactive tariff, because they’d placed the order long before the imposed tariffs resulted in a $40MM charge. Their appeal for a waiver was denied.

Capacity on the pipeline was fully committed by February, before the tariffs were formally announced.  The increased cost of the pipeline will be borne by shippers, to the extent contracts allow the tariff to be passed on, and the excess by PAGP stockholders.

In both cases the tariffs represent a redistribution of income, from customers to the Federal government (which is why it’s a tax) and to domestic steel producers through higher prices. The effects are both subtle and numerous, as these examples show. The Administration has defended tariffs as a short-term, negotiating tool and not part of a long-term strategy. Whatever the merits of tariffs on domestic politics, equity markets clearly look forward to the time when the goals of tariffs have been achieved.

We are invested in PAGP.

SL Advisors is the sub-advisor to the Catalyst MLP & Infrastructure Fund.  To learn more about the Fund,  please click here.

SL Advisors is also the advisor to an ETF (USAIETF.com).

MLPs Lose That Christmas Spirit

Around this time of the year we typically write about MLP seasonals. That’s because the “January effect” has been an enduring pattern of investor activity, far more pronounced than in the broader equity market. Prices would reliably dip in November before firming in December and shooting higher in January. This was due to the combination of income-seeking individual investors with K-1s. Because of the additional tax preparation costs, if you’re planning to sell an MLP in January, you might as well act in December and avoid one more K-1. Similarly, a December purchase delayed until January also avoids a K-1.

MLPs Exhibit Seasonal Pattern

Quite possibly, the natural inclination to take stock of life, including investments, around the holiday season resulted in a decision to allocate cash to MLPs. Two years ago, in Give Your Loved One an MLP This Holiday Season, we noted the historic pattern and why purchasing MLPs in early December had worked so consistently.

Although the year-end pattern was most pronounced, there’s also an intra-quarter one. MLP investors love their income. Distributions tend to be declared in the first month of the quarter, payable a few weeks later. Sellers tend to hang on long enough to be a holder of record for the quarter, creating the Jan/Apr/Jul/Oct cycle of positive months.

Much has changed over the past five years. MLPs can no longer be relied upon for steady income. The Alerian MLP ETF (AMLP) recently cut its distribution again, resulting in a 34% cumulative reduction since 2014. Not only did some MLPs with high yields cut their dividends outright to fund growth projects and reduce leverage, but many were purchased by their much lower yielding parent companies, providing “backdoor” distribution cuts to MLP. The consequent betrayal of income-seeking investors has had many casualties, including still-depressed sentiment oblivious to attractive valuations.

Another change has been the breakdown of the seasonal pattern. Having been mistreated, income-seeking investors no longer act so predictably. Over the past five years the January effect has completely gone. So has the quarterly pattern – years ago, when the sector was stable and fairly unexciting, holding your investment a few more weeks so as to get that extra distribution wasn’t inordinately risky. MLP investors have learned to appreciate risk differently, and it’s clear that the calendar bears very little on the timing of today’s buyers and sellers. What’s striking about the past five years is both the randomness of the monthly returns, as well as that the average month is -0.3%. From 1996-2013 it was +1%.

MLP Seasonal Pattern Has Gone

The loss of the seasonal pattern is further evidence that the traditional investor, with her predictable habits developed over years of happy results, has left. It’s why the sector is cheap, because the former buyers have fallen out of love. Thus spurned, large MLPs have converted to corporations in search of new suitors, such that less than half of U.S. midstream infrastructure now retains the MLP format. Many believe the MLP model is irretrievably broken.

Eventually, and possibly quite soon, rising dividends will draw in a new set of buyers. They’ll buy corporations that were formerly MLPs, as well as some of the remaining MLPs. They’ll rely on discounted cash flow analysis (see Valuing MLPs Privately — Enterprise Products Partners). They’ll look beyond the betrayals (see Kinder Morgan: Still Paying for Broken Promises). They’ll find a sector with 11% free cash flow yields before financing new projects, and dividend yields of 6%+ growing at 10% (our 2019 forecast for the American Energy Independence Index).

We are long EPD and KMI. We are short AMLP.

SL Advisors is the sub-advisor to the Catalyst MLP & Infrastructure Fund.  To learn more about the Fund,  please click here.

SL Advisors is also the advisor to an ETF (USAIETF.com).

Lower Volatility Stocks Gain Favor

Low volatility is outperforming. In a rising market, taking more risk usually pays off. The recent reversal has investors seeking tangible value.

Nothing exemplifies intangible value, or more accurately ephemeral value, better than Bitcoin. The great Risk On trade began the day of Trump’s election victory, when an overnight market swoon quickly reversed. Bitcoin buyers embraced the new mood more exuberantly than most, running the price briefly as high as $20,000 by last December, from $730 at the time of the election.

Bitcoin Bubble Bursts

As a currency, Bitcoin has spectacularly failed the “store of value” test. Its proponents assert that freedom from government oversight ensures its value cannot be manipulated for political purposes. It’s similar to the argument made by gold investors, although fiat money (what followed when Nixon suspended convertibility of the US$ into gold in 1971) has done pretty well. Bitcoin is a solution in search of a problem. Among the many risks that Bitcoin investors face is that their exchange is hacked, with scant protection from the governments whose protections they skirt.

Bitcoin has now lost 80% of its peak December 2017 value. Wherever speculators take it from here, the case for a new currency free of government control and protected by no-one is lost.

By contrast, low volatility stocks, possessed of more tangible value than Bitcoin, are enjoying a resurgence. The rapid exit from momentum that Bitcoin previewed a year ago is rippling across equity markets (see FANG Goes Bang). The beneficiaries include consumer staples, such as Clorox (CLX), Kimberly-Clark (KMB), McCormick (MKC) and Procter & Gamble (PG). The sector was boring when CNBC was debating the relative merits of FANG stocks Facebook (FB), Amazon (AMZN), Netflix (NFLX), and Google (GOOG), but earnings stability can be attractive too.  The S&P Consumer Staples Index has a beta of 0.69 and dividend yield of 2.75%, whereas the FANG stocks have an average beta of 1.47 and pay no dividends.

Low Vol Stocks vs SP 500

The Low Beta Anomaly examines a weakness in the Capital Asset Pricing Model (CAPM), a widely used framework for valuing securities. It relies on the sensible premise that more risky investments should generate a higher return. History shows this isn’t true, and numerous academic papers offer reasons why. A compelling explanation is that active equity managers, paid to beat the market, are drawn to stocks that move more than the market (“high beta”). New clients are most easily found when the averages are rising, and relative outperformance helps. The result is that in aggregate, investors pay more than a CAPM-derived price for high beta, lowering the subsequent return on such stocks and correspondingly driving up the return on less-sought low beta names.

It’s Wall Street’s version of the tortoise and the hare. Consumer staples stocks are solidly in the low beta, or low volatility category. As the post-2016 election endorphins subside (admittedly, it’s taken a long time), less risky stocks look better. After lagging for much of the year, low volatility has caught up with the S&P500 (which is burdened with a healthy number of high beta names). The new darling sector is the one that grows slowly, albeit reliably. It’s the antidote to Bitcoin and FANG-fueled excitement.

Our portfolio of low volatility stocks has a beta of 0.49 and a dividend yield of 3.2%. Most of the names have decades of consecutive annual dividend increases. Although its yield is half that of energy infrastructure (the American Energy Independence Index has a dividend yield of 6.3%), the absence of high volatility is drawing more buyers.

We are invested in CLX, KMB, MKC and PG

SL Advisors is the sub-advisor to the Catalyst MLP & Infrastructure Fund.  To learn more about the Fund,  please click here.

SL Advisors is also the advisor to an ETF (USAIETF.com).

image_pdfimage_print