Energy Transfer’s Distribution Management

SL Advisors Talks Markets
Energy Transfer’s Distribution Management
Loading
/

Last week Energy Transfer (ET) raised their quarterly distribution to $0.305, restoring it to a level last paid in July 2020. This cheered a great many people. Among the financial advisors we talk to it is the most widely held individual name. It is perennially cheap. JPMorgan, Morgan Stanley and (according to Refinitiv) 94% of sell side analysts list ET as Overweight.

Following the distribution hike, up 75% year-on-year, ET yields 9.1%. It remains the cheapest big MLP with a 2023 Distributable Cash Flow (DCF) yield of 18%. Under the old MLP standard that prevailed prior to the shale investment bust, 90% of DCF was commonly paid in distributions. Following the hike, their payout ratio is a parsimonious 50%. Like a great performer, ET leaves its audience hoping for more.

Co-CEOs Marshall McCrea and Tom Long retain the deft touch of former CEO (now Executive chairman) Kelcy Warren. ET executes well but always prioritizes management’s interests. Search results on our blog reveal they’re mentioned in 141 separate posts. Enbridge is 54.

In 2016 Energy Transfer Equity (ETE), the entity that ultimately became ET, issued a lucrative class of convertible preferred securities to insiders on the management team (see Is Energy Transfer Quietly Fleecing its Investors?). These securities allowed reinvestment of preferred dividends at $6.56 even if the prevailing unit prices was higher which it always was. This attractive feature was denied to other investors which led to a class action lawsuit. We wondered aloud, Will Energy Transfer Act with Integrity? ET answered by arguing that their maneuver had allowed them to preserve their distribution, winning the case.

ETE was once the General Partner (GP) of MLPs Sunoco Logistics, Energy Transfer Partners and Regency Partners. Through a series of mergers culminating with being absorbed by ETE in 2018, all these LP unitholders endured substantial distribution cuts while ETE’s was preserved (see Energy Transfer: Cutting Your Payout, Not Mine). Management’s investment in Energy Transfer was overwhelmingly in the GP, ETE. We made our investment there to assure the best possible alignment of interests. Notwithstanding the legal case argued in Delaware Chancery by ETE in defense of its indefensible preferreds, many investors in the Energy Transfer family have endured payout cuts.

ET, the surviving entity having absorbed all its MLPs, cut its distribution in late 2020. Investor skepticism about the payout had driven the yield to 18%. Covid-led demand destruction, albeit brief, didn’t help. With no reward in the stock price for such largesse and facing rating agency pressure because of its 5X Debt:EBITDA leverage, the company decided it had better uses for available cash than paying ungrateful unitholders (see Why Energy Transfer Cut Their Distribution). This 50% cut meant long-time investors in Sunoco Logistics, Energy Transfer Partners and Regency Partners had endured cuts of 66%, 72% and 76% respectively since being combined with the parent.

Following last week’s distribution hike ET still trades at a meaningful discount to other large MLPs Enterprise Products Partners (EPD) and Magellan Midstream (MMP). We retain a full position for this reason, but always with a self-protective wariness. ET’s history does not induce the comfort of straight dealing that, say, Jim Teague of EPD provides to their investors.

In 2019 Blackstone acquired the 56% of Tallgrass Energy it didn’t already own via a transaction that paid a substantial premium for management’s units versus the lower one paid to everyone else (see Blackstone and Tallgrass Further Discredit the MLP Model). Perhaps ET’s $41BN market cap makes it too big for such a coup. But you know that if they could do it, they would.

ET’s diverse and well positioned midstream assets, which are largely supported with fee-based contracts offer attractive upside. Their Lake Charles LNG project will add exposure to growing global demand for US natural gas.

LNG import terminals allow for diverse sources. As Germany has learned, if your energy comes via a pipeline you’re locked into a long-term relationship with the supplier. European LNG demand is growing but Asia remains the biggest market. The Philippines expects to increase imports as their Malampaya gas field in the South China Sea winds down. The government just approved construction of a seventh import facility.

The slide in US natural gas prices is due to our mild winter. The Freeport LNG export unit is coming back on line, which will create some additional demand. Cheap US gas will stimulate additional demand for US exports, which will eventually support domestic prices. Curbing US households’ use of gas stoves never looked like a serious proposition, but in any event will not alter the growth in long-term demand.

We have three funds that seek to profit from this environment:

Energy Mutual Fund Energy ETF Real Assets Fund


Behind Soft Natural Gas Prices

SL Advisors Talks Markets
Behind Soft Natural Gas Prices
Loading
/

Most of the commodity questions we get relate to crude oil, since its price reflects energy investor sentiment and can move midstream prices. When oil and pipelines are down, people want to know why the volume dependency of midstream cashflows isn’t visible in stock price performance. The correlation between the two is unstable (see Energy’s Asynchronous Marriage).

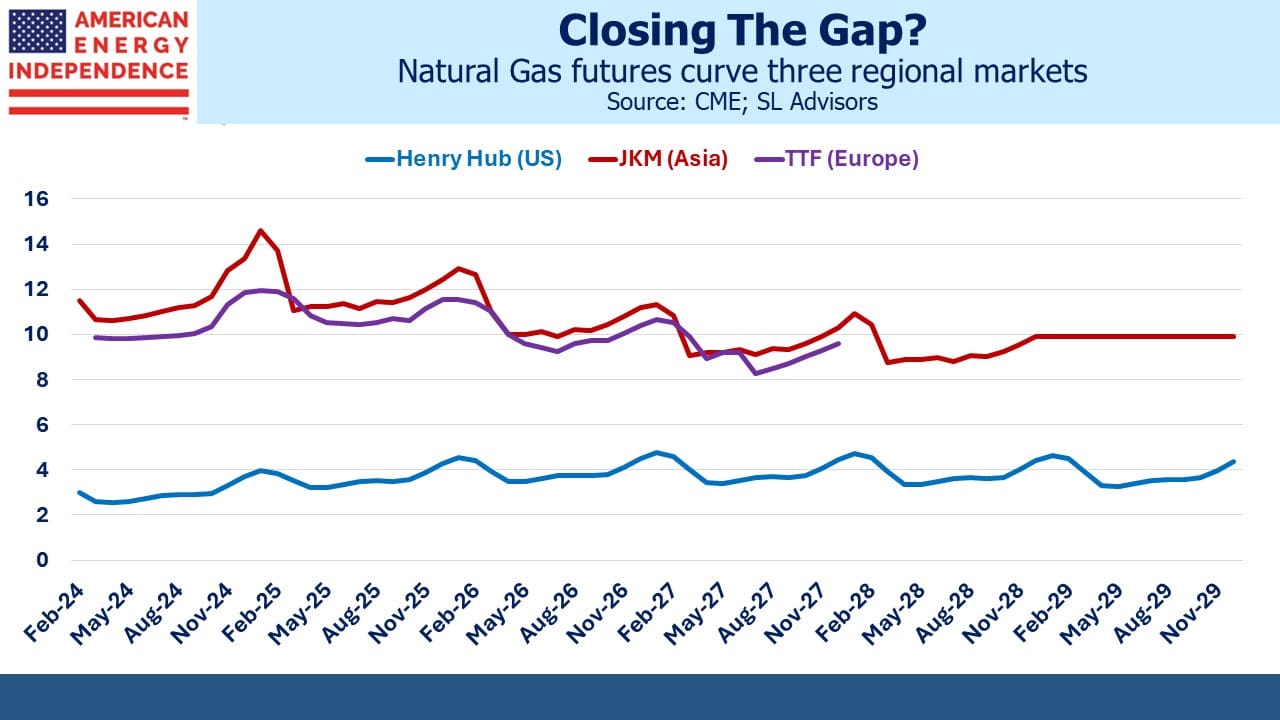
Pipelines are even less correlated with natural gas. This is partly because there are enormous global price disparities. US LNG exports are growing but still constrained by insufficient liquefaction capacity to satisfy global demand. Hence US natural gas prices are far lower than European and Asian benchmarks.

Gas prices have been sliding in recent weeks, confounding some who think Europe’s pivot away from Russian pipeline exports should create immediate incremental demand. The main reason is weather. Just before Christmas the US experienced a cold snap which boosted domestic demand, but since then it’s been a relatively mild winter. The same has been true in Europe, where fears that rationing might be required before winter’s end are receding.

Most of the US has seen milder weather as defined by Heating Degree Days (the average of the day’s high and low subtracted from 65, or 0 if negative). Only the Rocky Mountains and west coast have been different. California’s relentless rain is being blamed by some on global warming, but it reaches the mountains as snow which I can personally attest is creating great skiing conditions.

The milder winter is curbing demand for natural gas, most clearly seen in the 17% drop in the residential and commercial category compared with a year ago. Exports are also less than forecast. The Freeport LNG plant is the 2nd biggest such facility in the US behind Cheniere’s Sabine Pass. Restarting operations there following the fire last June has also taken longer than expected, curbing demand for natural gas supplies to be converted into LNG. The company is sticking with its latest forecast that it’ll be back up by the end of January.

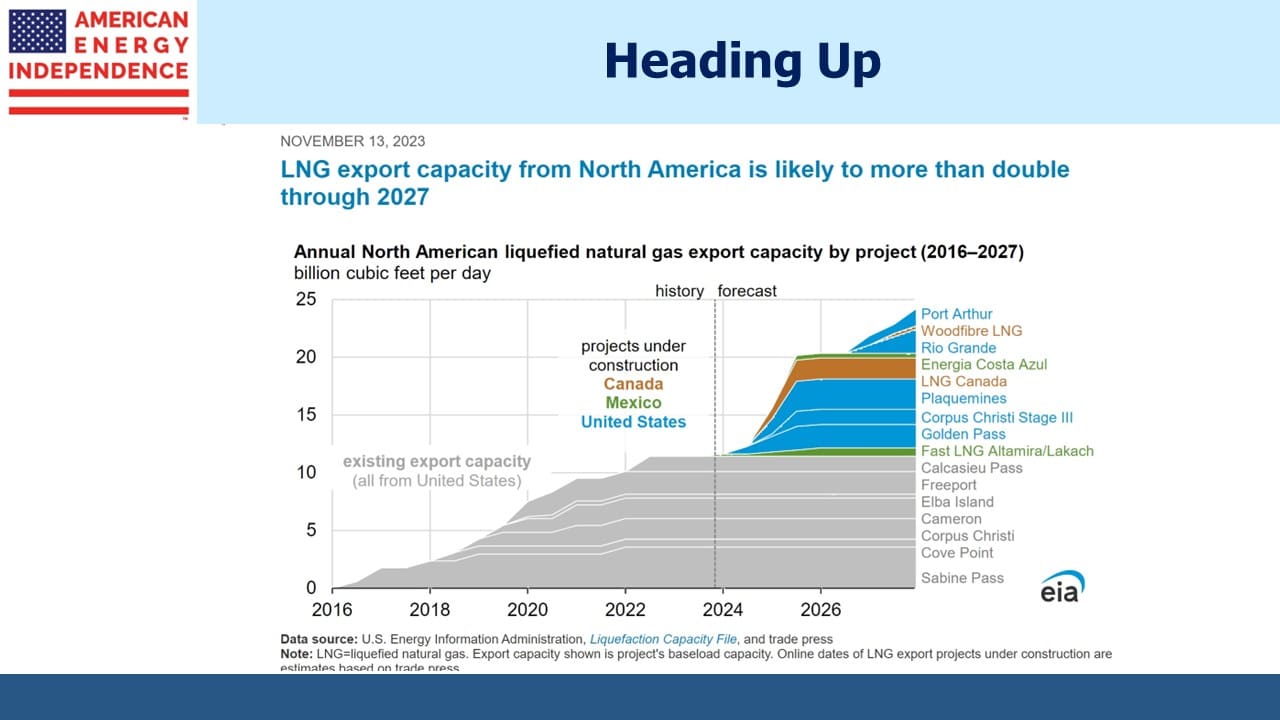
Looking ahead, LNG demand will assuredly grow and the weather will fluctuate. The Energy Information Administration’s Short Term Energy Outlook sees US LNG exports averaging 12.1 Billion Cubic Feet per Day (BCF/D) this year and 12.6 BCF/D in 2024. They did trim this year’s forecast modestly because of the delay in Freeport’s restart.

US LNG export capacity won’t grow significantly for another couple of years, but by 2030 will have almost doubled in a decade. This will help close the price gap between US natural gas and other global benchmarks, although even then LNG exports will represent less than 20% of domestic demand.

Australia vies with the US and Qatar for top LNG exporter. But LNG exports have become a political issue down under, because such a big portion of production is flowing overseas that it’s boosting domestic prices. In recent years Australia’s federal government has contemplated export curbs. These are vehemently opposed by the gas industry which argues they may be forced to violate contractual obligations. Partly as a result of political pressure, Australian LNG exports are expected to dip this year.

The Netherlands is also planning to curb exports, but for different reasons. Their Groningen gasfield, the largest in western Europe, has been widely linked with earthquakes. There have been up to 100 annually since 1980, ranging as high as magnitude 3.6. Several years ago tremors in Oklahoma were attributed to fracking, although blame was eventually pinned on improper wastewater disposal not the fracking itself.

But fracking is not used in Groningen, and it appears that the removal of natural gas itself destabilizes the ground. 160,000 damage claims have been submitted by residents of the area. The Dutch government has been promising to halt gas production there since 2018 and now sounds as if they will finally follow through.

The timing is awkward because Groningen borders Germany and supplies the northwest of the country. The EU pressed the Dutch to increase production following Russia’s invasion of Ukraine. Depending on Europe’s supplies Groningen may continue production until October 2024 but not beyond that.

Political pressure in Australia and the Netherlands will enhance the prospects for US LNG exports both to Europe and Asia.

Following Sunday’s blog critical of Kinder Morgan, some readers asked why we have any position in the company at all. We’ve been critical of their returns on invested capital for several years (see Kinder Morgan’s Slick Numeracy) and they’ve long been an underweight for us.

Today the company’s poor investment history is well known by analysts if not acknowledged by the board since they just elevated a long-time member of the management team and former CFO Kim Dang to CEO. We’ll look for signs of improvement. Their Enhanced Oil Recovery business (EOR) was an unwelcome source of EBITDA volatility, but with the Inflation Reduction Act increasing tax credits for CO2 capture including from EOR, there’s some chance for this segment to become more interesting.

We have three funds that seek to profit from this environment:

Energy Mutual Fund Energy ETF Real Assets Fund

 

Will Kinder Morgan Cover Its Cost Of Capital?

SL Advisors Talks Markets
Will Kinder Morgan Cover Its Cost Of Capital?
Loading
/

Kinder Morgan (KMI) reported earnings last week and announced that President Kim Dang will be taking over from Steve Kean as CEO. This prompted us to look back over KMI’s history, which reflects some of the best and worst of the MLP sector for the past ten years.

A decade ago the shale revolution drove increased capex for upstream E&P companies as well as the midstream ones that service them. Prior to 2014 KMI operated as the General Partner (GP) to MLPs Kinder Morgan Partners (KMP) and El Paso Partners (EP). The GP-MLP structure always looked to us like the hedge fund manager-hedge fund relationship.

The GP (HF manager) calls the shots and the MLP (HF) does what it’s told with limited rights for the limited partners. The GP could and often did sell assets to its MLP (a “dropdown”), directing the MLP to issue equity and debt to pay for them. Or the GP could direct the MLP to build new infrastructure. The GP had Incentive Distribution Rights (IDRs) which operated like the carried interest taken by HF or private equity managers. It gave them a share of the profits with minimum capital at risk.

Back then we always invested in the GP rather than the MLP because, as with hedge fund managers, that’s where the big money gets made. Rich Kinder exploited his MLPs masterfully and became a billionaire in the process. However, by 2014 the increasing need of MLPs to raise ever more capital to finance infrastructure for the shale revolution was driving up yields, making raising equity capital more expensive.

Kinder was frustrated at KMP’s high cost of capital, so in August 2014 Kinder Morgan announced it was simplifying its structure and rolling its MLPs into KMI to create one single entity. We were moved to write enthusiastically about it (see Valuing Kinder Morgan in its New Structure).

Rich Kinder said at the time, “”We have vastly simplified the structure” and promised “modest cost synergies,” He also promised a $2 annual dividend growing at 10% for the next five years. Less than two years later it was slashed by 75% and still hasn’t recovered.

KMI began a trend to roll MLPs up into their GP parent, which was often a corporation. MLPs had attracted income-seeking, K-1 tolerant investors but the model broke when midstream companies followed their upstream clients into over-investing. Increased leverage led to distribution cuts, alienating the traditional income-seeking investor. The MLP structure has never recovered, and they now represent around a third of the sector. The Alerian MLP ETF remains as an anachronistic vehicle for those who only want MLP exposure and are content with a tax-inefficient structure (see AMLP Trips Up On Tax Complexity).

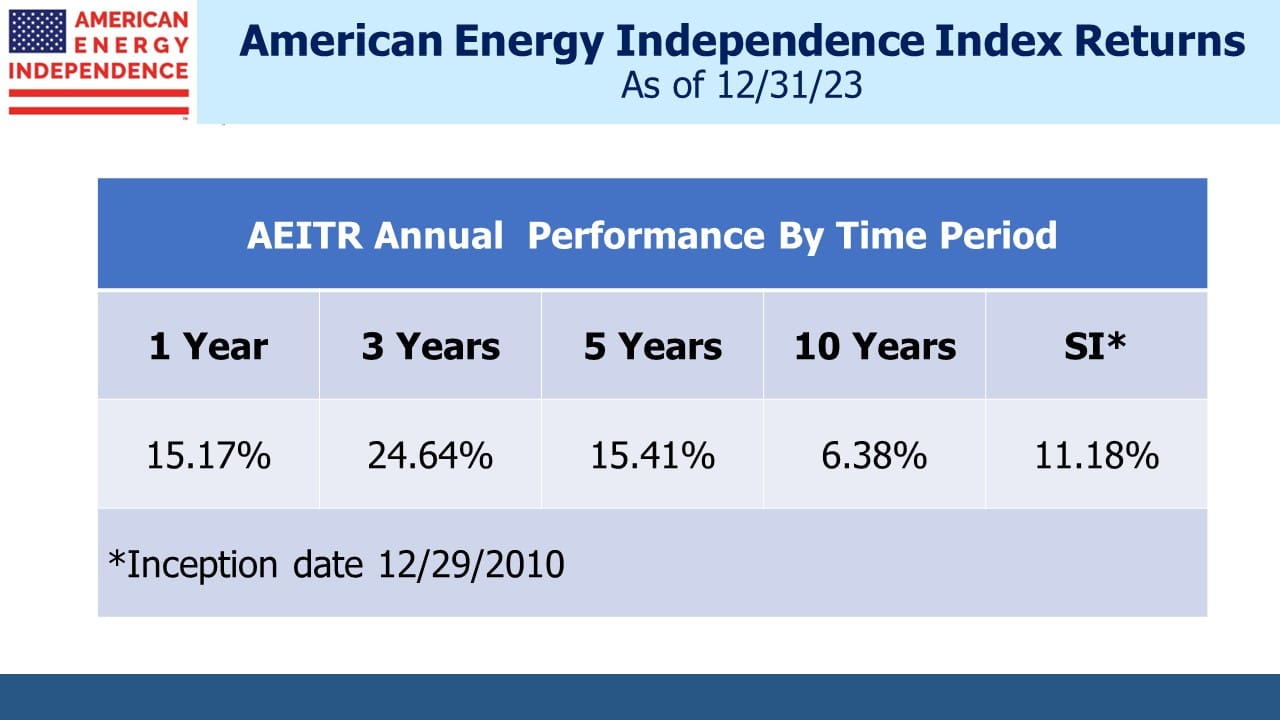
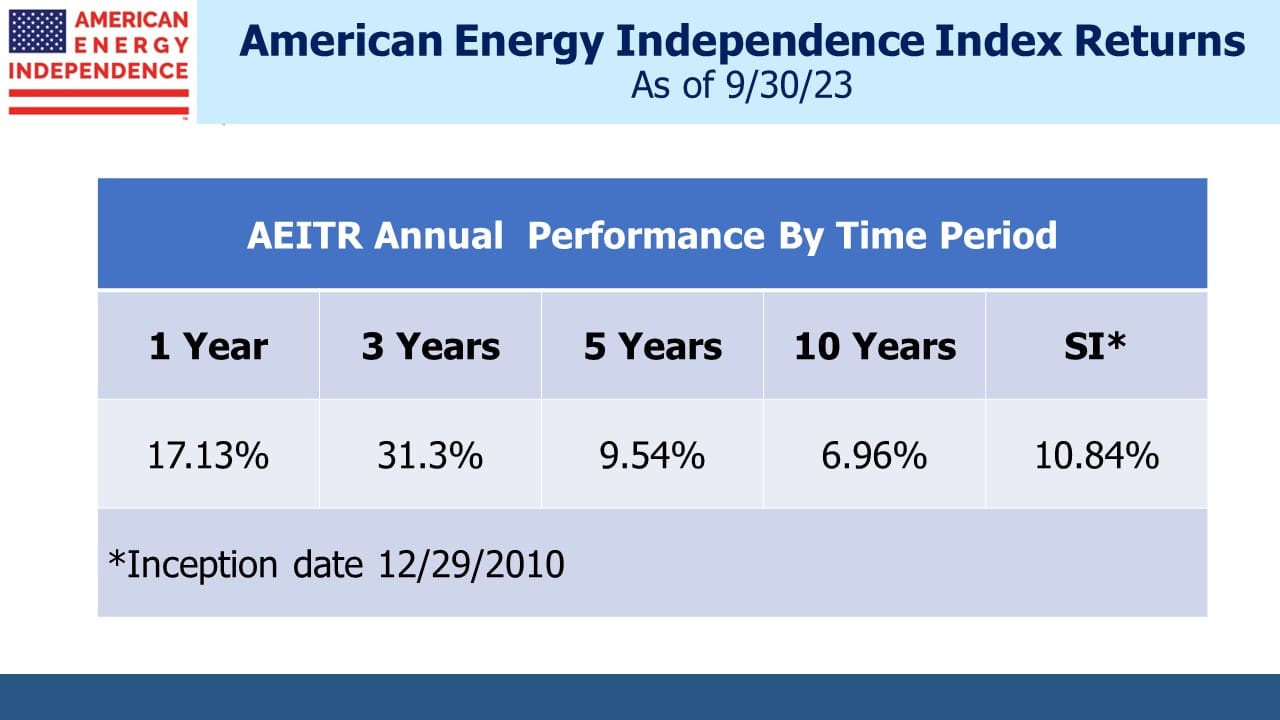
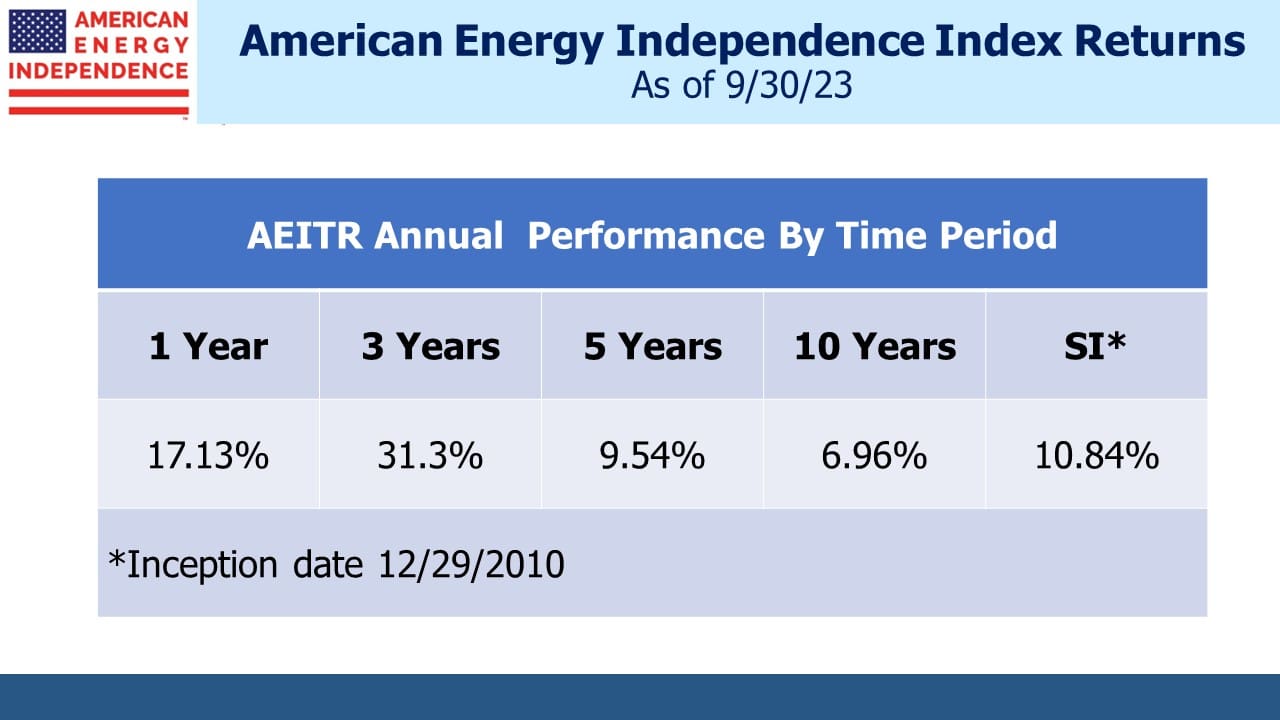
August 2014 was the peak in the energy sector for that cycle. Since then, KMI has generated a minus 2.9% annual return with dividends, lagging the sector, defined as the American Energy Independence Index (AEITR), which has generated 3.3% pa. KMI’s dividend is $1.11, still a long way from the $2 promised nine years ago.

KMI has a track record of investing in low return projects. Wells Fargo calculates that over the past five years KMI has earned a Cash Return On Investment (CROI) of only 4.4%, the lowest of any big company. Since 1999 they’ve earned 5.6% versus an industry median of 10.7%. KMI’s stock has lagged because they keep investing in projects that earn less than their cost of capital.

Rich Kinder ran the company during most of this period, and he’s misallocated his own capital as well as his investors’ because he’s still the biggest individual owner of KMI shares with around 11% of the company. His personal fortune is from understanding how to exploit the GP/MLP structure that used to exist, but he must think it’s from making good investments.

Which brings us to the new CEO Kim Dang. She became CFO in 2011 and has been part of the management team ever since. The low CROI projects substantially occurred on her watch. Did she internally oppose misdirected capital, or did she misestimate returns as much as Kinder? Neither explanation is good, and KMI’s pliant board of directors doesn’t seem too concerned about the company’s investment track record.

On KMI’s 4Q22 earnings call, Dang commented that, “A large part of my job is going to be about continuity.” Long-time investors may feel a twinge of nervousness at this prospect. An improvement on past performance is needed.

Encouragingly, KMI added $1BN to their buyback program. Given the stock’s poor performance for many years, this might be one of their best uses for excess capital.

We continue to own KMI but at a reduced size relative to its percentage of the sector’s market cap.

We have three funds that seek to profit from this environment:

Energy Mutual Fund Energy ETF Real Assets Fund
 

The Slow Death Of 60/40

SL Advisors Talks Markets
The Slow Death Of 60/40
Loading
/

On the weekend the WSJ highlighted contrasting views of the 60/40 portfolio between Goldman Sachs and Blackrock. The classic asset allocation had its worst year in nominal terms since the 2008-9 Great Financial Crisis (GFC) and adjusted for inflation the worst since the Great Depression.

It shouldn’t be a surprise. Bond yields have been too low to justify the discerning investor’s capital for many years – a point I made in my 2013 book Bonds Are Not Forever: The Crisis Facing Fixed Income Investors.

The Federal Reserve owns $7.3BN in treasury bonds and Mortgage-Backed Securities (MBS). These holdings are a result of Quantitative Easing (QE), which Ben Bernanke first unleashed in response to the GFC. At the time this was a controversial move that many (including me) thought would be inflationary. Bernanke understood better than anyone how the monetary system would respond. It was a unique moment and QE should have been a one-off.

But in 2020 Jay Powell took it to a new level before the prior QE holdings had run off. Now one must conclude that any economic downturn will be met with Fed balance sheet expansion. The current lethargic pace of balance sheet reduction will likely be reversed with the next recession. This partial debt monetization is becoming permanent. It’s a consequence of too much debt.

Japan is the biggest foreign holder of US treasuries with $1.1TN. China is second at $0.9TN. Along with the Fed, for these investors a return ON capital is unimportant – they want a return OF capital. The old fear that China might dump their holdings is irrelevant with QE. Selling a $1TN of bonds would be destabilizing, but who now doubts the Fed would step in and take the other side?

Inflexible investment mandates that require fixed income allocations regardless of return prospects are another source of excess demand for bonds.

The result is that return-oriented bond investors are competing with substantial capital disinterested in a return. Bonds had some good years following the publication of my book warning investors to take their capital elsewhere. The adjustment away from fixed income is slow. But last year was a wake-up call. Paltry yields left diversification as the only justification for owning bonds. But their correlation with stocks has been rising sharply. The ascendancy of TINA (There Is No Alternative) caused this. The tyranny of pygmy interest rates and consequent shift to equity risk increased the stock market’s vulnerability to rising rates.

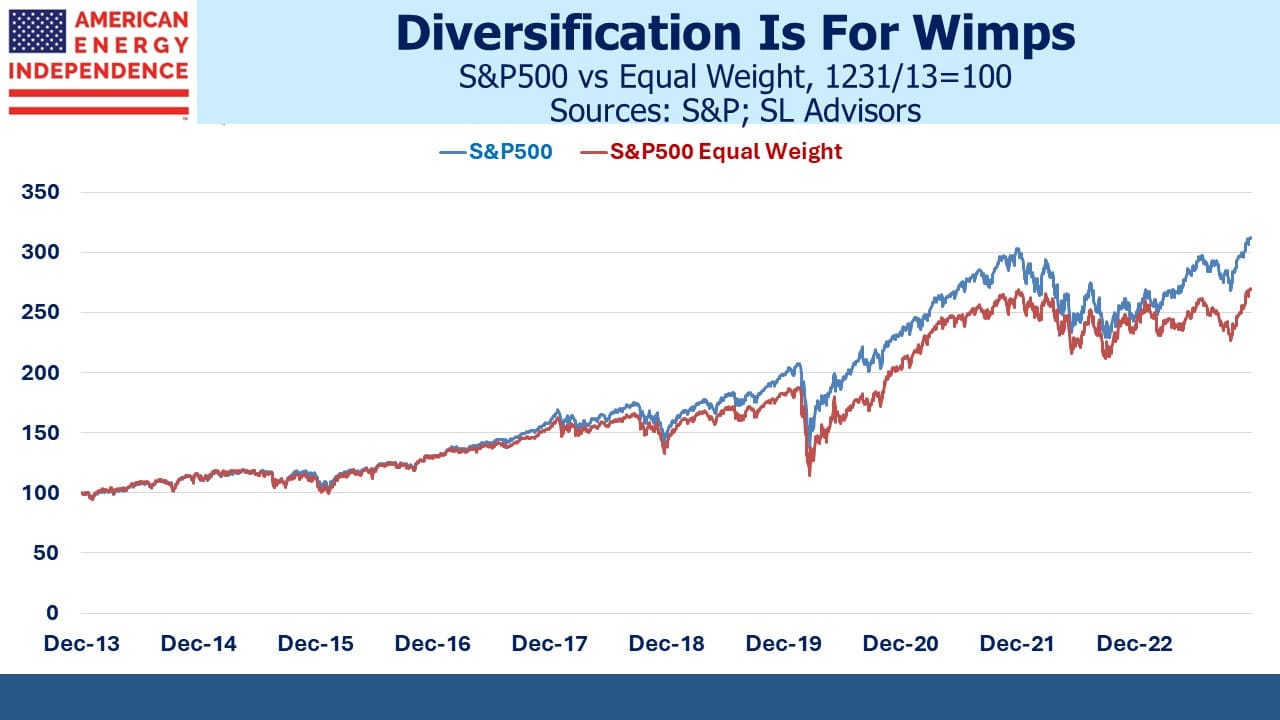
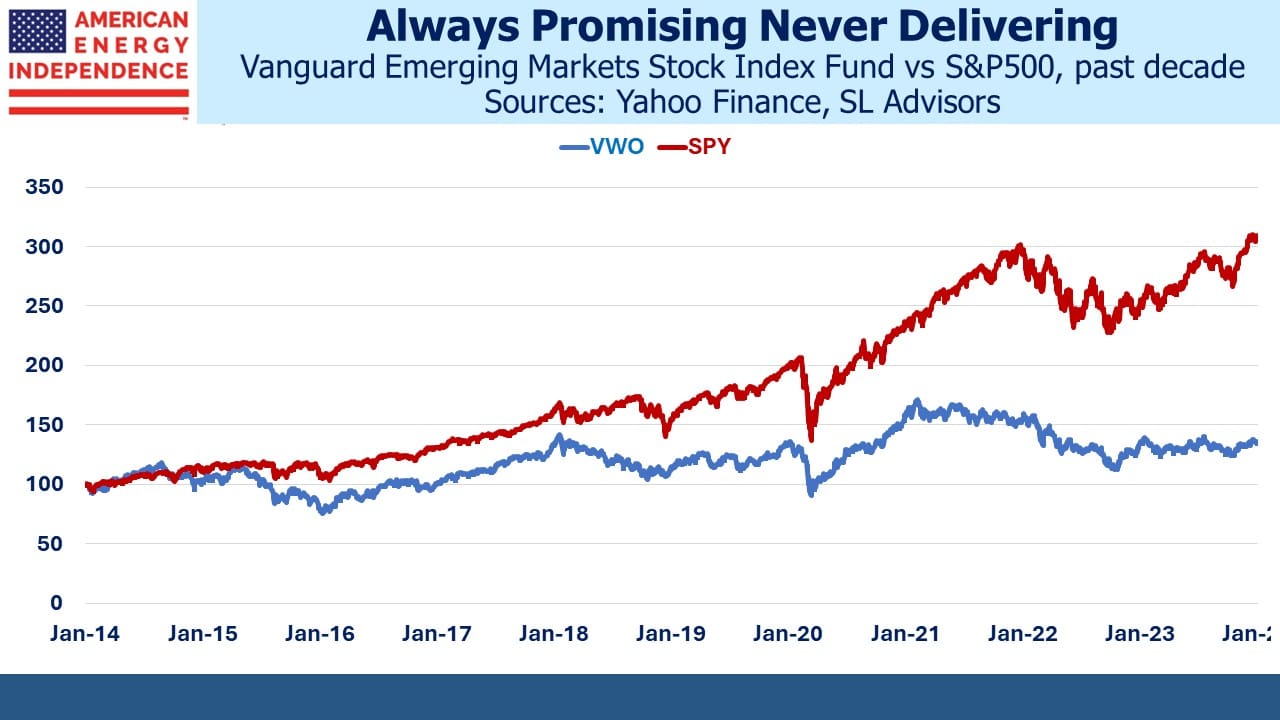
Over the past decade the Barclays Agg returned just 1.3% pa, versus 12.2% for the S&P500.

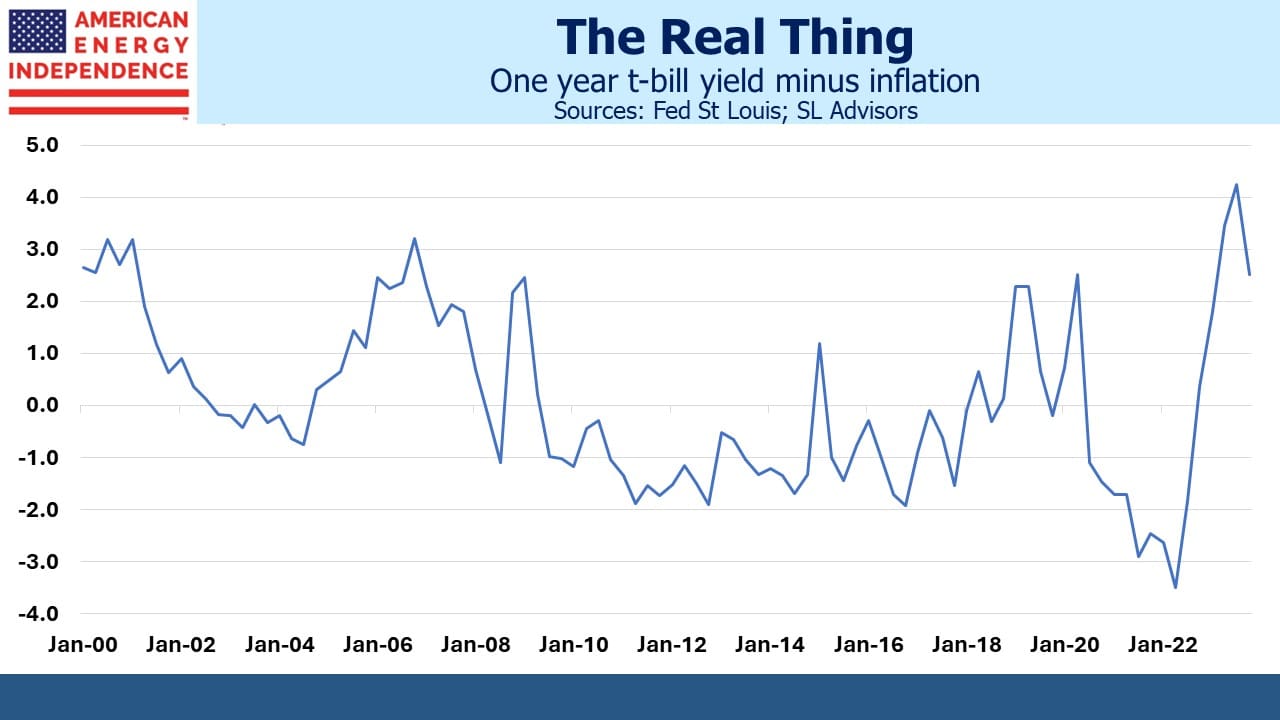
Today’s higher yields suggest a better decade ahead. But much depends on inflation. At 3.5% the ten year treasury note offers just 1.5% above the Fed’s long term inflation target of 2%. This is below the real return of the past hundred years. And it relies on inflation quickly returning to 2% and remaining there.

Inflation expectations are encouraging. Like many banks, JPMorgan expects falling inflation this year and is forecasting CPI of 2.8% in 4Q23. Ten-year TIPs yield 1.3%, implying a 2.2% embedded inflation rate in the bond market. The University of Michigan consumer survey regularly confirms this benign outlook.

The broad consensus on price stability isn’t easily ignored. It’s possible that return-insensitive buyers noted above are distorting the message unconstrained bond yields might offer. But Wall Street analyst and household views are harder to explain away. Nonetheless, having endured two years’ of high inflation a cautious investor should assume something above 2% in the future if only to compensate for the risk that these forecasts are wrong. A saver assuming her annual living expenses will increase at 3% into retirement will quickly find equities offer the only hope of keeping up.

60/40 was finished years ago. I haven’t owned a bond in probably two decades. There’s no point. Neither do any of our SMA clients. Instead they hold cash as a diversifier. 90-day treasury bills averaged 0.8% over the past decade, 0.5% less than the return on the Barclays AGG over that time but with no risk. Cash is a risk enabler. It supports increased exposure to equities which is the only chance savers have to maintain purchasing power. Bonds offer risk with an inadequate return.

Yields are still too low. The Congressional Budget Office forecasts sharply rising Debt:GDP over the next thirty years. US taxpayers are benefiting from investor inertia, since long term yields aren’t commensurate with the debt outlook.

In BlackRock vs. Goldman in the Fight Over 60/40, the WSJ finds Blackrock believes it outmoded while Goldman defends the indefensible. However, Goldman’s asset management business asked Is the 60/40 Dead? in October 2021 and warned “investors should at the very least recalibrate expectations.” Even within Goldman Sachs, reasonable people can disagree.

For more on how a combination of stocks and cash can replace fixed income, see The Continued Sorry Math Of Bonds, which we published around the same time. Adding midstream energy infrastructure to the equity portion of the stocks/cash barbell will, in our opinion, further boost its performance.

We have three funds that seek to profit from this environment:

Energy Mutual Fund Energy ETF Real Assets Fund


US Oil And Gas Production Growing

SL Advisors Talks Markets
US Oil And Gas Production Growing
Loading
/

The US Energy Information Administration (EIA) published their Short Term Energy Outlook last week. The EIA produces an enormous amount of data and is apolitical. For energy investors it’s really all good news.

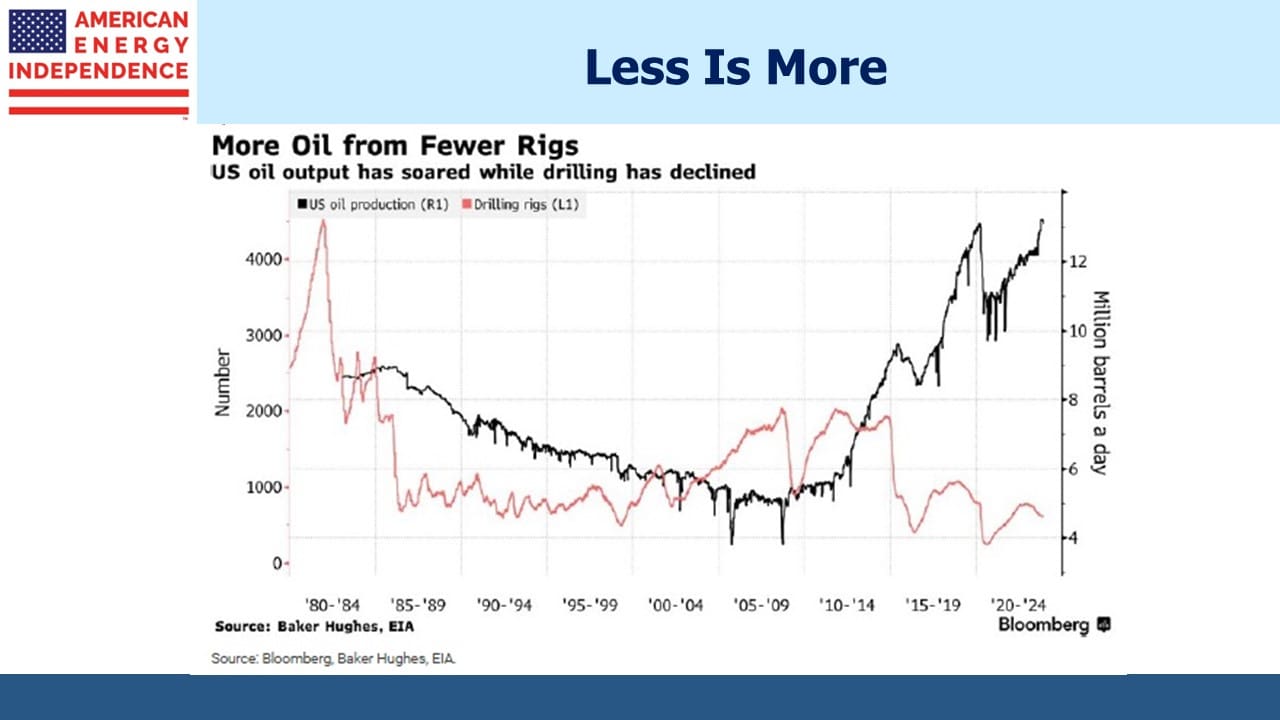
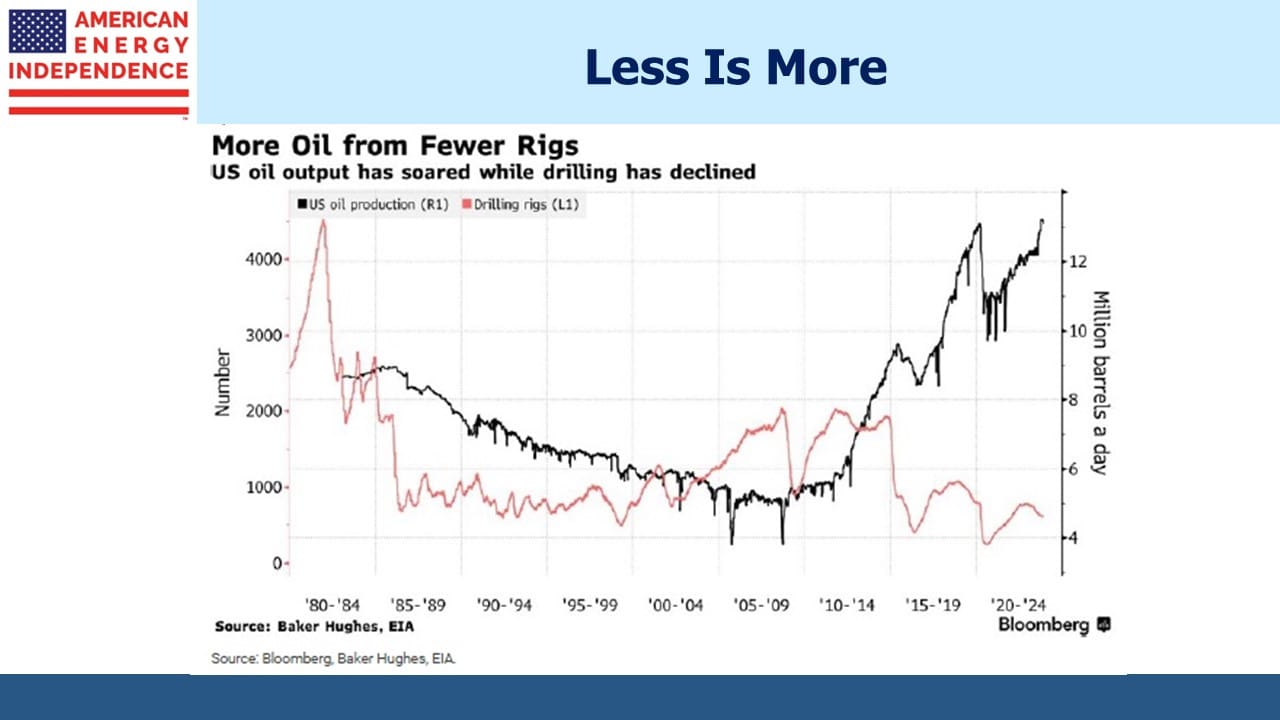
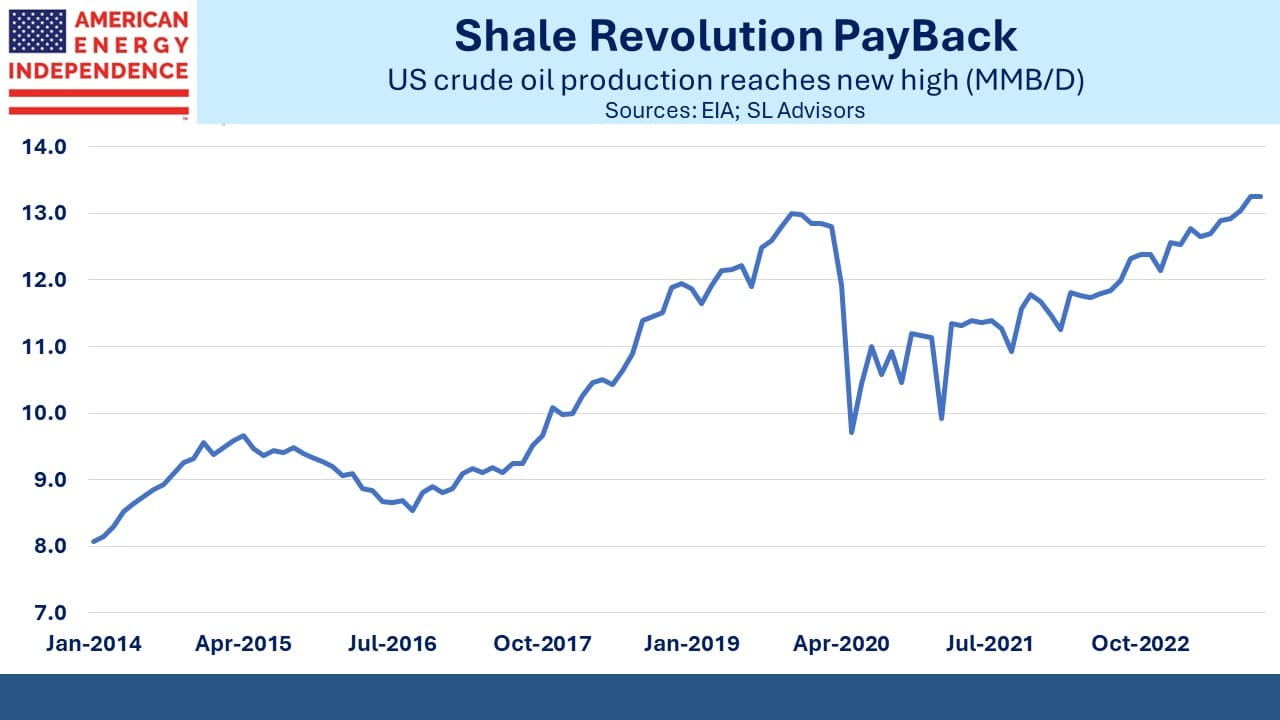
US crude production is expected to grow, but slowly. Natural gas production will increase at a faster pace with export growth more than offsetting a modest drop in domestic consumption. US CO2 emissions will continue to fall, accommodating growth in China and other emerging economies where higher living standards are their priority.

The charts tell their own story. You’ll note that Residential and Commercial consumption of natural gas is expected to rise in spite of the musings of the Consumer Product Safety Commission about eliminating gas stoves. And the last four years have shown slightly cooler weather in the US, although not enough to form a trend.

Climate Action Tracker, a website that assesses countries’ commitments to reduce emissions, rates China “Highly Insufficient”. No country is compatible with the UN’s “Zero By 50” goal which requires eliminating CO2 emissions by that date in order to limit global warming to 1.5°C above 1850. Britain and Norway are among those rated “Almost Sufficient”. The US is “Insufficient” while China, India and most of Asia ex-Japan are rated “Highly Insufficient”.

China’s emissions are expected to grow through 2030, at which time the government says they’ll start falling and reach zero by 2060. Western negotiators at the UN who are dominated by liberal politicians too readily accept China’s word. They haven’t been forthcoming about Covid or much else, so it’s unclear why climate change would be different. Rich world countries, where climate concern is greatest, will push ahead with emissions-reducing policies that are more than offset by developing Asia. This gets too little media coverage.

Last week in a significant development, Climeworks announced that they had pulled CO2 from the air and stored it underground at a meaningful scale, verified by an independent third party. Direct Air Capture (DAC) is not easy – there’s around 412 parts per million of CO2 in ambient air, although it has been trending up. Much higher concentrations can be found in the emissions of power plants or petrochemical facilities. Although cheaper to capture at the source, the CO2 then needs to be moved by pipeline to permanent storage underground. Climeworks equipment can be built on or near the porous rock formations appropriate for permanent storage.

This development is another step towards proof of concept. Microsoft, e-commerce company Shopify Inc. and payments firm Stripe Inc have each agreed to pay hundreds of dollars per Metric Tonne (MT) for credits which they can use to offset their own emissions. Because the CO2 is permanently stored and independently verified, this is a more robust and honest way for companies to demonstrate reduced emissions.

The Inflation Reduction Act provides for 45Q tax credits as high as $180 per MT for DAC, a level that is generating interest among several US energy companies. We’ve been following carbon capture developments for some time (see Clean Energy Isn’t Just About Renewables). Occidental is developing the world’s biggest DAC facility driven in part by the 45Q credits (see How Occidental Invests In Lower Taxes).

Concrete maker Lehigh Hanson, plans to capture CO2 from its operations. Start-up CarbonCapture expects to remove 5 million MTs per annum by 2030, and UK-based DRAX 12 million MTs. The 45Q tax credits aren’t capped. The Congressional Budget Office estimated they’ll cost $3BN over the next decade. Credit Suisse thinks $52BN. Forecasts are that around 200 million MTs, representing 4% of US energy-related CO2 emissions, will be captured by 2030.

It’s also possible for carbon atoms to make a virtuous roundtrip. They first leave a natural gas formation as methane (CH4) to be used by a petrochemical facility before being emitted and returned as CO2 for sequestration back in a geological formation similar to the one they left (see Putting Carbon Back In The Ground).

It’s appealing to think that DAC could ultimately solve the problem of climate change. If the technology works, the world only needs to identify enough sites to deploy the Climeworks equipment for permanent CO2 sequestration. It’s much more appealing than relying on vast, intermittent solar and wind farms with requisite battery backup.

But Climeworks understands their market, and their website sensibly positions the company as complimenting other efforts to reduce emissions: “To mitigate climate change, we need all solutions to be working together. One measure alone is not enough.”

When the EIA’s outlook is combined with the positive fundamentals outlined in Wednesday’s blog post (see Bearishness Is Holding Back Energy), there are plenty of reasons for pipeline investors to remain optimistic.

We have three funds that seek to profit from this environment:

Energy Mutual Fund Energy ETF Real Assets Fund


Bearishness Is Holding Back Energy

SL Advisors Talks Markets
Bearishness Is Holding Back Energy
Loading
/

Michael Wilson, Morgan Stanley’s chief equity strategist, thinks stocks could fall 22% this year. Wall Street is bearish, and the mood has spread to consumers. Earnings forecasts are falling and households report expectations close to the depths of the 2008 great financial crisis. A lot of smart people are negative. We don’t spend any effort positioning for the economic cycle – when recessions have struck they’ve usually been unexpected. If the US slips into one later this year it’ll be the most anticipated in living memory.

Fortunately, Morgan Stanley like most firms encourages disparate opinions and does not enforce a “house” view in its public pronouncements. Hence Robert Kad, who heads up MLP and Energy Infrastructure research is publicly, even giddily bullish on the sector. Of the companies they cover, which is most of them, he expects a median one year price return of 21.9%. With dividends he expects 29.1%. Kad is so bullish that he even expects those companies that are ranked Underweight to deliver a total return of 17.1%.

Some readers may think your blogger is the most relentlessly optimistic on pipelines. When investors ask me to offer an estimate for one year returns, I meekly offer 6% dividends plus 3% growth plus 1% in buybacks, or 10%. I have to confess that Kad’s bold optimism casts a pall of inadequacy over my forecast compared with his fearless proclamation of the opportunity that is presented.

JPMorgan’s Jeremy Tonet expects a median one year total return on his coverage group of 23.5%. Wells Fargo’s Michael Blum is more constrained, expecting a 13% price return on their Overweight group

We agree with Kad’s reasoning – the sector’s free cash flow yield is 2X the S&P500 and well above those of all major sectors. The boost to carbon capture from increased tax credits in the Inflation Reduction Act should cause a rethinking of terminal asset values as pipelines remain key to the energy transition. Sluggish growth in US crude production looks likely as areas mature and capital discipline persists among E&P companies. China is emerging from its three year lockdown, Russian exports are falling with the price cap imposed in December, and the Administration has completed its sale from the Strategic Petroleum Reserve (SPR). Oil looks like a risky short. The US rejected offers of crude to replenish the SPR as too high or the wrong grade. The White House attempt to trade oil is likely to leave it unable to cover earlier sales profitably.

The energy sector’s P/E ratio is 0.6 of the S&P500, the lowest in over twenty five years according to Yardeni Research. Energy analysts are bullish, but the market is not. The three headwinds of shale overbuild, fears of stranded assets and covid demand destruction inflicted such financial trauma on investors culminating in 2020 that the cathartic rebound continues amid skepticism. Retail investors are not yet contributing net inflows into sector funds, although the year-end bounce we postulated (see Will The January MLP Effect Beat Negative Sentiment?) is working. Sector analysts are more bullish than investors.

Last month Tallgrass bought the Ruby natural gas pipeline which runs from the Rocky mountains west to California, out of bankruptcy. Combined with the Rocky Mountains Express (REX) pipeline Tallgrass owns, this creates the potential for natural gas in the Marcellus to move across the country to California markets where prices are high even as Californian politicians seek to reduce its use. Tallgrass likely assesses the Golden state will be using gas for a long time yet.

In other news, AQR’s Cliff Asness wrote an eloquent criticism of private equity valuations. Increasingly, the absence of a regular mark to market is being regarded as a welcome absence of volatility instead of simply an absence of information. Blackstone (see Is BREIT Marked To Market?) recently raised $4BN from University of California (UC). Far from endorsing Blackstone’s valuations, the terms which include close to a guaranteed 11.25% return to UC, suggest that’s what it took to raise new money.

Lastly, a photo from Vail where my younger daughter and I are on our annual ski trip with good friend, client and instructor Bill Edwards. Bill’s a retired orthopedic surgeon from San Antonio that I’ve known for twenty years. We’ve spent many enjoyable ski vacations in his unfailingly good company. Every year he generously sees improvement and I really think he’s right. Any skiing competence I exhibit is down to him; the falls are my own work (or as he says, a failure to listen).

We have three funds that seek to profit from this environment:

Energy Mutual Fund Energy ETF Real Assets Fund


Don’t Bet On A Return To 2% Inflation

SL Advisors Talks Markets
Don’t Bet On A Return To 2% Inflation
Loading
/

The Fed has a poor forecasting record, something Wall Street never tires of pointing out. The chart below from Barclays shows the FOMC’s constant self-correction on inflation through successive meetings.

Fed chair Powell downplays the blue dots but often refers to them at his press conferences. Usually, the dots move towards the market as the Fed even has trouble forecasting their own policy rate. A recession later this year is the consensus forecast. It’s conventional wisdom that tighter policy will depress growth and induce a pivot. Fed funds futures imply easier policy by year’s end, although with less conviction than a month ago. The minutes released last week showed members expect, “a sustained period of below-trend real GDP growth would be needed.”

Futures modestly bowed towards the blue dots, with rate expectations a year out moving up 0.25% or so since the last FOMC meeting.

Inflation is finally falling and is widely expected to return to 2% within a couple of years. Long-term inflation expectations have remained surprisingly sanguine. Blackrock has a different view. In their 2023 Global Outlook they expect the “politics of recession” to force easier policy on central banks prematurely.

We noted recently that market sentiment measures are as negative as extremes such as the 2008 financial crisis and even turbulent 1980. Inflation was public enemy #1 and there was broad political agreement to vanquish it. Consumer expectations are recession-like and the economy is well beyond full employment.

And yet, there are conflicting measures of the job market. The Establishment survey, which targets businesses, and the Household survey, which targets people, are diverging sharply in estimating job creation. Through December a gap of over 2.3 million jobs opened up between the two in the past year, approximately when the Fed began tightening monetary policy. Friday’s household survey registered an additional 717K workers, so the discrepancy has closed somewhat.

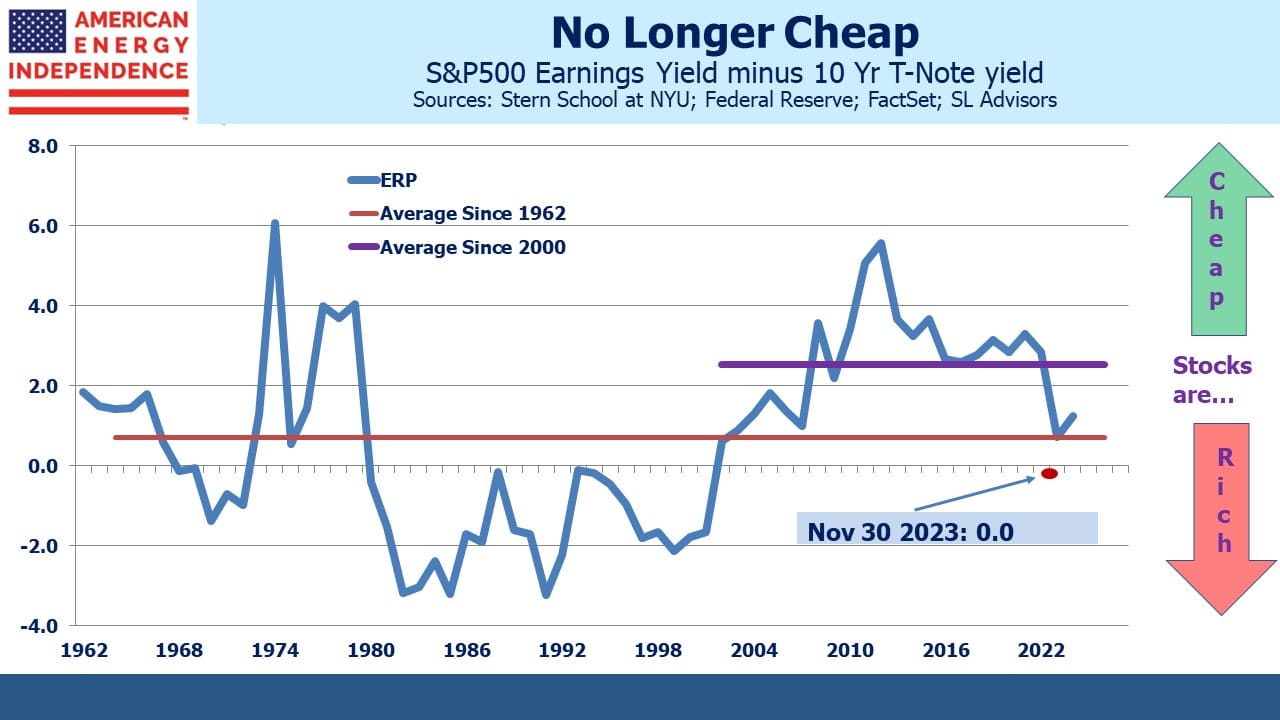
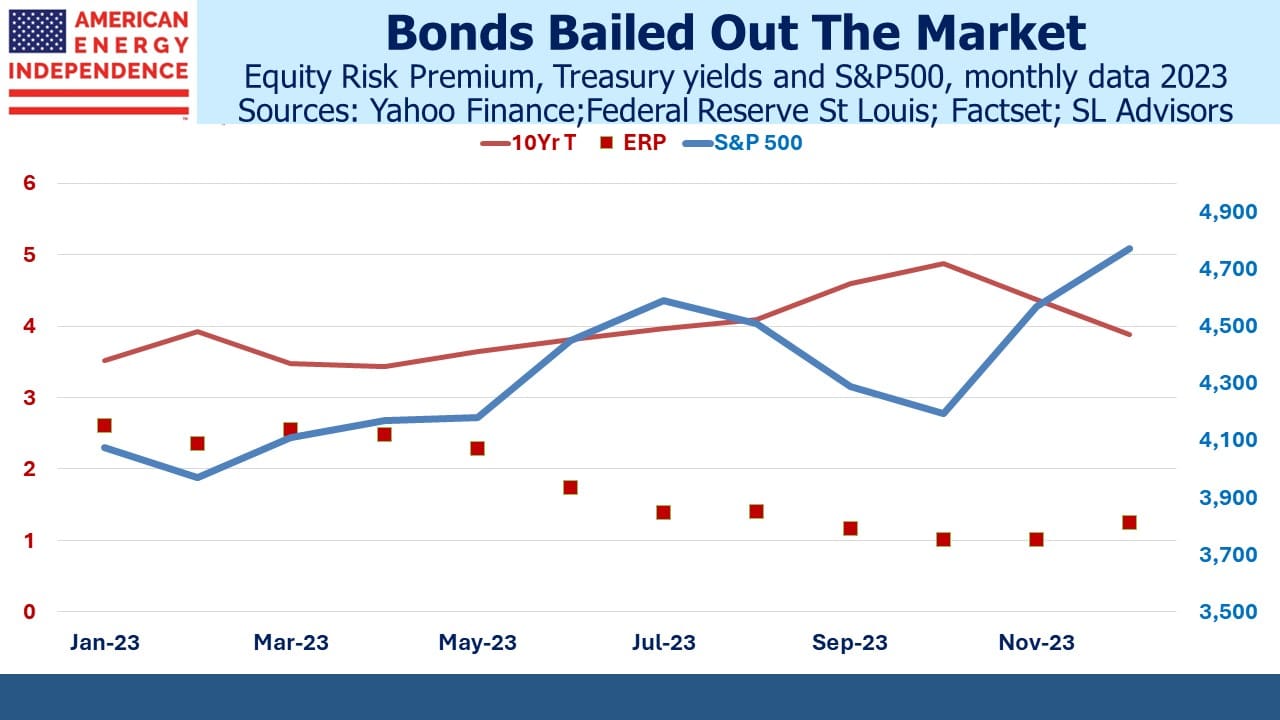
Analysts’ earnings forecasts are trending down and are expected to grow less than 5% this year. As a result, the Equity Risk Premium (S&P500 earnings yield minus the ten-year treasury yield) suggests stocks are at neutral valuation.

This suggests looming economic weakness sufficient to bring inflation back to 2%. But consumer sentiment is already so negative that evidence of a slowdown, such as a couple of weak employment reports, are likely to expose Fed policy to political criticism. Enthusiasm for reducing inflation is unlikely to withstand economic weakness.

This is the point of Blackrock’s view that we’re going to live with higher inflation. They cite three reasons: (1) an aging population (2) geopolitical fragmentation, and (3) the energy transition.

An older population means reduced eligible workers. The participation rate edged up to 62.3% and the unemployment rate fell to an historic low of 3.5%, both consistent with that long-term trend. China’s appeal for manufacturing has weakened with extended covid restrictions. Along with the risk of eventual conflict with Taiwan, companies are bringing production closer to home. The disinflationary effect of globalization is receding.

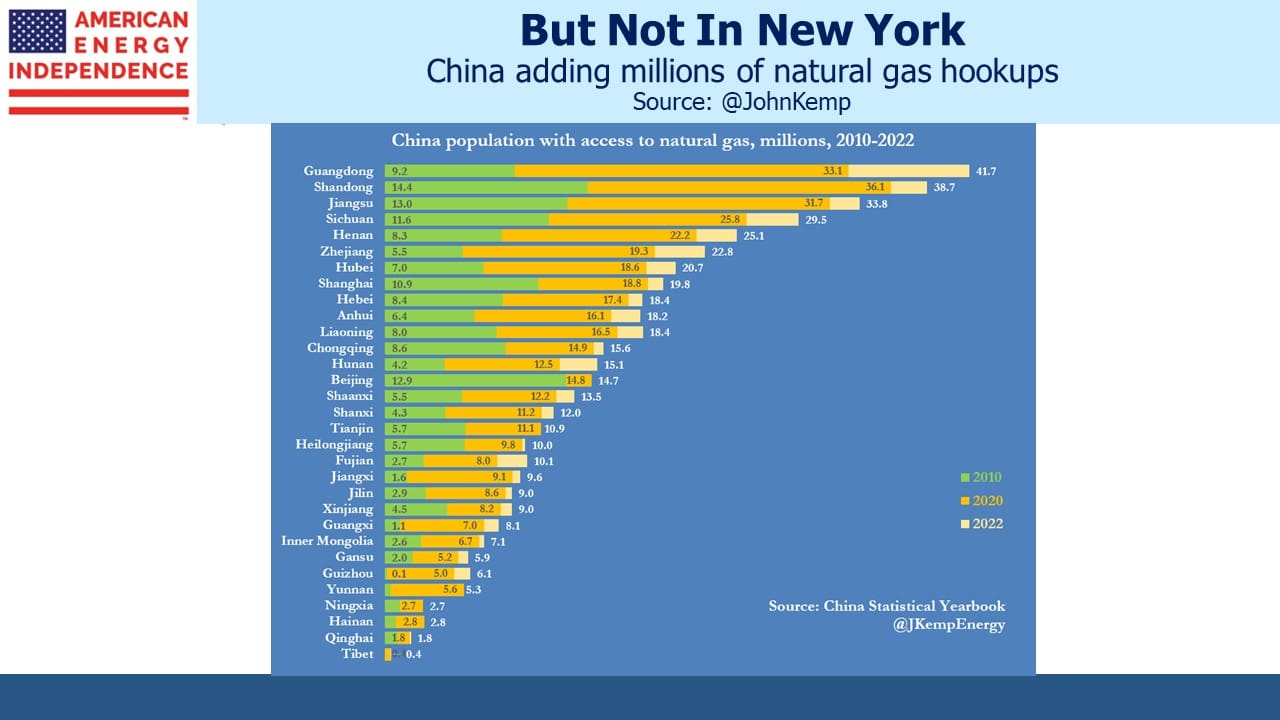
The energy transition is also inflationary, in two ways. The first is that it drives prices higher. If solar and wind were cheaper they’d be ubiquitous instead of around 14% of power generation which is itself around 19% of US primary energy.

The second inflationary impulse from solar and wind is coming from their consumption of steel, cement, copper and other resources. RBN Energy compares the inputs needed to power a town of 75,000 homes with a single 100 MW combined cycle natural gas plant or 200 MW of windpower. More power output is needed than for the natural gas plant because intermittency requires generating an excess that can be stored for when it’s not windy. They estimate you’d need 200X as much iron ore, 50X as much concrete and 20X as much specialty metals and minerals such as copper, chromium and zinc.

Manufacture of wind turbines is already driving up the prices of inputs. Companies such as Vestas and Siemens Gamesa are renegotiating contracts to try and restore profitability. Avangrid has told Massachusetts that the Commonwealth Wind project, the largest offshore wind farm in the state’s pipeline, “cannot be financed and built” under existing contracts.

None of the three drivers of inflation described above is necessarily deserving of a monetary policy response. Many would regard higher energy prices in support of reduced CO2 emissions as appropriate. Natural gas prices have collapsed in recent days due to unseasonably warm weather and doubts about whether the Freeport LNG export facility will be in operation again by late January as promised by the company. But looking ahead, the energy sector is likely to remain both a source of, and a hedge against, inflation.

We have three funds that seek to profit from this environment:

Energy Mutual Fund Energy ETF Real Assets Fund


Last Year’s Most Popular Blog Posts

SL Advisors Talks Markets
Last Year’s Most Popular Blog Posts
Loading
/

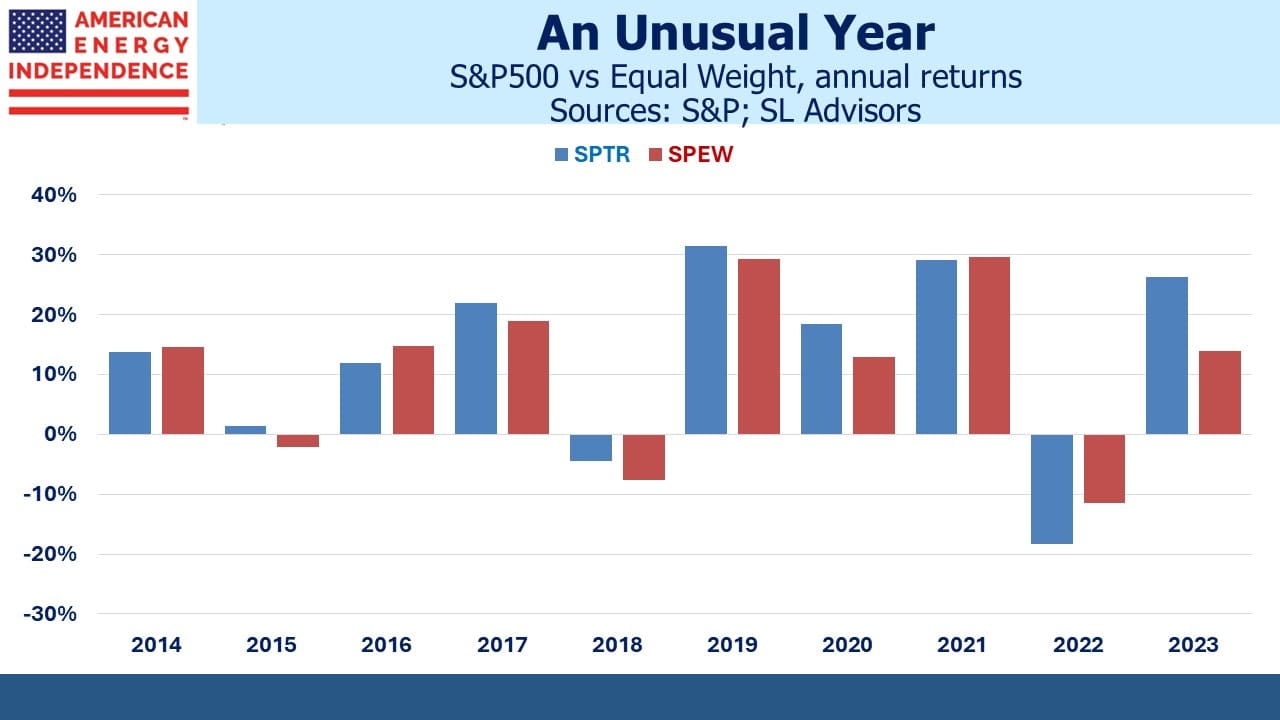
You might think last year’s 39.5% outperformance of the S&P500 by the pipeline sector was a record but in 2016 the margin was 42.0%. This followed a harrowing 41.0% underperformance the prior year. However, the past two years have been the best on record, with the American Energy Independence Index (AEITR) beating the S&P500 by 27.0% pa.

Our most popular blog posts of 2022 were those that covered the positive fundamentals underlying midstream energy infrastructure. Yields are historically tight to the ten-year treasury according to research from JPMorgan, which might make the sector appear rich to some. However, payout coverage is much healthier than in the past, with free cash flow yields almost 2X dividends. In Even After A 30% One Year Return, Pipelines Remain Cheap we highlighted this, as well as the higher incidence of distribution cuts among MLPs than their c-corp cousins.

Renewables receive so much media coverage that it’s tempting to believe they’ll solve all our energy problems. In Hydrocarbons Support The Four Pillars Of Civilization we reviewed Vaclav Smil’s latest book How the World Really Works which explains why global demand for steel, cement, plastic and fertilizer will drive continued growth for reliable energy. Solar panels and windmills are little use in manufacturing any of these vital inputs to modern society.

Russia’s invasion of Ukraine exposed western Europe’s strategic blunder on energy security, led by Germany. The loss of Russian natural gas led to a scramble for LNG not more windmills. In Energy Realism Is Spreading we examined the bullish long-term prospects for US exports of LNG.

The Hard Math Of The Energy Transition looked at the economics behind carbon capture, which received a boost from the Inflation Reduction Act passed in the summer. US climate change policy relies on subsidies aimed at rewarding emissions reduction instead of carbon taxes, and it’s creating business opportunities for midstream to sequester carbon underground, invest in hydrogen and produce emission-free LNG.

Natural gas continues to be our most important source of energy. On December 23 US demand set a new high of 155.7 Billion Cubic Feet per Day (BCF/D) according to S&P Platts, above the prior daily high of 150.2 BCF/D on January 30, 2019. Last year the US tied Qatar for top LNG exporter at 81.2 million tonnes, with Australia just behind at 80.5. The US was ahead during 1H22 until the Freeport terminal shut down because of a fire. Its resumption is likely to make the US the biggest exporter this year.

High energy prices have been a drag on growth in much of the world. Although American motorists felt some pain from rising gasoline prices early last year, in America Dodges The Energy Crisis we explained how abundant natural gas has insulated most of America from the experience of western Europe. Massachusetts continues to import LNG at high global prices from foreign countries because of ill-considered opposition to natural gas pipelines.

Tellurian’s Charif Souki has failed to create a second Cheniere. Souki’s compensation is among the highest in the industry in spite of Tellurian’s slumping stock price and diminishing odds of completing its Driftwood LNG facility. His compliant board has embraced pay for performance in advance. We asked What’s Next For Tellurian?

We started posting regular videos last year too. ESG Is A Scam was especially popular.

ESG has become an easy target. The three components (Environmental, Social and Governance) are not bad objectives, and every investor must favor stronger governance. But ranking companies based on “ESG-ness” is a scam perpetuated by companies like S&P creating metrics for corporate qualities. Every company can obtain a good ESG rating because no common standard prevails. The Dow Jones Sustainability Index looks past Lockheed Martin’s business of delivering products that blow up things and people, deeming them worthy of index inclusion year after year.

Our most watched video, What’s the deal with natural gas? explained why it represents the world’s best opportunity to reduce emissions, by phasing out coal. Natural gas investors own the most important element of a successful energy transition. The only way global emissions will fall is if emerging economies led by China reduce their reliance on coal. Natural gas is the clear winner.

We don’t always stick to energy and interest rates. A year ago we calculated that ARKK’s Investors Have In Aggregate Lost Money, because unfortunately the inflows to Cathie Wood’s fund came mostly at high prices. Since then ARKK has lost an additional 60%.

In December we asked Is BREIT Marked To Market? because valuations on its portfolio are both more stable and immune to the travails impacting publicly traded real estate. Perhaps mindful of the incongruity of such stability, their most recent monthly NAV was –1.2%.

Our engagement with you through blog posts and videos is the highest in our history. Continue to post comments, either publicly or directly to me, anytime you’re so moved. We welcome all constructive feedback.

We have three funds that seek to profit from this environment:

Energy Mutual Fund Energy ETF Real Assets Fund


Looking Back on 2022

SL Advisors Talks Markets
Looking Back on 2022
Loading
/

Readers know not to expect bearish views on energy from this blog. A year ago, we offered ten reasons why we thought the outlook was positive (see The Upside Case For Pipelines – Part 1 and Part 2). We were right about the direction but not all our reasons played out. Below is a report card:

1) Investors become convinced financial discipline will continue Grade: A

Growth capex has remained well contained for the most part. The two big Canadians continue to have outsized investment programs, and together make up almost half of the industry’s total even though they’re just over a quarter by market cap. They both have large business segments within Canada that enjoy highly predictable returns, and as a result both trade at a premium (EV/EBITDA) to the market. Wells Fargo expects growth capex to drop from 41% of free cash flow last year to 35% by 2027. Assuming the trend continues, the market is likely to reward the sector.

2) Pragmatism guides the energy transition Grade: B

California and parts of New England continue to pursue self-destructive policies that in effect accommodate continued emissions growth in Asia ex-Japan while enduring higher costs and less reliability. Most other regions of the US are adopting a more balanced approach. Solar and wind were 12% of US power generation in 2021, and 4.7% of total primary energy consumption. There’s much more to energy than generating electricity. The EIA expects solar and wind to reach 16% of power generation in 2023. Thanks to approaches that vary by state, the US energy transition is less disruptive than the European model.


3) Real yields continue to fall Grade: F

Surprisingly (to us), real yields on ten-year treasury notes have risen by 2.5% this year, from –1% to +1.5%. We had felt negative real yields would drive more investors into income-generating assets, including midstream energy infrastructure. Tightening financial conditions were a headwind for almost all sectors, but not energy. Excessive government indebtedness is likely to limit the economy’s tolerance for high interest rates. Real yields will at some point resume their long-term decline.

4) Inflation surprises to the upside Grade: A

The Fed got this spectacularly wrong. A year ago they expected 2022 inflation, as measured by their favored Personal Consumption Expenditures (PCE) index, to run at 2.6%. They’re now at 5.6%. Private forecasters were also mostly wrong. In April JPMorgan was forecasting 2022 CPI of 5.5%, but now they’re at 7.4%. For 2023 the Fed is forecasting 3.1% (PCE) and JPMorgan 2.8% (CPI). This outcome would represent victory for the Fed. Inflation will fall, but the risk to these forecasts remains to the upside.

5) Republican mid-term gains squash any anti-energy sector legislation Grade: C

Poor candidate selection led to muted Republican gains and failure to regain control of the Senate. Regulatory reform that Joe Manchin thought he’d won in exchange for supporting the Inflation Reduction Act has still not passed. The Mountain Valley Pipeline, built but unused, would be the most tangible beneficiary but renewables advocates should recognize that construction of high voltage power lines will also suffer from the current regulatory uncertainty confronting many types of infrastructure construction. Nonetheless, Democrat policies favor energy investors by discouraging capex, thereby boosting cash flow. Hug your local climate protester and drive them to an event.

6) Sector fund flows turn positive Grade: C

Flows into midstream energy infrastructure funds were negative for the sixth straight year, albeit better than 2021 at $1.1BN through November 2022 vs $1.7BN (same period 2021) according to JPMorgan. Wells Fargo estimates 2022 buybacks at $4.8BN, so sales by retail investors are being easily absorbed by the companies themselves. 2023 buybacks are forecast at $5BN. The sector’s increasing cashflow remains a positive flow of funds story.

7) Cyclical factors that are bullish Grade: A

Goldman’s Jeff Currie believes the ESG movement is distorting the normal capex cycle of the energy sector because high commodity prices are not spurring the type of investment in new production that might otherwise be expected. The result is an extended cyclical upswing, benefiting investors if not consumers.

8) Geopolitical factors that might surprise Grade: A

World events that shock usually hurt equity markets. Energy is different, in that conflict often raises prices and makes energy security more valuable. We had no insight about Russia’s invasion of Ukraine, but US LNG exports are an unsurprising winner. For the first half of 2022 the US was the world’s biggest LNG exporter.

9) Covid loses its ability to disrupt Grade: B

The world finally moved on, except for China where rolling citywide lockdowns reduced growth and demand for oil. China’s recent pivot to dump virtually all restrictions will allow the economy to rebound.

10) Energy transition Grade: A

2022 showed the importance of “dispatchable” energy, meaning energy that’s there when you need it as opposed to when the weather permits. Western Europe didn’t scramble to buy more windmills as Russian natural gas flows petered out. They bought more LNG, especially from the US, and consumed more coal. Policymakers are increasingly accepting that solar panels and windmills aren’t the complete solution. Moreover, traditional energy companies are turning out to be vital to reducing greenhouse gas emissions. The Inflation Reduction Act has boosted investment in carbon capture projects. NextDecade is signing contracts to export LNG for which emissions generated during processing have been captured. The energy transition has gone from threatening the energy sector to providing opportunities.

Midstream energy infrastructure had a great year in spite of a few misses on our report card. Fundamentals that were good a year ago remain so. With free cash flow almost 2X dividends, buybacks increasing, and capex still constrained, 5-6% yields still look appealing.

We have three funds that seek to profit from this environment:

Energy Mutual Fund Energy ETF Real Assets Fund
 

Will The January MLP Effect Beat Negative Sentiment?

SL Advisors Talks Markets
Will The January MLP Effect Beat Negative Sentiment?
Loading
/

Consumer sentiment is as bad as 1980 when inflation was 13%. The Fed funds rate swung from 17% to 9% before peaking at 19% in early 1981. Eight US marines died in Iran in a failed attempt to rescue our hostages. John Lennon was shot. No wonder Ronald Reagan won election later that year. Consumers today are more negative than they were back then.

The put/call ratio is close to the extremes of the Great Financial Crisis in 2008 when Bear Stearns was bailed out by JPMorgan and Lehman failed. There’s plenty of negatives, but are prospects really that terrible?

If you’re not yet convinced of pervasive bearishness, how about that for the first time in 25 years US equity strategists are forecasting a down year.

Conventional portfolios did poorly. Diversification and a dollop of fixed income have caused misery. Energy and cash was the improbable winning combination. Meme stocks, tech and bitcoin (useless except when it’s going up) have slumped along with animal spirits.

But everyone who wants a job has one, albeit pay is lagging inflation. We’re not at war, although between Ukraine and Taiwan there’s plenty to worry about. And it looks like we handled covid rather better than China even though they had a head start on us since it originated there.

If today’s outlook compares unfavorably with 2008 or 1980, you have to conclude that people expect more out of life. Warren Buffet famously said that the secret to a happy marriage is to marry someone with low expectations. At moments of marital discord, I’ve pushed my luck by sharing this wisdom with my wife, who retorts that her expectations couldn’t be any lower.

Perhaps happiness in life requires lower expectations than evidenced by survey respondents to the University of Michigan.

The Alerian MLP ETF (AMLP) may be a flawed investment product, but it still has its uses. It serves as a reminder of what an ETF should not be, which is a payer of corporate taxes. As regular readers know, AMLP doesn’t qualify to be exempt from taxes like virtually all ETFs and mutual funds, because it invests almost all its assets in MLPs. Our Byzantine tax code recently led to a 3.9% NAV hit for AMLP investors as its advisor Alps reassessed what they owed (see AMLP Trips Up On Tax Complexity).

AMLP is inadequate as a long-term investment because its taxable structure ensures it will substantially lag its index. But it can still be worthwhile as a short. One example is when market appreciation turns unrealized losses into gains. Upon crossing that threshold the tax drag kicks in, such that it goes up at 79% of its index (ie 1 – the 21% corporate tax rate) but still falls with the market. Such asymmetry can make it a useful hedge on a long portfolio of MLPs or even a good short position (see Uncle Sam Helps You Short AMLP).

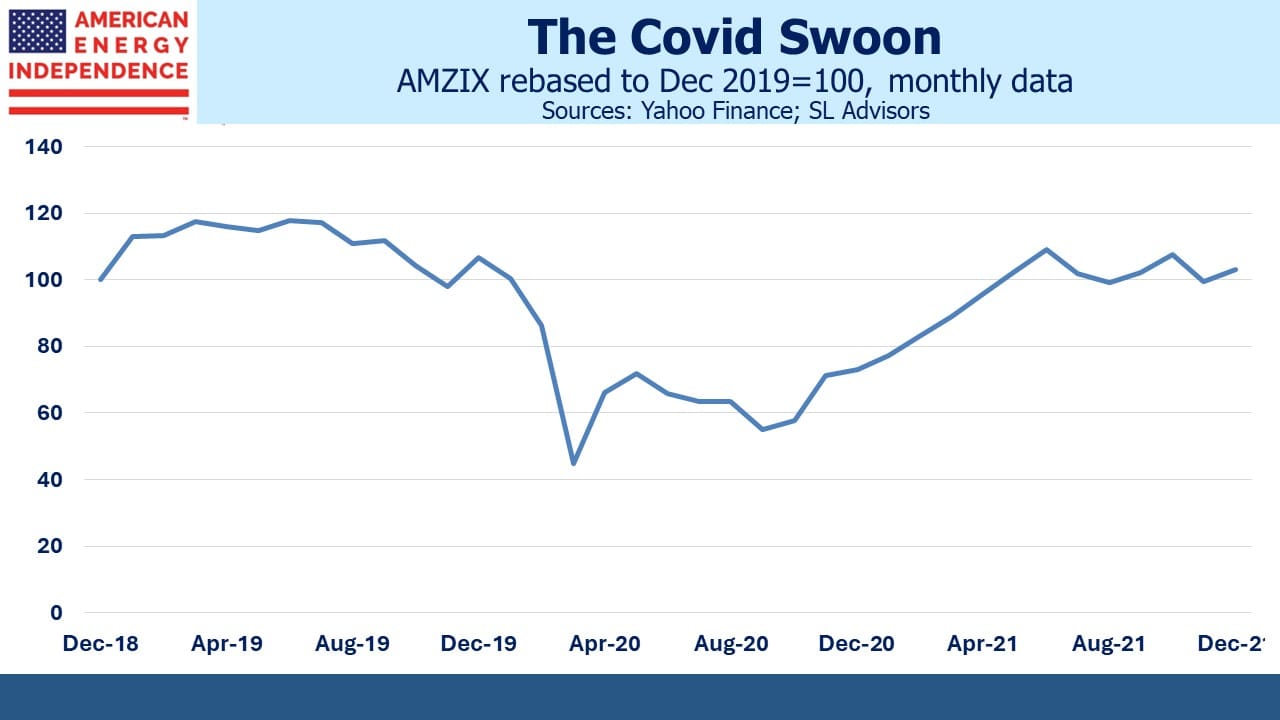
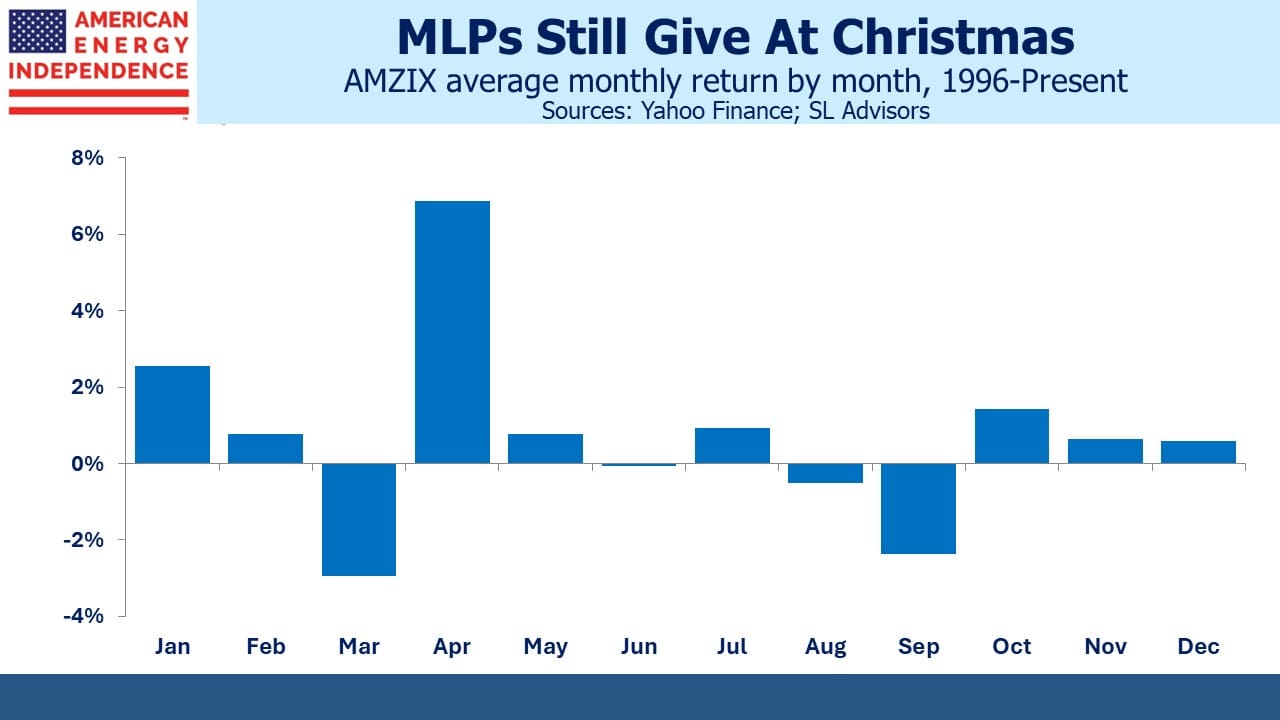
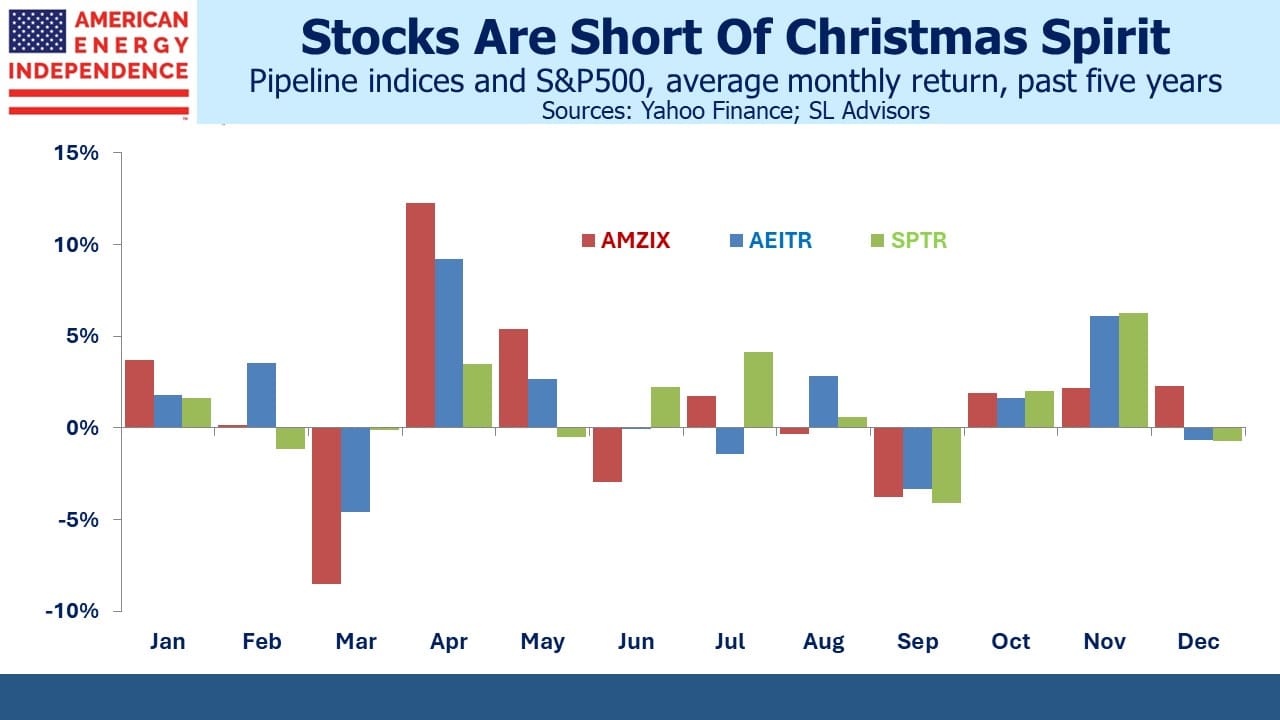
Another trade opportunity exploits the January effect. This used to be a feature of the S&P500 but has disappeared in recent years. It’s not that pronounced for the American Energy Independence Index (AEITR), but still shows up in the Alerian MLP Infrastructure Index (AMZIX), which AMLP seeks to track minus the tax drag and expenses.

The likely reason for a positive start to the year is that MLP holders tend to be K-1 tolerant, US taxable Americans. Because K-1s are a pain in the neck, if you’re contemplating selling an MLP December is better than January because you’ll avoid one last K-1 for the stub year. Similarly, purchases delayed until January avoid a K1 for the last month of the prior year.

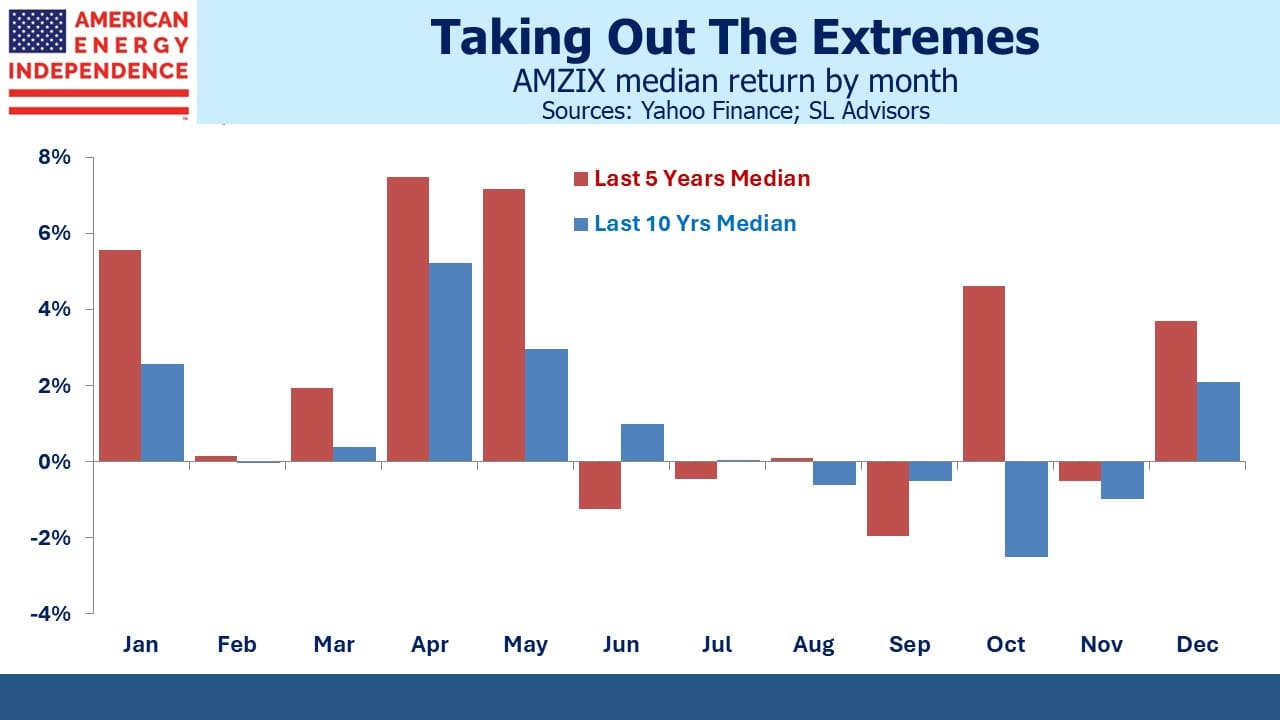
Over the past decade, the AMZIX has averaged +3.3% in January, versus 0.5% for all months. Seven out of ten Januarys were positive, and only one was down more than 5% (2020). On average it’s up around half the time. If you’re inclined towards trading, buying AMLP now and planning to exit next month has an attractive risk/reward. And if you’re thinking of investing in the sector, delay is likely to mean paying higher prices. Just don’t make AMLP a long-term holding, because with its tax structure and absence of the biggest pipeline corporations it’s likely to continue underperforming the sector.

The seasonal January AMLP trade might benefit from a macro backdrop that suggests more investors than usual are hedged, defensive, in cash and hunkered down. In addition, the fundamentals for midstream energy infrastructure remain positive as tirelessly reported on this blog (see Energy – The Only Bright Spot In 2022). And if you already own AMLP, late January could be your best chance to swap it for a fund with a more investor-friendly structure.

We have three funds that seek to profit from this environment:

Energy Mutual Fund Energy ETF Real Assets Fund


image_pdfimage_print