Just In Time Oil

/
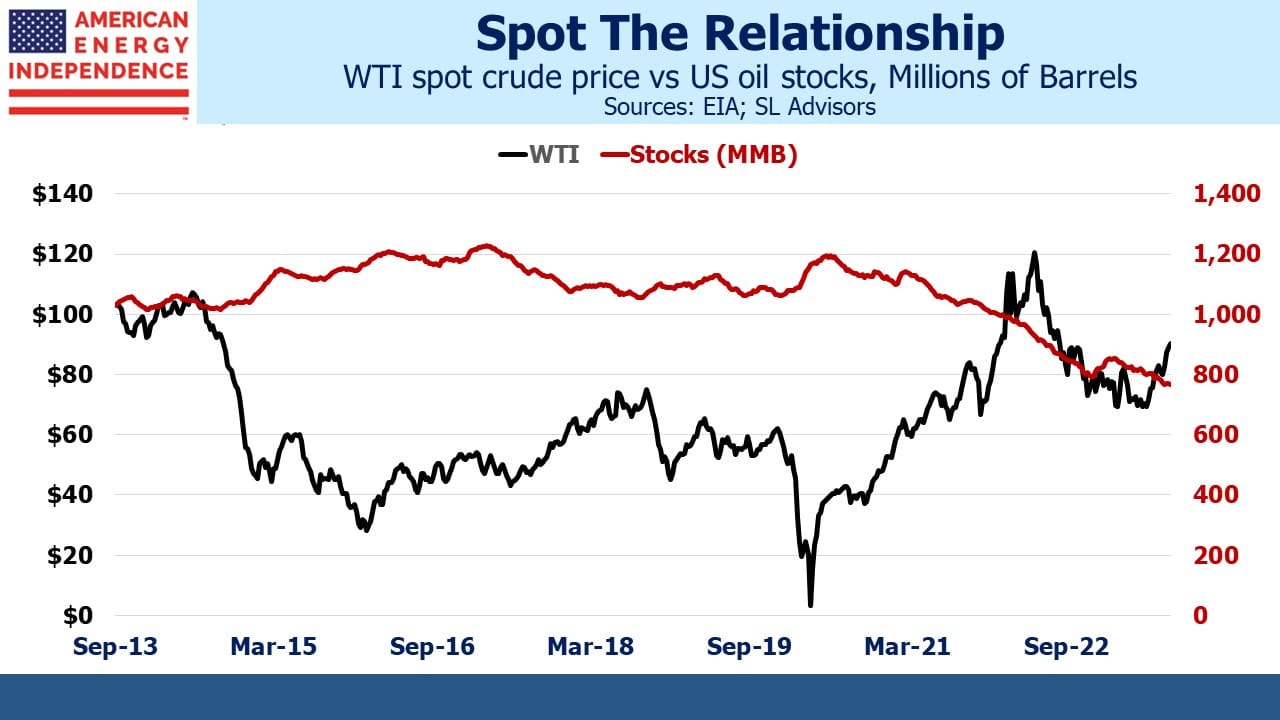
Changes in US oil inventories sometimes cause a sharp move in the price of crude. It makes perfect sense, even if it’s hard to tease out much of a statistical relationship from the data. Oil stocks, meaning oil held in inventory, have been falling since the early days of the pandemic when the collapse in demand left traders scrambling for places to store it. The most recent weekly data showed our inventories are the lowest in almost forty years.
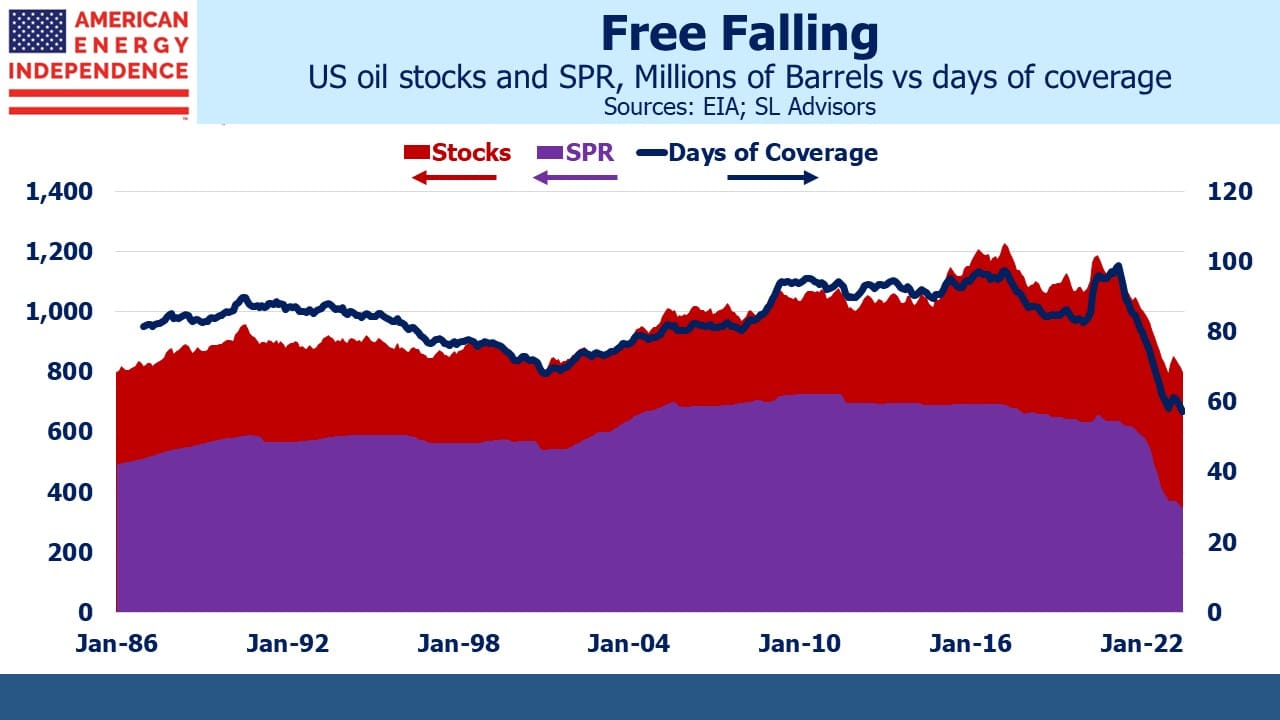
The US Strategic Petroleum Reserve (SPR) has also been falling. Privately held inventories move based on economics, whereas changes in the SPR are a political choice. This was most notable a year ago when high gasoline prices prompted the Administration to release oil to avoid losses in the mid-term elections. Such sales have continued (see Crude Climbs The Wall Of Supply Worries).
So for different reasons, both privately held inventories and the SPR are falling. Historically the two moved more or less independently given their differing objectives. Now, both the Federal government and commercial operators are concluding they need to hold less.
Businesses generally hold inventories of the inputs they need for production and finished goods awaiting sale. Such decisions are made to smooth production lines. Oil has the additional motivation in that speculation on higher prices may increase inventories. And the Federal government has its own, non-commercial goals.
One way to think about inventory adequacy is to measure how many days of domestic consumption could be supported if output and imports stopped. It’s well short of a perfect measure, because it assumes all the oil in storage could seamlessly move to where it’s needed and be of the correct grade to be acceptable to the refineries or other users taking delivery. So the current ratio of total oil in storage divided by average daily consumption of 57 days doesn’t mean inventories could satisfy domestic demand for that long. It’s undoubtedly far less. But it is the lowest ratio on record, going back 37 years. We’re on track to find out what inventory level is too low. Rising crude will tell us we’re there. It may already be happening.
“Just in time inventory” has made manufacturing more efficient. Delivering inputs only when needed to an automobile factory reduces the needed working capital and improves profitability. The decline in privately held oil stocks in recent years combined with stable refinery runs shows a similar improvement in operating efficiency.
Increased domestic oil production reduces our need to hold inventories for energy security. We’re less reliant on imports but because US refineries can’t use all the light shale oil we produce, two-way trade brings in the heavy crude they’re designed for and exports lighter grades. We have enormous inventory underground, accessible when needed.
Domestic production is growing, but slowly. The Baker Hughes oil rig count is at 513, down almost 20% from its peak late last year. Current output remains just shy of the 13 Million barrels per Day record of November 2019.
Exxon Mobil (XOM) is operating 17 rigs, down from 65 four years ago. Energy companies are staying disciplined, unmoved by the recent run up in prices. “If you think about capital efficiency, and you want to make sure you’re thinking long-term about your business, moving [drilling rigs] up and down a lot is not a good idea,” said Jack Williams, a senior vice president at XOM.
Pipeline operators often complain about the difficulties with construction. The experience of Equitrans with Mountain Valley Pipeline (MVP) is perhaps the most famous example of the cost that endless environmental legal challenges can impose on infrastructure projects.
But renewable energy is more urgently dependent on permitting reform because future Infrastructure projects will be concentrated there. We mostly have the oil and gas pipeline network we need, which is why midstream companies are buying back stock and raising dividends.
Wind turbines and solar panels are built in remote, sparsely populated locations. They need long-distance, high voltage transmission lines to move power to population centers. Decarbonizing our energy systems means converting more demand to electricity.
A recent WSJ report showed that more than 10,000 energy projects were awaiting permission to connect to electric grids at the end of last year, almost all wind and solar. The SunZia wind project in New Mexico filed for permits in 2006 and just received the go-ahead to begin construction. America’s system of government creates many opportunities for NIMBY opponents to file legal challenges at the local and state levels as well as federal.
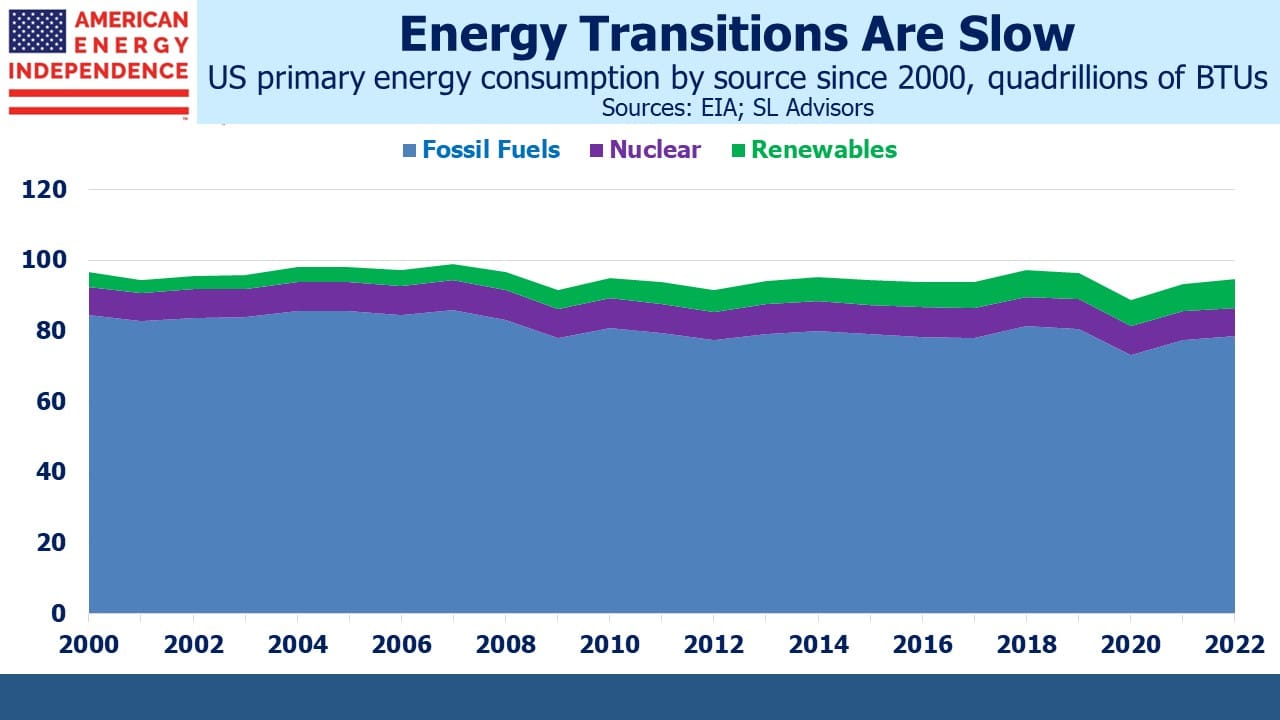
Consequently, 17% of our primary energy comes from carbon-free sources. Half of that is nuclear, which given public resistance is unlikely to grow much. Switching from coal to natural gas for power generation remains our biggest source of reduced greenhouse gas emissions. Ironically, court challenges to new energy infrastructure from environmental extremists represent a significant challenge to renewables.
We three have funds that seek to profit from this environment:

Important Disclosures
The information provided is for informational purposes only and investors should determine for themselves whether a particular service, security or product is suitable for their investment needs. The information contained herein is not complete, may not be current, is subject to change, and is subject to, and qualified in its entirety by, the more complete disclosures, risk factors and other terms that are contained in the disclosure, prospectus, and offering. Certain information herein has been obtained from third party sources and, although believed to be reliable, has not been independently verified and its accuracy or completeness cannot be guaranteed. No representation is made with respect to the accuracy, completeness or timeliness of this information. Nothing provided on this site constitutes tax advice. Individuals should seek the advice of their own tax advisor for specific information regarding tax consequences of investments. Investments in securities entail risk and are not suitable for all investors. This site is not a recommendation nor an offer to sell (or solicitation of an offer to buy) securities in the United States or in any other jurisdiction.
References to indexes and benchmarks are hypothetical illustrations of aggregate returns and do not reflect the performance of any actual investment. Investors cannot invest in an index and do not reflect the deduction of the advisor’s fees or other trading expenses. There can be no assurance that current investments will be profitable. Actual realized returns will depend on, among other factors, the value of assets and market conditions at the time of disposition, any related transaction costs, and the timing of the purchase. Indexes and benchmarks may not directly correlate or only partially relate to portfolios managed by SL Advisors as they have different underlying investments and may use different strategies or have different objectives than portfolios managed by SL Advisors (e.g. The Alerian index is a group MLP securities in the oil and gas industries. Portfolios may not include the same investments that are included in the Alerian Index. The S & P Index does not directly relate to investment strategies managed by SL Advisers.)
This site may contain forward-looking statements relating to the objectives, opportunities, and the future performance of the U.S. market generally. Forward-looking statements may be identified by the use of such words as; “believe,” “expect,” “anticipate,” “should,” “planned,” “estimated,” “potential” and other similar terms. Examples of forward-looking statements include, but are not limited to, estimates with respect to financial condition, results of operations, and success or lack of success of any particular investment strategy. All are subject to various factors, including, but not limited to general and local economic conditions, changing levels of competition within certain industries and markets, changes in interest rates, changes in legislation or regulation, and other economic, competitive, governmental, regulatory and technological factors affecting a portfolio’s operations that could cause actual results to differ materially from projected results. Such statements are forward-looking in nature and involves a number of known and unknown risks, uncertainties and other factors, and accordingly, actual results may differ materially from those reflected or contemplated in such forward-looking statements. Prospective investors are cautioned not to place undue reliance on any forward-looking statements or examples. None of SL Advisors LLC or any of its affiliates or principals nor any other individual or entity assumes any obligation to update any forward-looking statements as a result of new information, subsequent events or any other circumstances. All statements made herein speak only as of the date that they were made. r
Certain hyperlinks or referenced websites on the Site, if any, are for your convenience and forward you to third parties’ websites, which generally are recognized by their top level domain name. Any descriptions of, references to, or links to other products, publications or services does not constitute an endorsement, authorization, sponsorship by or affiliation with SL Advisors LLC with respect to any linked site or its sponsor, unless expressly stated by SL Advisors LLC. Any such information, products or sites have not necessarily been reviewed by SL Advisors LLC and are provided or maintained by third parties over whom SL Advisors LLC exercise no control. SL Advisors LLC expressly disclaim any responsibility for the content, the accuracy of the information, and/or quality of products or services provided by or advertised on these third-party sites.
All investment strategies have the potential for profit or loss. Different types of investments involve varying degrees of risk, and there can be no assurance that any specific investment will be suitable or profitable for a client’s investment portfolio.
Past performance of the American Energy Independence Index is not indicative of future returns.


Leave a Reply
Want to join the discussion?Feel free to contribute!