Why Are Real Yields Rising?

/
The members of the Federal Open Market Committee (FOMC) could be forgiven for feelings of quiet satisfaction. They’ve raised short term rates higher than most observers expected, and odds of the consequent recession have been receding. The increase in the unemployment rate to 3.8% on Friday leaves it still well below full employment. Yet inflation expectations remain well contained. The University of Michigan survey reports a five year outlook of 3%. Republicans (3.3%) are more pessimistic than Democrats (2.7%), but members of the White House’s incumbent party are generally more willing to think things will work out.
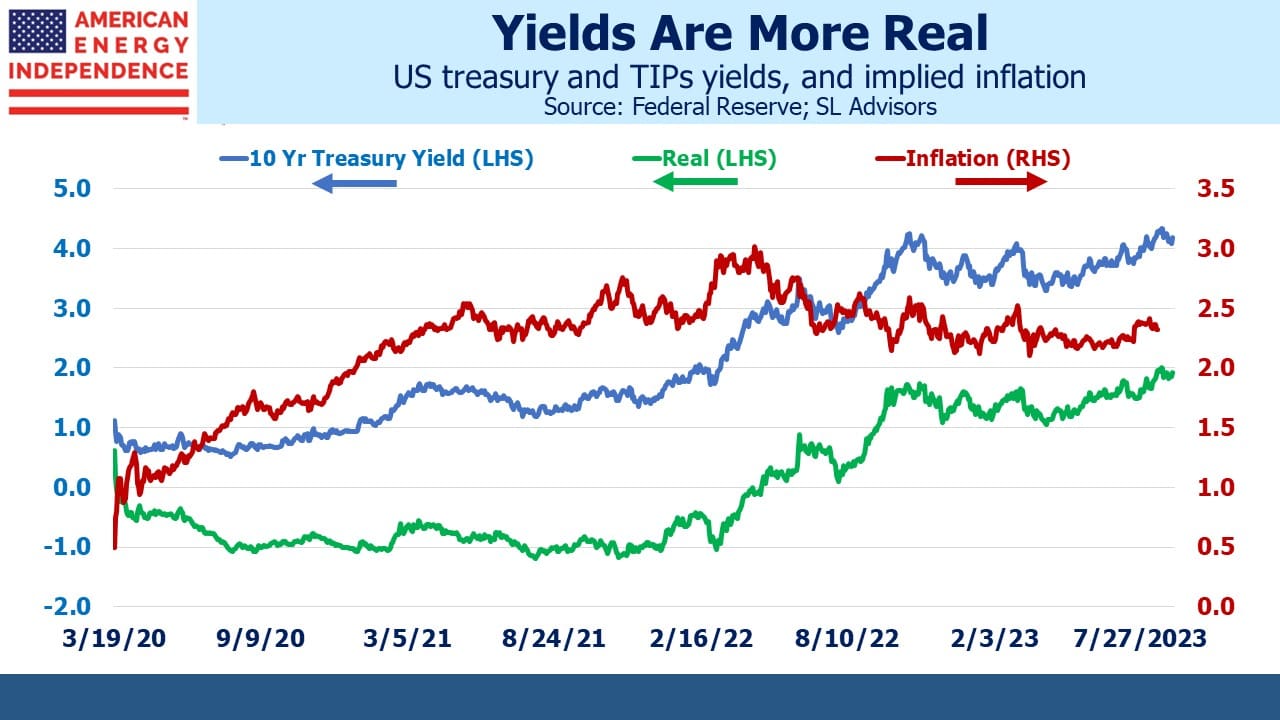
Inflation expectations from the bond market tell a similar story, with ten year inflation derived from TIPs at 2.3%. All this is consistent with a Personal Consumption Expenditures (PCE) deflator of 2%, since its construction means it tends to run a little lower than the CPI that most people rely on. Fed credibility remains intact.
But there’s always something to worry about. Because the ten year treasury yield has drifted up to 4.25% while the inflation outlook hasn’t changed, it means real yields have risen to almost 2%. As recently as eighteen months ago real yields were negative. The distorting effect of central banks and other return-insensitive investors was sufficient to guarantee a loss of purchasing power on buyers. The current 2% real yield is close to the long term real return on treasuries.
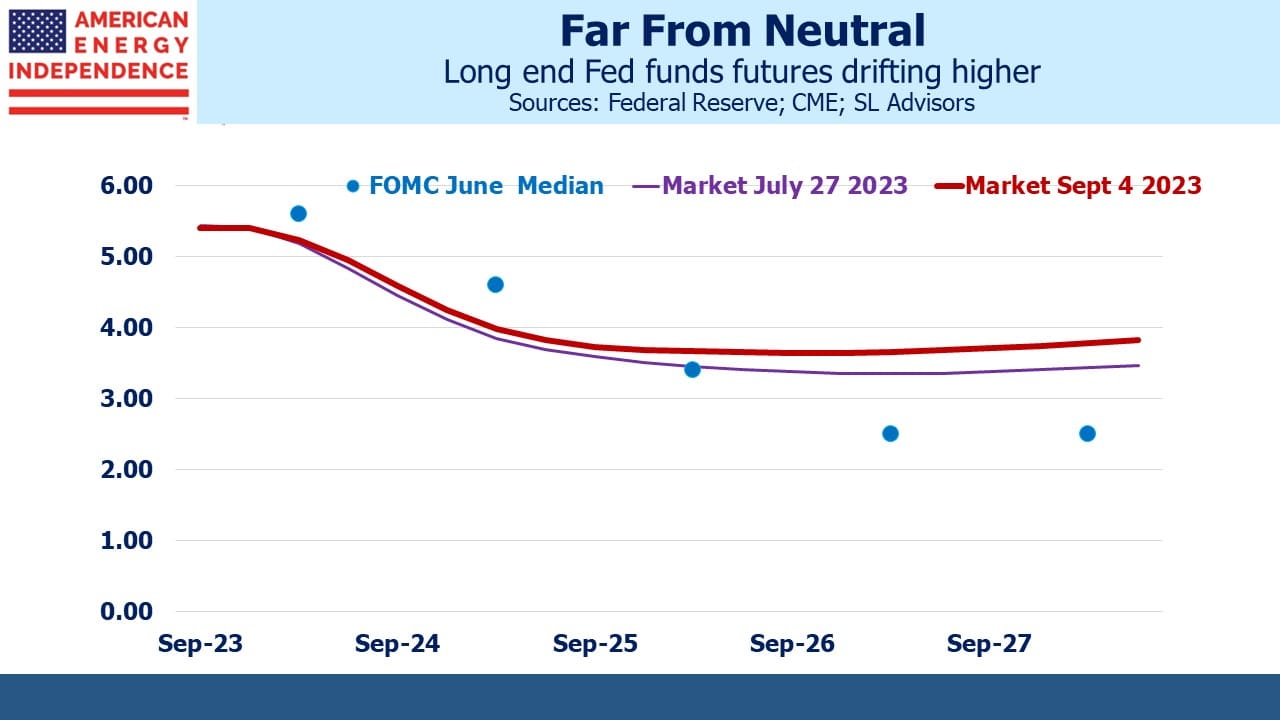
Near term SOFR futures have barely moved over the past few weeks. Contracts five years out and longer have borne most of the upward adjustment caused by the increase in treasury yields.
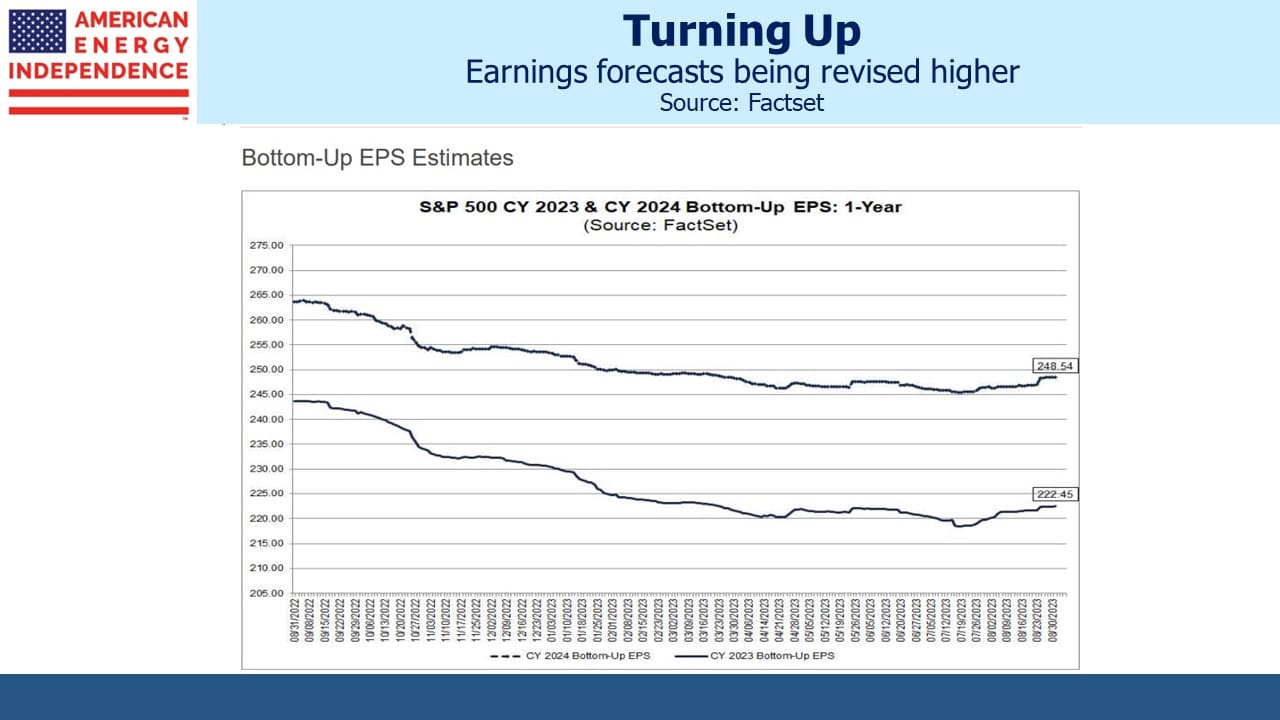
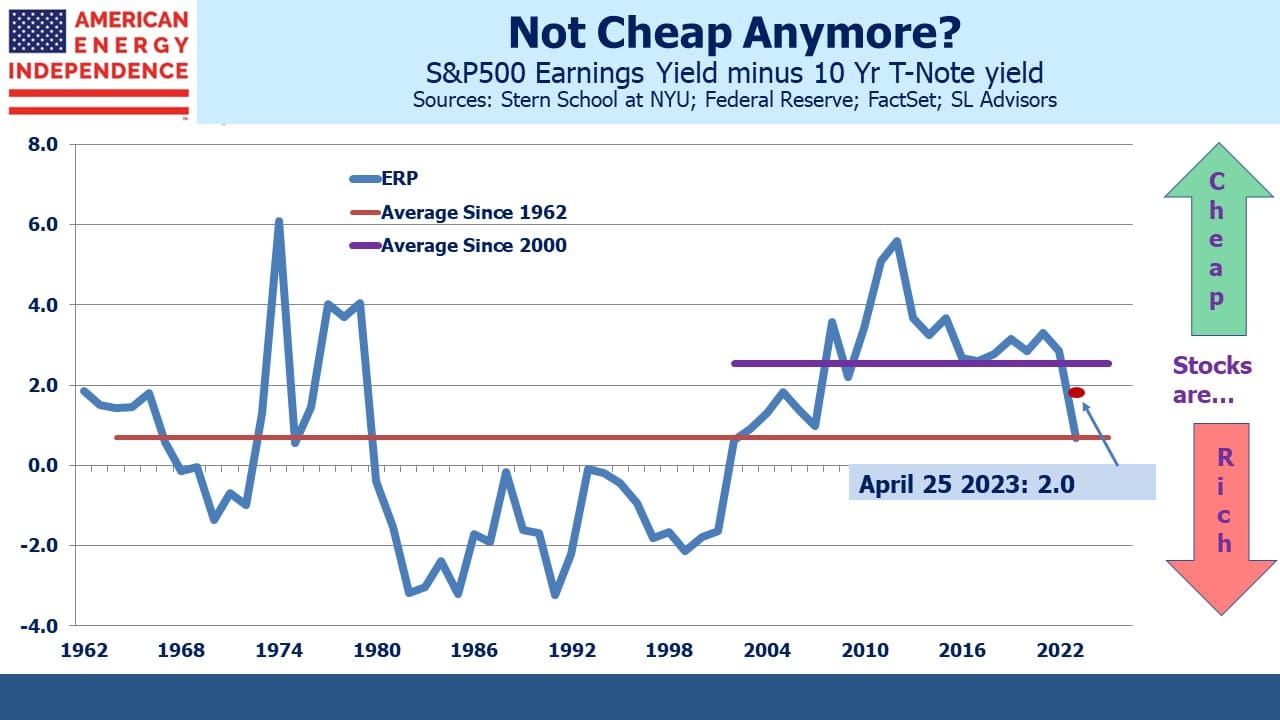
JPMorgan revised up their 3Q23 GDP forecast to 3.5%. A few months ago they were among those forecasting a mild recession by year’s end, something they no longer expect. Factset bottom-up earnings forecasts have started to edge higher. It’s just as well, because the Equity Risk Premium (ERP), defined here as the difference between the yields on S&P500 earnings and ten year treasuries, makes stocks look as expensive as at any time in the past two decades.
The corollary to an expensive equity market is that bonds are cheap. It’s not something you see often on this blog, but treasuries look more attractive relative to stocks than in a long time. We wouldn’t suggest switching, because the poor US fiscal outlook makes inflation a long-term risk and fixed income investments won’t offer much protection.
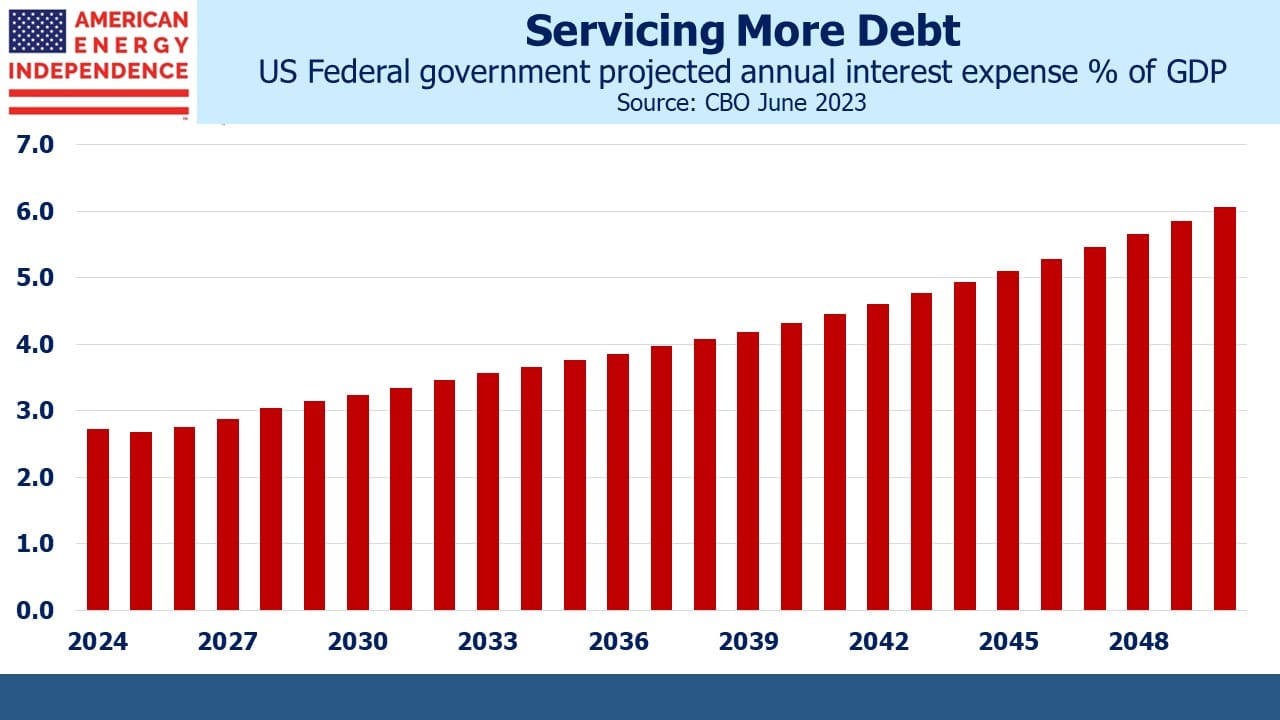
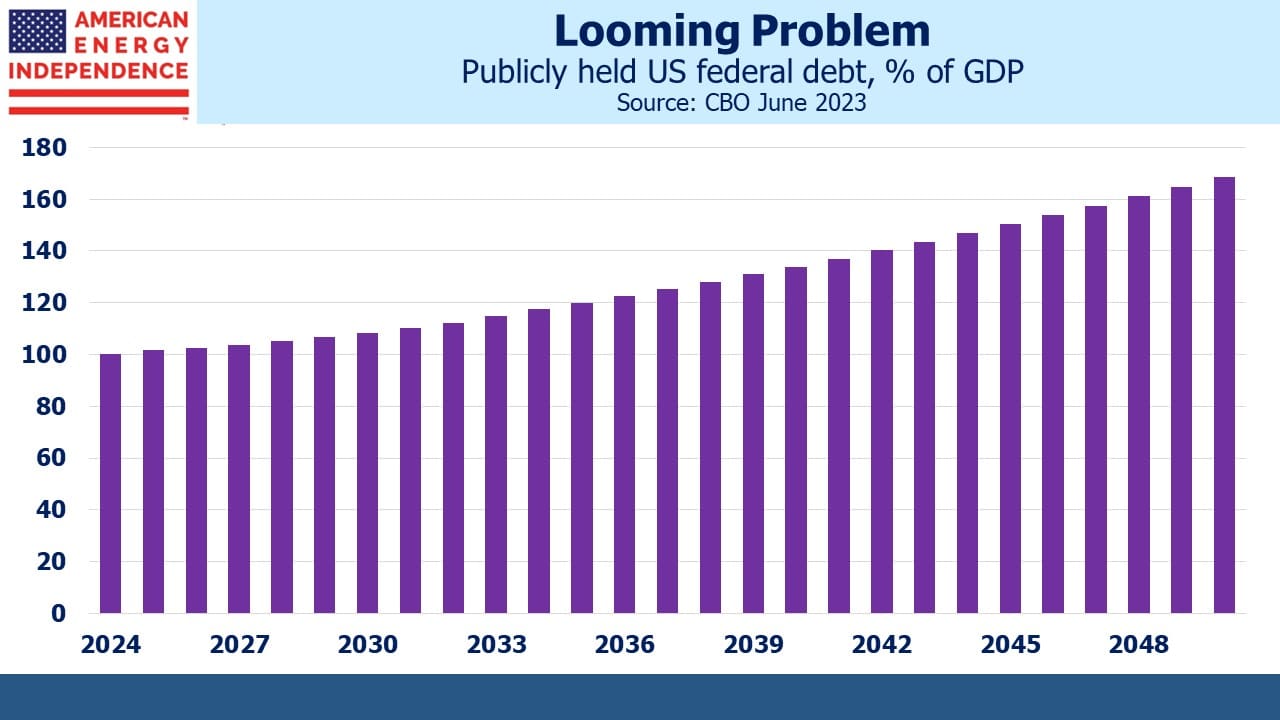
Interest expense on the US federal debt is forecast to more than double as a percentage of GDP over the next 25 years, according to the Congressional Budget Office. Publicly held debt will rise from 100% of GDP to 169% over the same period. One of the mysteries of finance is how long term US interest rates have maintained levels seemingly oblivious to our helpless profligacy. Thirty year bonds at 4.4% can only be justified by substantial demand from buyers willing to ignore that. As well as central banks, there are sovereign wealth funds with hundreds of $BNs to invest satisfied simply with the assurance of getting their money back. Add pension funds with inflexible mandates that continued to require a fixed income holding even when yields were below 1%.
Even US banks adopted the same behavior during QE, which is why Silicon Valley Bank failed and why the industry had $515BN in unrealized losses on securities in the first quarter, albeit with an improving trend since 3Q22.
However, there are signs that the appetite for bonds among those that care least about the return may be waning, which is allowing real yields to rise. Kevin Coldiron is a long-time friend and retired hedge fund manager who is now a finance lecturer at UC Berkeley and co-authored The Rise of Carry. Kevin writes thoughtfully on financial markets, and a recent blog post Inflation in the Twenty-First Century Part III: A Circular Flow No Longer addresses this issue.
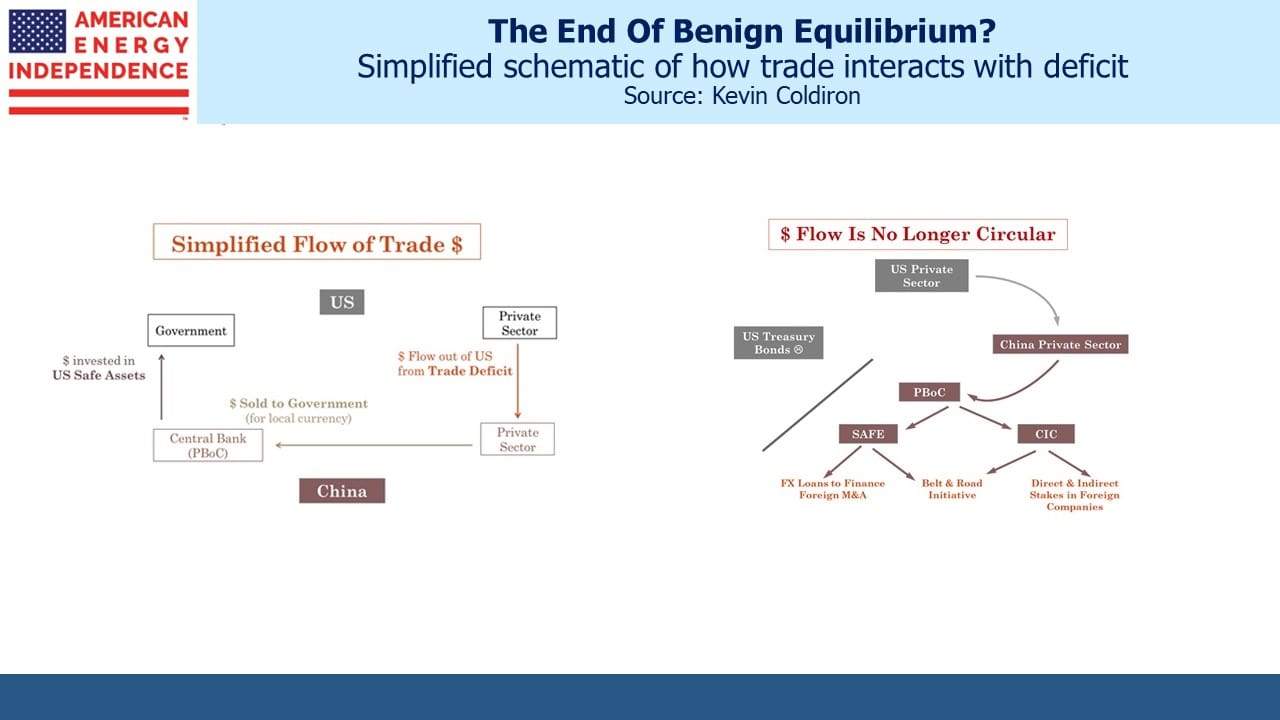
For decades the US has run a trade deficit. In aggregate, this leaves the world’s exporters with more US$ than they need, and some of them get reinvested back into US treasuries. It’s often pointed out that a trade deficit requires financing by foreigners, through asset sales or debt issuance, because our exports don’t generate enough foreign currency to pay for our imports.
Kevin neatly displays this in the first of his two charts. But he goes on to suggest that this happy state of affairs may be ending. China is reducing its holdings of US treasuries. Perhaps the sanctions imposed on Russia following its invasion of Ukraine was a factor. A $1.1TN investment in US government bonds doesn’t look like a smart move for a country pledged at some point to reunify with Taiwan.
The Federal Reserve is also shrinking its balance sheet, albeit ponderously.
There’s little reason to expect real yields to stop rising. 2% is simply the long run average. It’s only high compared with the past few years. The factors causing China and the Fed to cut back will remain indefinitely. Maybe the bond market, which is far bigger now than in 1994 when Jim Carville famously said it could “intimidate everybody,” is about to command more of our attention.
We have three funds that seek to profit from this environment:

Important Disclosures
The information provided is for informational purposes only and investors should determine for themselves whether a particular service, security or product is suitable for their investment needs. The information contained herein is not complete, may not be current, is subject to change, and is subject to, and qualified in its entirety by, the more complete disclosures, risk factors and other terms that are contained in the disclosure, prospectus, and offering. Certain information herein has been obtained from third party sources and, although believed to be reliable, has not been independently verified and its accuracy or completeness cannot be guaranteed. No representation is made with respect to the accuracy, completeness or timeliness of this information. Nothing provided on this site constitutes tax advice. Individuals should seek the advice of their own tax advisor for specific information regarding tax consequences of investments. Investments in securities entail risk and are not suitable for all investors. This site is not a recommendation nor an offer to sell (or solicitation of an offer to buy) securities in the United States or in any other jurisdiction.
References to indexes and benchmarks are hypothetical illustrations of aggregate returns and do not reflect the performance of any actual investment. Investors cannot invest in an index and do not reflect the deduction of the advisor’s fees or other trading expenses. There can be no assurance that current investments will be profitable. Actual realized returns will depend on, among other factors, the value of assets and market conditions at the time of disposition, any related transaction costs, and the timing of the purchase. Indexes and benchmarks may not directly correlate or only partially relate to portfolios managed by SL Advisors as they have different underlying investments and may use different strategies or have different objectives than portfolios managed by SL Advisors (e.g. The Alerian index is a group MLP securities in the oil and gas industries. Portfolios may not include the same investments that are included in the Alerian Index. The S & P Index does not directly relate to investment strategies managed by SL Advisers.)
This site may contain forward-looking statements relating to the objectives, opportunities, and the future performance of the U.S. market generally. Forward-looking statements may be identified by the use of such words as; “believe,” “expect,” “anticipate,” “should,” “planned,” “estimated,” “potential” and other similar terms. Examples of forward-looking statements include, but are not limited to, estimates with respect to financial condition, results of operations, and success or lack of success of any particular investment strategy. All are subject to various factors, including, but not limited to general and local economic conditions, changing levels of competition within certain industries and markets, changes in interest rates, changes in legislation or regulation, and other economic, competitive, governmental, regulatory and technological factors affecting a portfolio’s operations that could cause actual results to differ materially from projected results. Such statements are forward-looking in nature and involves a number of known and unknown risks, uncertainties and other factors, and accordingly, actual results may differ materially from those reflected or contemplated in such forward-looking statements. Prospective investors are cautioned not to place undue reliance on any forward-looking statements or examples. None of SL Advisors LLC or any of its affiliates or principals nor any other individual or entity assumes any obligation to update any forward-looking statements as a result of new information, subsequent events or any other circumstances. All statements made herein speak only as of the date that they were made. r
Certain hyperlinks or referenced websites on the Site, if any, are for your convenience and forward you to third parties’ websites, which generally are recognized by their top level domain name. Any descriptions of, references to, or links to other products, publications or services does not constitute an endorsement, authorization, sponsorship by or affiliation with SL Advisors LLC with respect to any linked site or its sponsor, unless expressly stated by SL Advisors LLC. Any such information, products or sites have not necessarily been reviewed by SL Advisors LLC and are provided or maintained by third parties over whom SL Advisors LLC exercise no control. SL Advisors LLC expressly disclaim any responsibility for the content, the accuracy of the information, and/or quality of products or services provided by or advertised on these third-party sites.
All investment strategies have the potential for profit or loss. Different types of investments involve varying degrees of risk, and there can be no assurance that any specific investment will be suitable or profitable for a client’s investment portfolio.
Past performance of the American Energy Independence Index is not indicative of future returns.


Leave a Reply
Want to join the discussion?Feel free to contribute!