Why Staying Warm In Boston Will Cost You
We spent last weekend in Boston with our daughter, who’s at school there and just turned 21. We visited the Mapparium, a glass spherical room that has the visitor standing inside the globe, with the world’s countries as in the 1930s (i.e. much of Africa was controlled by European powers and India had not yet gained independence from Britain).
It’s a cool experience. The Mapparium highlights features often not apparent on a 2D map – Greenland and Madagascar are approximately the same size; Britain is further north than Nova Scotia but enjoys a milder climate thanks to the Gulfstream; Russia sits at roughly the same latitudes as Canada; and Naples, FL is approximately on the same latitude as Riyadh, Saudi Arabia, even though the latter is often at least 20 degrees F hotter. Visiting the Mapparium, in the Mary Baker Eddy Museum, can be done in an hour or less and is worth the visit.
Visiting New England reminded me of the region’s dysfunctional energy policies. Unwilling to allow natural gas to be transported by pipeline from the Marcellus shale in Pennsylvania, Boston has in the past relied on imported Liquified Natural Gas (LNG) from Russia. The US has been mostly spared the impact of the energy crisis engulfing Europe and Asia.
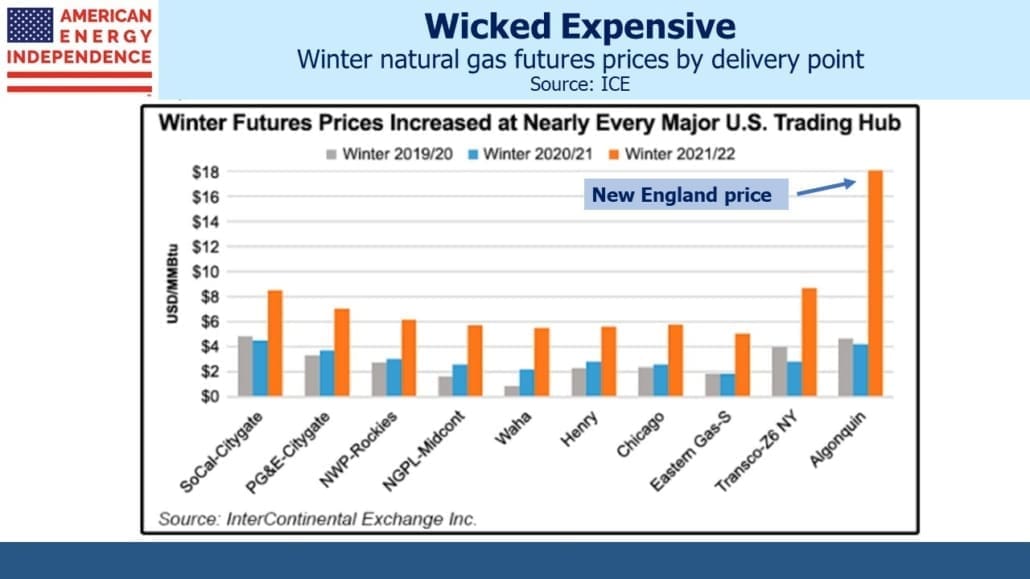
This winter that will change as high natural gas prices increase the cost of heating homes and businesses. New Englanders will feel it more acutely than most based on futures prices.
Favoring imports from our geopolitical rival rather than Pennsylvania means they’ll soon be following LNG prices in Europe and Asia, since that’s who they’ll be competing with to stay warm.
Once again, energy policies designed with little more thought than a Greta soundbite will see the region paying 2-3X what they could for natural gas if they favored domestic supply over foreign. Residents are getting used to it (see An Expensive, Greenish Energy Strategy).
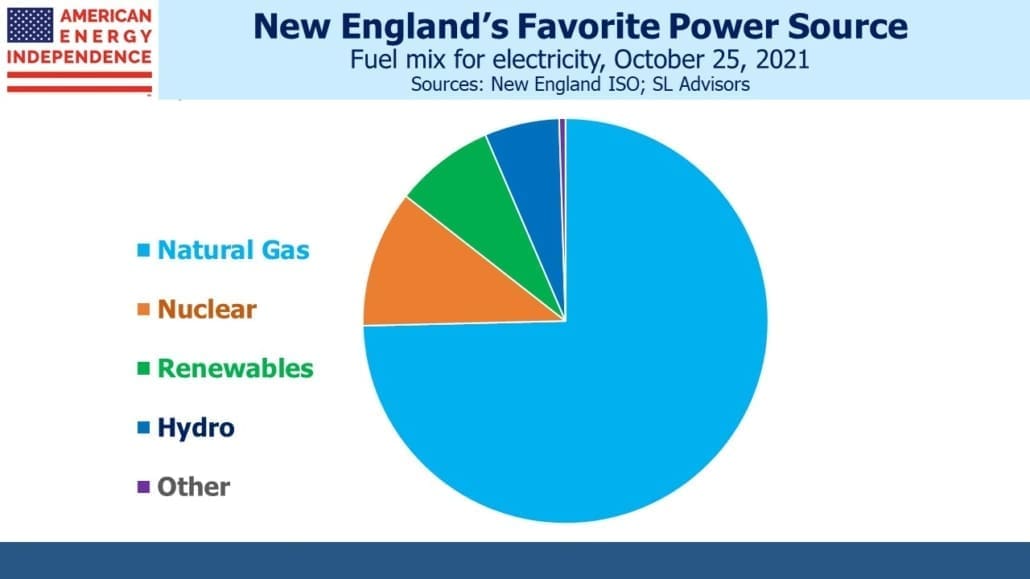
On Monday, the New England Independent System Operator (ISO) reported 74% of its power was being generated using natural gas and 8% renewables. It’s remarkable they can still access that much natural gas given opposition in the region from environmental extremists, but they need to keep the lights on even at the risk of their ESG credentials.
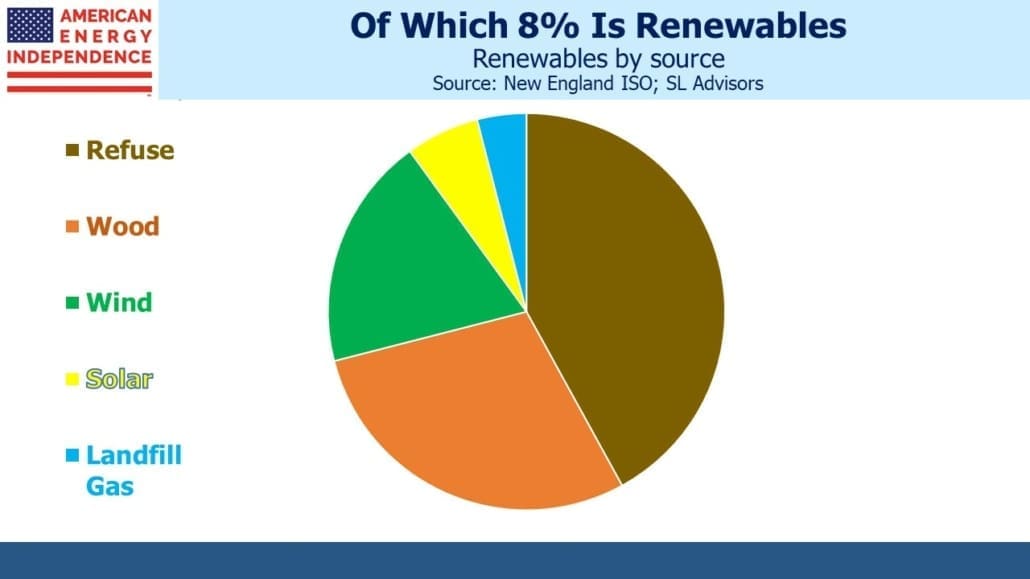
Of the 8% that was from renewable sources, the biggest share was from refuse. Solar and wind were providing around a quarter of renewables so 2% of the ISO’s power — about the same as wood, the burning of which can be more harmful than coal.
New England has the same misguided strategy as Britain (see The Cool North Sea Breeze Lifting US Coal) of believing renewables would compensate for self-imposed reduced access to natural gas. Theirs is another example that should inspire no emulation. But as natural gas pipeline investors, we find ourselves in broad alignment with their results (higher natural gas demand) if not their goals.
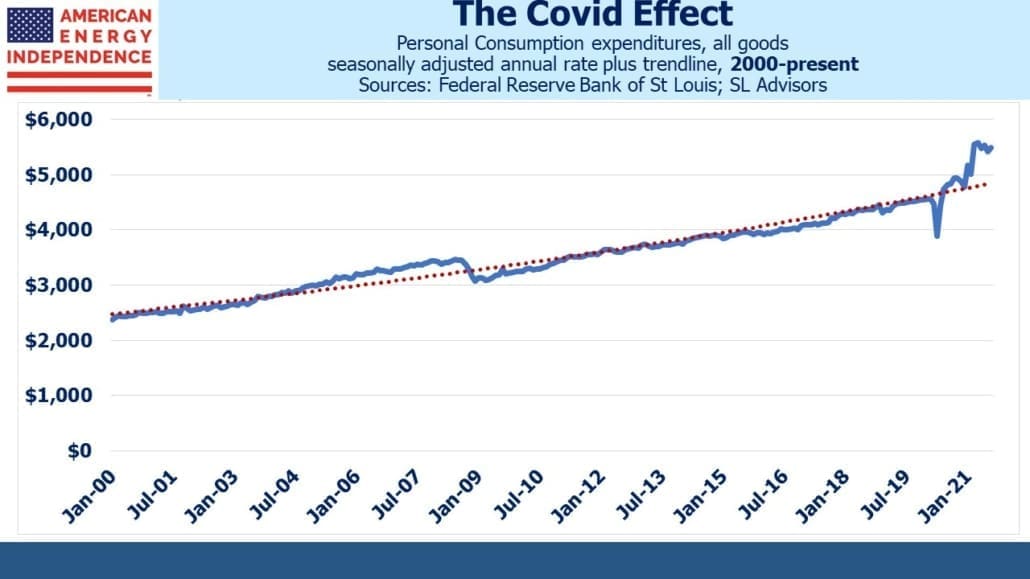
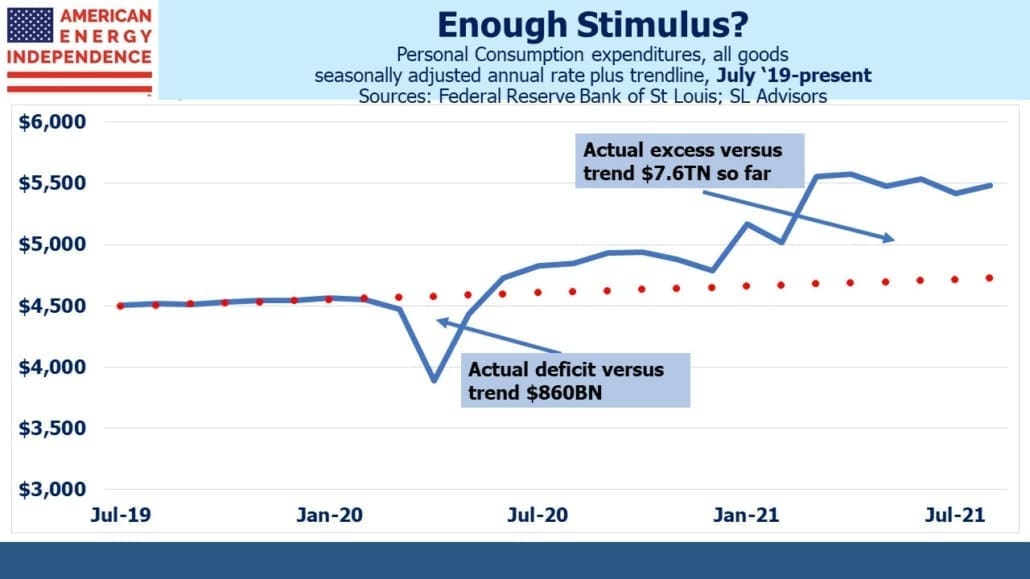
Switching gears, the chart showing Personal Consumption Expenditures (PCE) on durable and non-durable goods provides further evidence that enormous fiscal and monetary stimulus have put the US economy on a faster, more inflationary growth path than pre-Covid.
The trendline over two decades provides a reasonable estimate of the drop in PCE (all goods) caused by Covid. The area beneath the trendline represents $860BN of purchases. Since then, Federal stimulus has driven an excess of consumption over this trendline of $7.6TN, almost 9X the shortfall. And that’s so far – future consumption is unlikely to immediately revert back to trend.
It’s another example of how the initial US fiscal and monetary response to Covid, which was appropriate, morphed into an enormous handout which continues to distort much of today’s economy. Labor and housing are the two biggest examples. The unprecedented number of openings as detailed in Sunday’s blog shows that the labor market is struggling with a skills/location mismatch not a shortage of jobs (see Life Without The Bond Vigilantes). Everyone except the FOMC seems to understand that the housing market has been goosed higher by continued buying of mortgage backed securities.
The Federal Reserve is losing any credibility it may have had on inflation. Their singular focus on restoring the shortfall of five million jobs lost since pre-covid is creating all the upside risk on inflation that is confronting investors.
In recent months the energy transition and the exposure of the Federal Reserve’s inflation-seeking agenda have come together as twin threats to the stability of purchasing power. The term “irrational exuberance” was famously coined by Alan Greenspan in the late 1990s to describe the dot.com bubble, and it’s become part of the investment manager’s lexicon. For example, we often describe the pipeline sector as being completely devoid of any exuberance whatsoever, which is why it’s likely to keep rising. Similarly, one of Jay Powell’s less damaging contributions to financial history will be the re-defining of “transitory”, to mean something that is likely to persist longer than expected.
We have three funds that seek to profit from this environment:
Important Disclosures
The information provided is for informational purposes only and investors should determine for themselves whether a particular service, security or product is suitable for their investment needs. The information contained herein is not complete, may not be current, is subject to change, and is subject to, and qualified in its entirety by, the more complete disclosures, risk factors and other terms that are contained in the disclosure, prospectus, and offering. Certain information herein has been obtained from third party sources and, although believed to be reliable, has not been independently verified and its accuracy or completeness cannot be guaranteed. No representation is made with respect to the accuracy, completeness or timeliness of this information. Nothing provided on this site constitutes tax advice. Individuals should seek the advice of their own tax advisor for specific information regarding tax consequences of investments. Investments in securities entail risk and are not suitable for all investors. This site is not a recommendation nor an offer to sell (or solicitation of an offer to buy) securities in the United States or in any other jurisdiction.
References to indexes and benchmarks are hypothetical illustrations of aggregate returns and do not reflect the performance of any actual investment. Investors cannot invest in an index and do not reflect the deduction of the advisor’s fees or other trading expenses. There can be no assurance that current investments will be profitable. Actual realized returns will depend on, among other factors, the value of assets and market conditions at the time of disposition, any related transaction costs, and the timing of the purchase. Indexes and benchmarks may not directly correlate or only partially relate to portfolios managed by SL Advisors as they have different underlying investments and may use different strategies or have different objectives than portfolios managed by SL Advisors (e.g. The Alerian index is a group MLP securities in the oil and gas industries. Portfolios may not include the same investments that are included in the Alerian Index. The S & P Index does not directly relate to investment strategies managed by SL Advisers.)
This site may contain forward-looking statements relating to the objectives, opportunities, and the future performance of the U.S. market generally. Forward-looking statements may be identified by the use of such words as; “believe,” “expect,” “anticipate,” “should,” “planned,” “estimated,” “potential” and other similar terms. Examples of forward-looking statements include, but are not limited to, estimates with respect to financial condition, results of operations, and success or lack of success of any particular investment strategy. All are subject to various factors, including, but not limited to general and local economic conditions, changing levels of competition within certain industries and markets, changes in interest rates, changes in legislation or regulation, and other economic, competitive, governmental, regulatory and technological factors affecting a portfolio’s operations that could cause actual results to differ materially from projected results. Such statements are forward-looking in nature and involves a number of known and unknown risks, uncertainties and other factors, and accordingly, actual results may differ materially from those reflected or contemplated in such forward-looking statements. Prospective investors are cautioned not to place undue reliance on any forward-looking statements or examples. None of SL Advisors LLC or any of its affiliates or principals nor any other individual or entity assumes any obligation to update any forward-looking statements as a result of new information, subsequent events or any other circumstances. All statements made herein speak only as of the date that they were made. r
Certain hyperlinks or referenced websites on the Site, if any, are for your convenience and forward you to third parties’ websites, which generally are recognized by their top level domain name. Any descriptions of, references to, or links to other products, publications or services does not constitute an endorsement, authorization, sponsorship by or affiliation with SL Advisors LLC with respect to any linked site or its sponsor, unless expressly stated by SL Advisors LLC. Any such information, products or sites have not necessarily been reviewed by SL Advisors LLC and are provided or maintained by third parties over whom SL Advisors LLC exercise no control. SL Advisors LLC expressly disclaim any responsibility for the content, the accuracy of the information, and/or quality of products or services provided by or advertised on these third-party sites.
All investment strategies have the potential for profit or loss. Different types of investments involve varying degrees of risk, and there can be no assurance that any specific investment will be suitable or profitable for a client’s investment portfolio.
Past performance of the American Energy Independence Index is not indicative of future returns.



It is astonishing that there is still heating in New England by burning wood, just as in cave man (sorry, I mean cave person) times.