G20 Confronts Environmental Reality

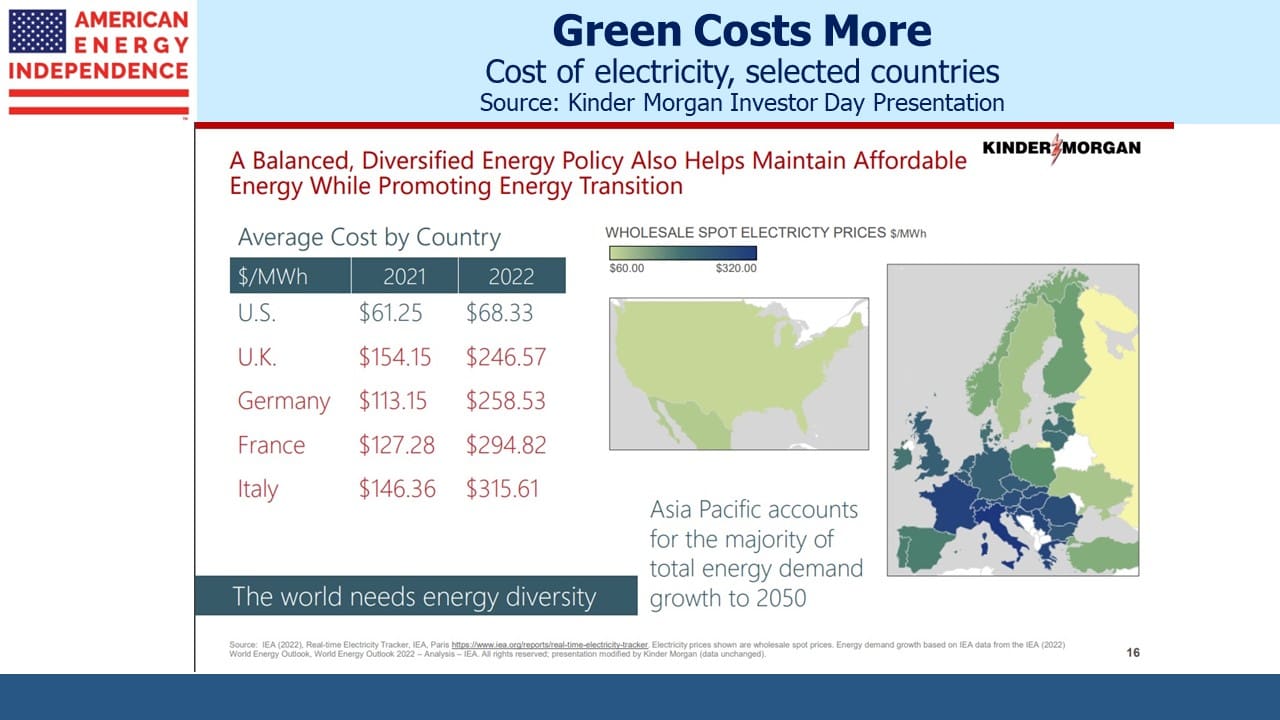
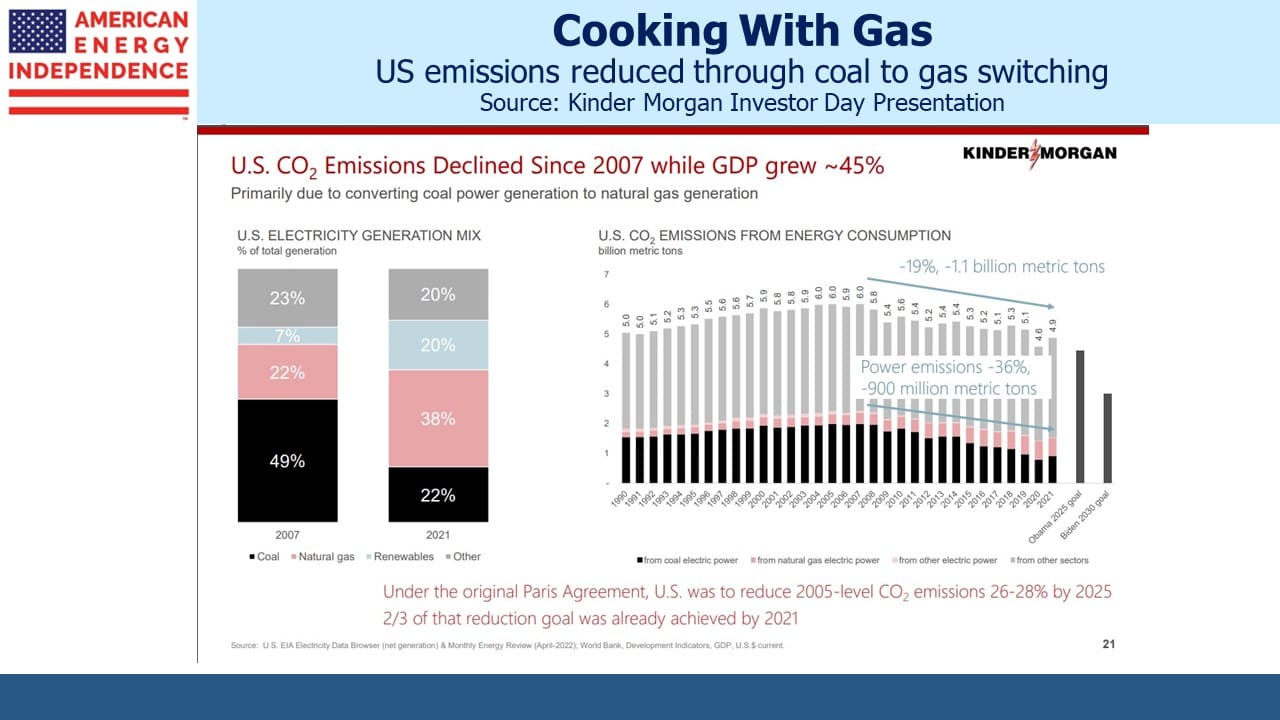
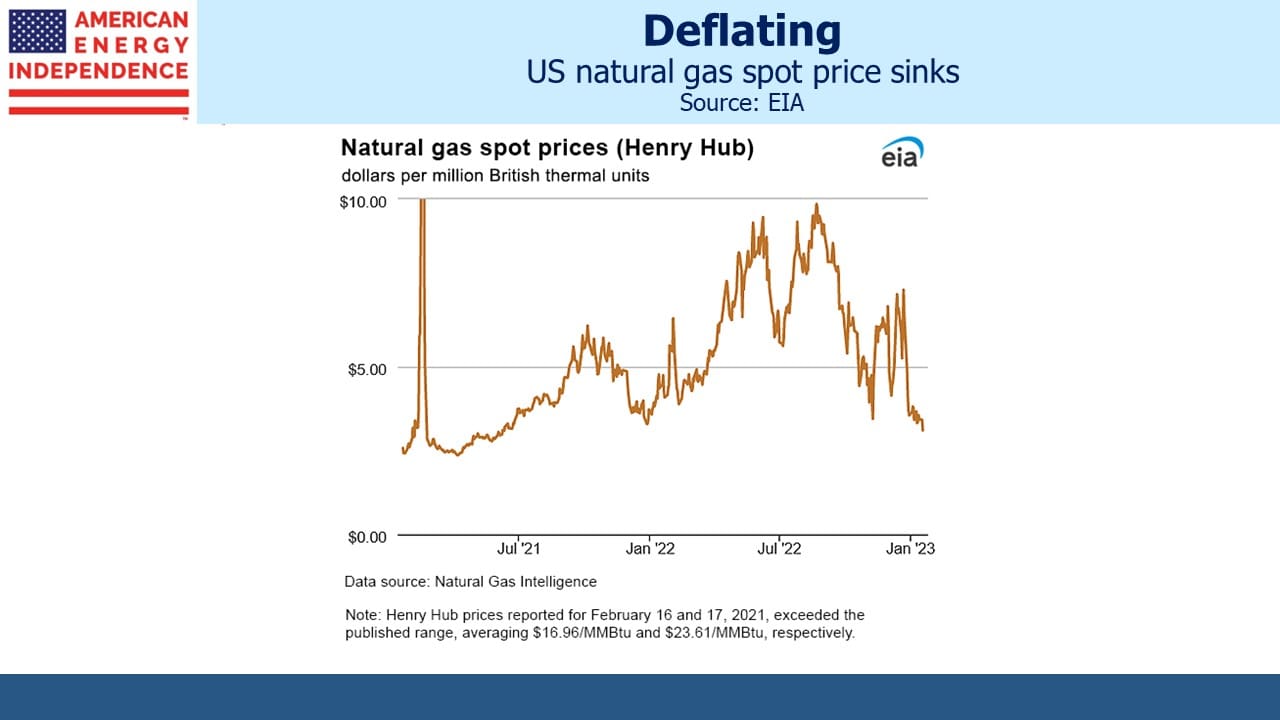
Last week’s meeting of G20 environment ministers to discuss global warming exposed fault lines in the rich world/poor world debate about climate change. Most notably, they couldn’t agree to phase out coal, even though this is the most effective step nations could take to reduce emissions of Global Greenhouse Gases (GHGs). Coal burning power plants can be replaced with natural gas. The US has done this successfully for over a decade, although progress has stalled this year due to higher natural gas prices.

China draws accolades for its huge investments in solar and wind. Last year they reportedly added 120GW of solar and wind power, although analysts were skeptical about the about the figure’s veracity. China has adopted a goal of being carbon neutral by 2060, so you would think that phasing out coal would be consistent with this goal.

But China’s refusal to make such a commitment reveals their other climate commitments to be less than solid. From the origins of the Covid pandemic to supporting cyberattacks, the Chinese government provides plenty of reasons for their public statements to be disbelieved.

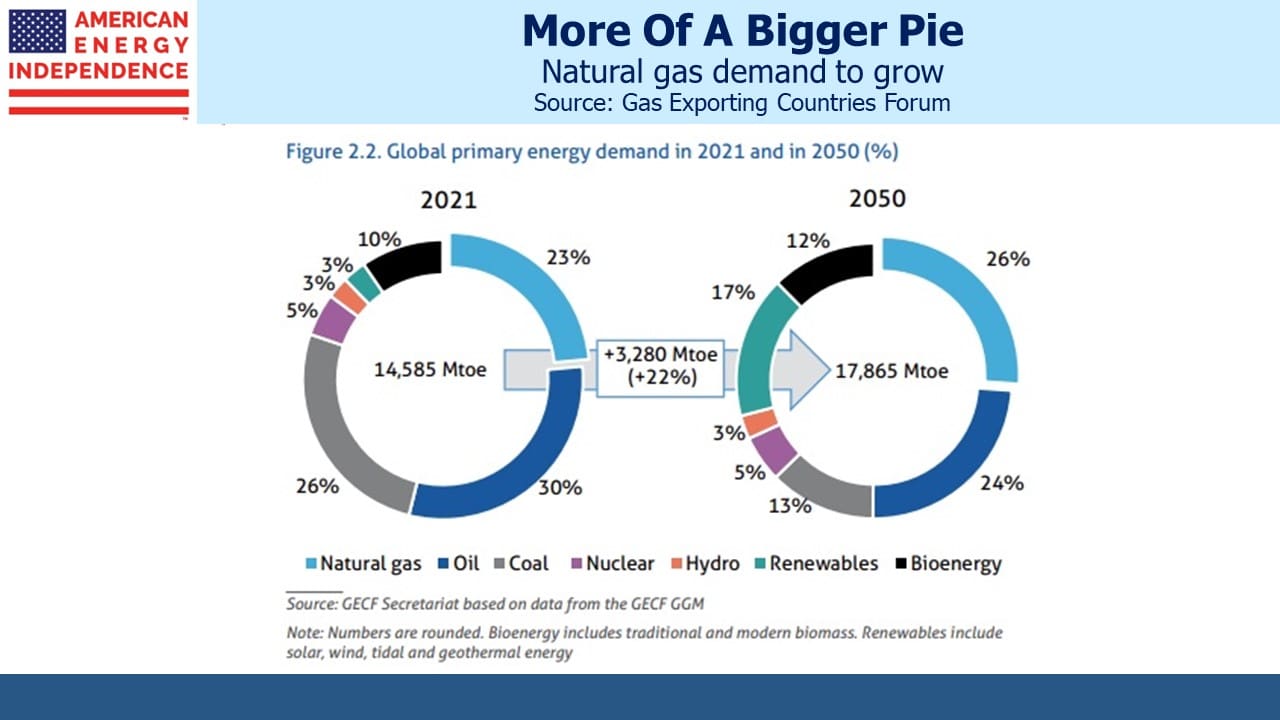
The pie chart shows the magnitude of the problem. China burns half the world’s coal. The challenge of global warming pits the desire of OECD countries to limit emissions against the drive for higher living standards in the developing world. These two objectives are in conflict, as the G20 meeting showed.

The irony is that rich countries are far better equipped to protect themselves from the consequences should they occur, such as rising sea levels and more extreme weather, than poorer ones. In effect, America’s climate czar John Kerry is telling the developing world, let us help you by all reducing emissions since the results will be worse for you than for us. Those potential beneficiaries are responding that raising living standards for their populations, which requires increased energy consumption, is more important.

Seven years ago, John Kerry in a speech in Jakarta exhorted Indonesians to, “Make a transition towards clean energy the only plan that you are willing to accept.” At the time, an estimated 36 million Indonesians didn’t have access to clean water (see The Moral Case For Fossil Fuels). They have different priorities, appropriately so.

It’s positive that these opposing views are being brought into the open, because it makes eventual progress more likely. John Kerry’s view is hopefully less condescending than it was back then, having confronted reality.

India published a dissenting statement alongside the official communique, urging countries to reduce per capita emissions down to the global average. This is where political support quickly evaporates. For the US, this would require a 70% cut in GHGs, and therefore energy use. Joe Biden understands Americans have little tolerance for constrained access to energy. The White House recently lobbied OPEC to raise production so as to slow the increase in gasoline prices, even though higher prices are both necessary to reduce emissions and a consequence of his administration’s policies.

The White House has stopped short of seeking to phase out coal in the US, although it has a plan to “Invest in Coal and Power Plant Community Economic Revitalization” which aims to support areas “hard-hit by past coal mine and plant closures and vulnerable to more closures” (italics added). Phasing out coal in the US would be more easily done as part of a global consensus to do so which was sadly absent.

OECD countries are reducing emissions, but the world overall is not, other than through last year’s Covid recession. Climate extremists would have us shift to intermittent renewables even while the world’s biggest emitter, China, continues to add coal burning power plants at a dizzying pace. China’s planned coal plant additions outnumber the entire US fleet. They’ll more than offset any progress we make in this country. The G20 conference just concluded did at least expose the conflicting goals.

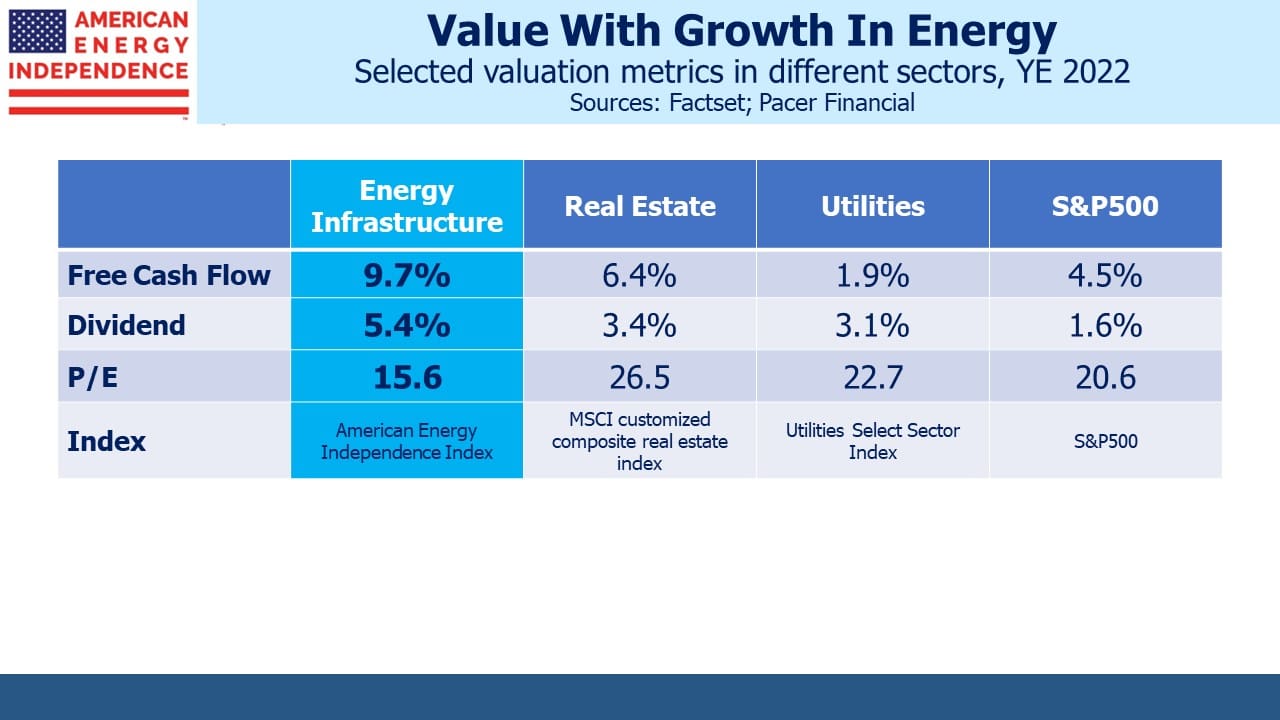
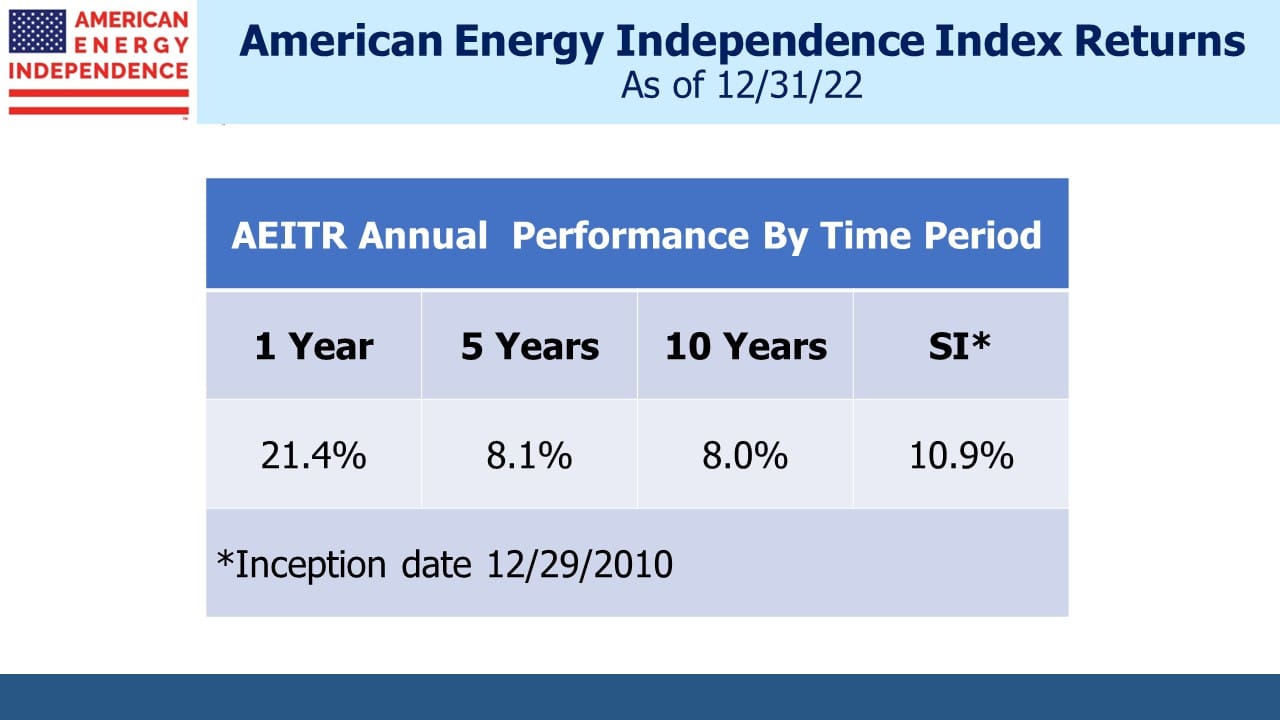
We are invested in all the components of the American Energy Independence Index via the ETF that seeks to track its performance.

Behind The Fed’s Benign Inflation Outlook

This week the FOMC meets on Tuesday and Wednesday. Most recently released minutes suggest that the gradual cessation of the $120BN in monthly bond buying ($80BN in US treasuries and $40BN in mortgages) is getting closer. Given the history of prior efforts to wean the bond market off Fed support, popularly referred to as “taper tantrums,” careful consideration is being given to every aspect of the decision.  

Unilever added to the list of companies reporting pricing pressure last week. CEO Alan Jope reported that, ““We are facing very material cost increases,” He provided examples, noting year-on-year increases in palm oil (up 70%), soyabean oil (up 80%), crude oil (up 60%) and ocean freight (up 40%).  

Procter and Gamble, which is in many of the same markets as Unilever, has already warned of price hikes to come in September. Operating chief Jon Moeller said,” “This is one of the bigger increases in commodity costs that we’ve seen over the period of time that I’ve been involved with this, which is a fairly long period of time.” 

The housing market continues to be red hot. One client told us he plans substantial increases in rents on properties he owns on Long Island, NY. This is in part to compensate for the difficulty in evicting delinquent tenants. Although the CDC’s eviction moratorium, which has been the subject of court challenges, expires at the end of July, New York State has issued their own moratorium.  

More expensive real estate is pushing up rents. Data from Zillow shows that rents are up 7% across the country from a year earlier.  

House prices are up too. The most recent Case-Shiller US National average rose 2.1% in the previous month, +14.6% for the year. It is the topic of cocktail conversation among the lockdown-liberated. The Fed’s $40BN a month of mortgage buying is boosting home prices by holding mortgage rates down. 

The FOMC will discuss the frothy housing market but may draw comfort from other data. For example, Owners’ Equivalent Rent (OER) is showing a 2.3% year-on-year increase. As we’ve noted, OER is drawn from a survey that asks homeowners what rent they believe their house would command in the market (see Why You Can’t Trust Reported Inflation Numbers). Most homeowners have only a vague notion of what this figure is, or OER would be rising along with actual rents and house prices.  

Moreover, how is the FOMC to regard OER if it belatedly starts rising, especially if the actual market for housing and rents starts to cool? OER is never tested against the market, since it’s not based on actual transactions. A homeowner can theoretically offer an aspirational rent estimate in response to a survey from the Bureau of Labor Statistics even if their home would never rent at that level. It’s likely that this dovish FOMC would dismiss rising OER as inconsistent with other data and not reflective of cash transactions. So it’s a useless component of the CPI, albeit a significant one with a 24% weighting. The Fed prefers the index of Personal Consumption Expenditures which uses OER but at a smaller weight.  

Dumping the OER concept and relying on actual cash expenditures on shelter would usher the Fed into the world the rest of us inhabit. 

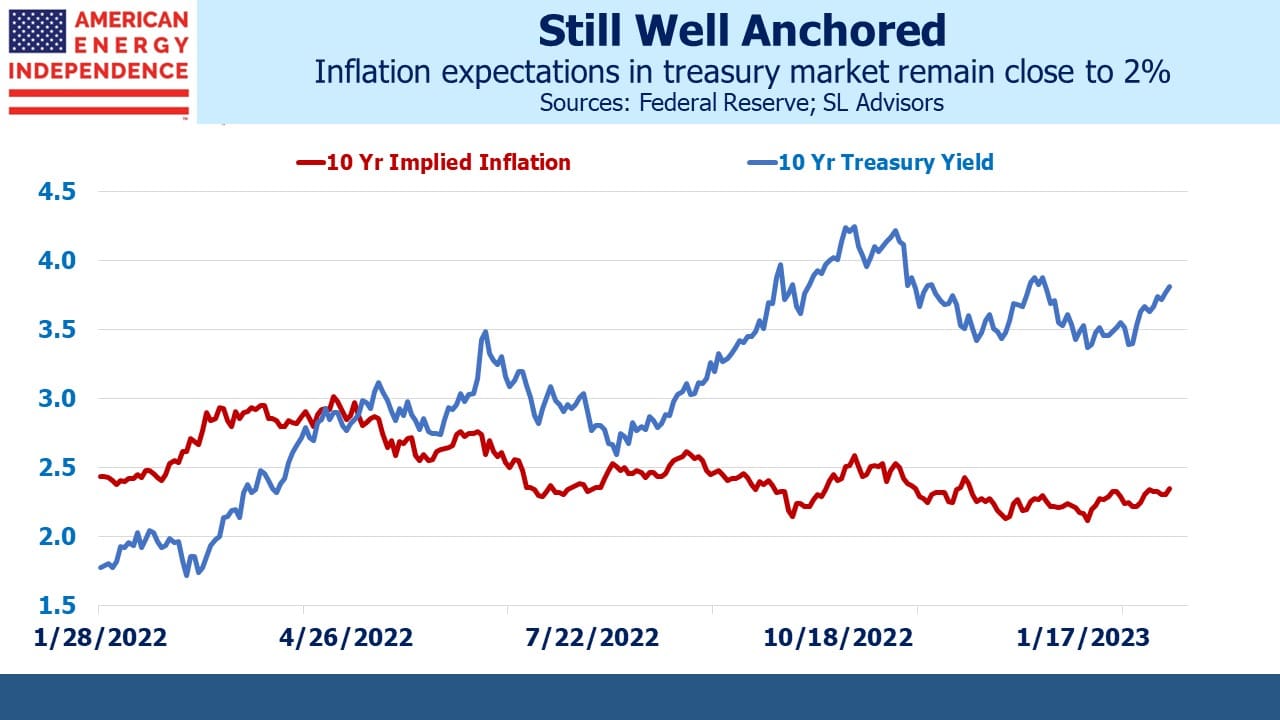
The FOMC may also draw some comfort from falling bond yields. Ten-year inflation expectations, derived from the difference between nominal and real yields on US treasuries, have fallen from 2.5% in late May to 2.28% currently. Fed chair Jay Powell has repeatedly assured us that the rise in inflation is transitory, so he may point to the bond market as confirming this belief. The FOMC remains convinced that there remains plenty of slack in the labor force. Interestingly, the non-partisan Congressional Budget Office believes we are closer to potential GDP, which in their view implies less economic slack than the Fed believes.  

Chair Powell may peruse recent work from Citi Research, which takes monthly gross issuance of US treasuries, deducts redemptions and Fed buying to arrive at the net supply to be absorbed by other buyers. July’s $94BN of net supply is the lowest figure of the year, a third less than the monthly average of $150BN. Citi argues that bond scarcity was behind the recent drop in yields.  

At first, I thought this seemed too simplistic. Surely the buyers, who are largely central banks and sovereign wealth funds and others with inflexible mandates, must nonetheless be aware of this seasonality and adjust their buying accordingly. But then I realized that our own central bank doesn’t even do that. Their monthly purchases are fairly consistent.  

In July, Fed buying will take up 85% of net supply, versus 54% on average during the year. In May the Fed bought up only 45% of net supply. 

Therefore, the recent drop in inflation expectations that will cause some relief among FOMC members may be in part their own doing. Combined with their failure to accurately measure housing inflation, the FOMC looks increasingly divorced from the real economy.   

September is a heavy issuance month, and the Fed will only be buying around 44% of net supply. If they’ve begun tapering by then, it could be even less. Managing portfolios while the FOMC tries to elegantly exit their ongoing partial debt monetization will require deft risk management for the rest of us.  
We are invested in all the components of the American Energy Independence Index via the ETF that seeks to track its performance.


Was That A Delta Head Fake?

Crude oil fell sharply on Monday, hit by the long-awaited confirmation of increased production from OPEC and growing concerns about the Delta Covid variant. Pipeline stocks dropped along with the energy sector. Financial markets’ concern coincided with the dropping of all remaining Covid restrictions in the UK (although visitors still face mandatory testing and/or self-quarantine, depending on where they’re coming from). After a strong rally for most of the year, some investors were clearly caught out by the market’s sudden concern with the Delta variant. Although infections are rising, there are far  fewer hospitalizations than before in developed nations because of widespread vaccinations and acquired immunity.
Lockdowns and other measures that seek to protect populations continue to inflict much damage. Deaths from drug overdoses in the US rose by 30% in the past year, a jump at least partially blamed on Covid lockdowns. Moreover, CDC data shows that 87% of all deaths among all age cohorts above 40, even including those 85 and older, didn’t involve Covid. All those people who died since January 2020 endured a lousy last year of life trying to avoid Covid, but the vast majority succumbed to something else.

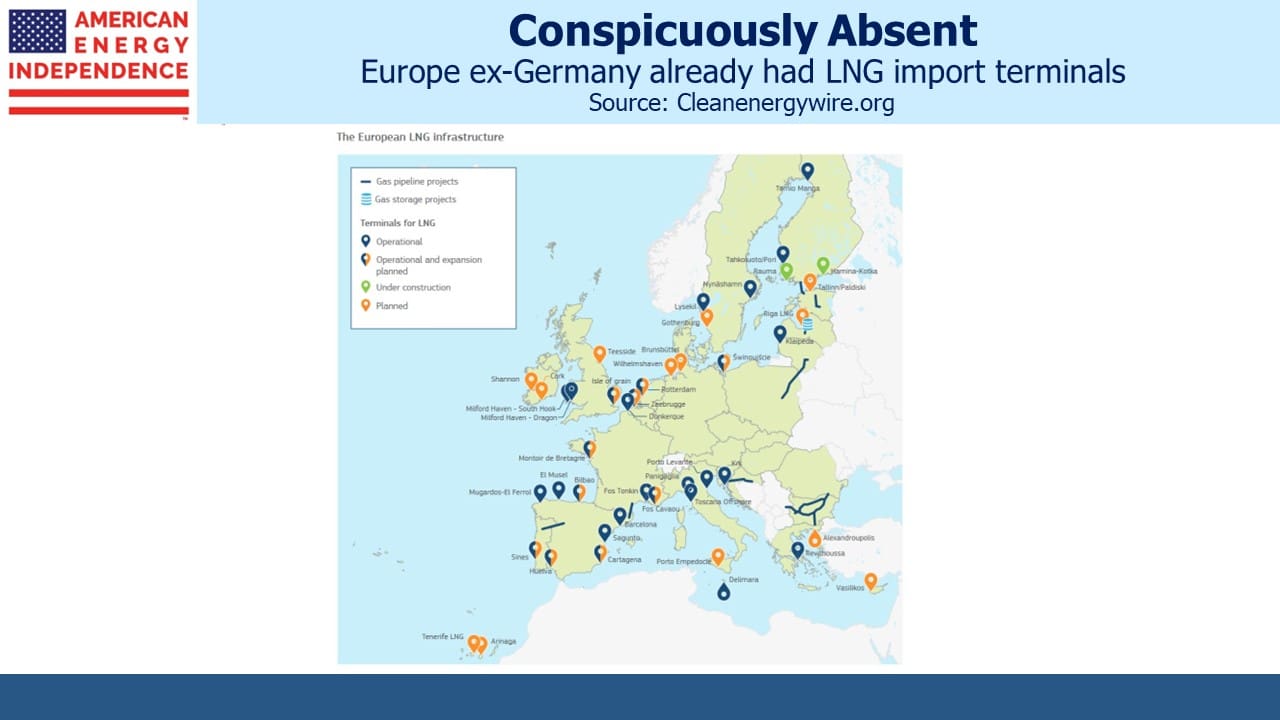
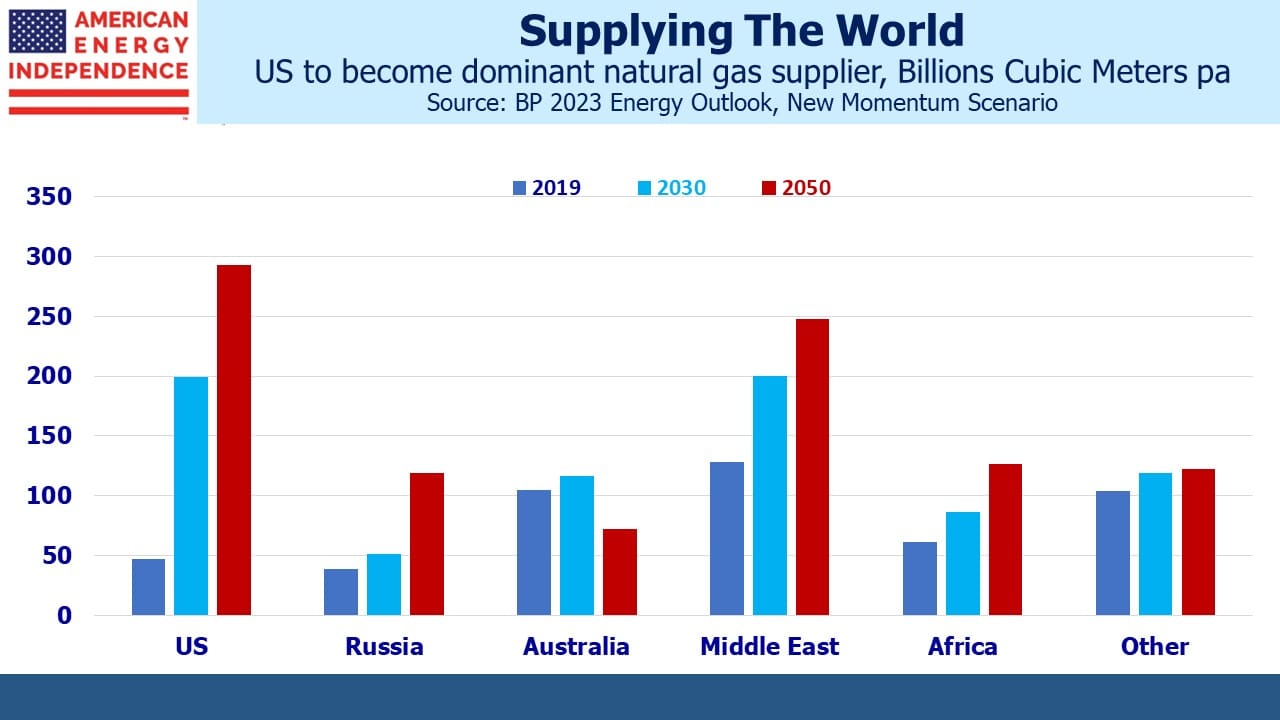
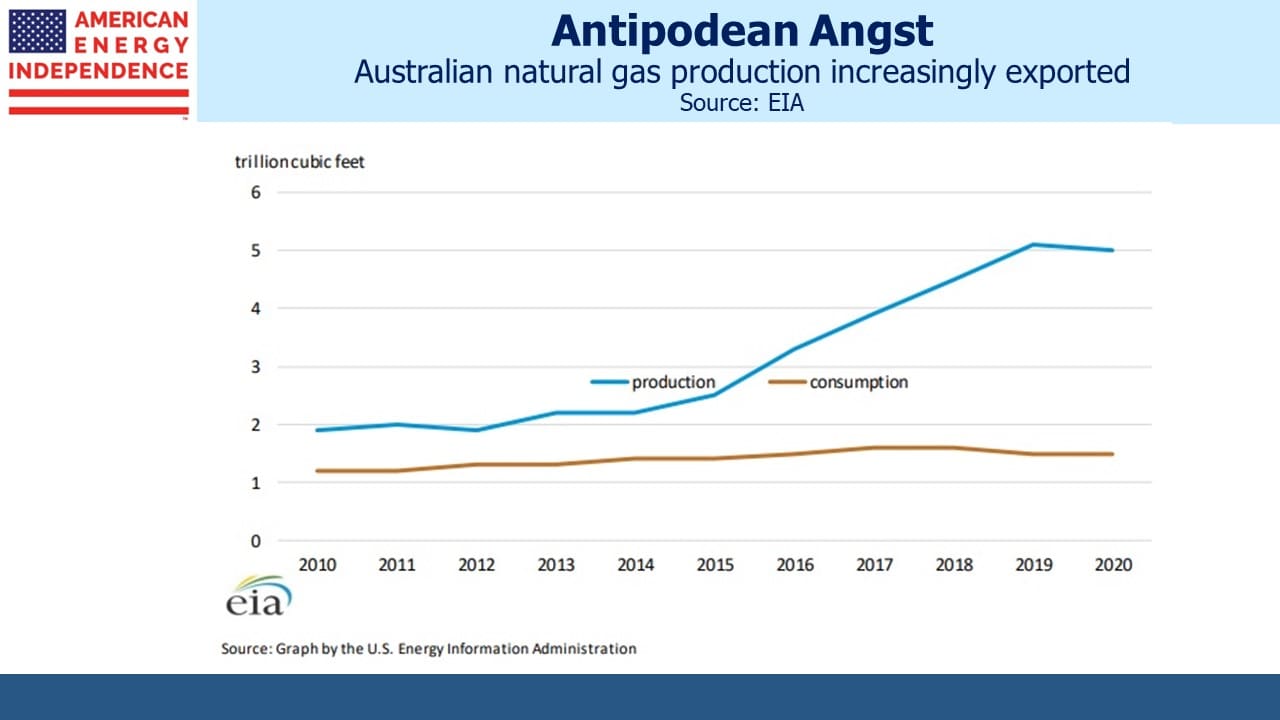
Although oil garners most attention, natural gas is at least as important to North American midstream, energy infrastructure. Global prices have been rising, even recently when oil prices have weakened. The JKM benchmark for Japan and South Korea continues to trend higher, as does the TTF European benchmark. This has improved the economics for exports of US Liquified Natural Gas (LNG), and volumes continue to grow.

Even last year, global LNG volumes were flat, contrasting with crude oil where global demand was down 7%. The US saw the biggest growth in LNG exports, +1.5 Billion Cubic Feet per Day (BCF/D) to 6.5BN. Following a fall last summer as the world endured its brief Covid recession, volumes rebounded in October.

The outlook for LNG exports looks very strong. The International Energy Agency (IEA) recently forecast that global power demand would rise 5% this year following a drop of just 1% in 2020. This is driven by emerging economies, particularly in Asia. Just under half of the increase relies on fossil fuels, especially coal. The continued importance of the dirtiest of fossil fuels in Asian power generation represents a huge opportunity for natural gas. Switching from coal to natural gas would lower emissions, emulating the success the US has had doing just that. Global use of natural gas for power generation is expected to rise 1% this year and almost 2% next, following a 2% drop in 2020.

Over the past five months US exports of LNG plus pipeline exports to Mexico have averaged over 17 BCF/D. After a slow start, Mexican demand is picking up and looks set to grow at 10% pa over the next four years. Even though US power sector demand for natural gas is moderating as higher prices cause switching back to coal, export demand is more than making up the difference.

Recent floods in Germany have become an election issue, with all the major parties attributing this extreme weather event to changing climate. Germany is about 2% of global emissions, so even if voters demanded a swift move towards carbon neutrality, German weather wouldn’t change perceptibly as a result. However, a sensible result of increased German concern about climate could be pressure on China and other emerging countries in Asia to lower their use of coal. Natural gas would stand to benefit.

It’s only a couple of years since the TTF benchmark was under $4 per Million BTUs (MMBTUs), less than a third of today’s price. This is drawing more long-term buyers of US LNG, which has in turn caused leading LNG exporter Cheniere to sign a 15-year purchase agreement from Tourmaline, Canada’s biggest producer of natural gas. Tellurian’s CEO Charif Souki has said he expects to announce additional LNG offtake agreements to add to the two recent ones they signed (see Pipeline Rally Exposes Lagging MLP Sector).

The volatility of crude oil and its consequent impact on energy sentiment distracts attention from the long term commitments being made for natural gas.

We are invested in all the components of the American Energy Independence Index via the ETF that seeks to track its performance.


Market Underprices Rate Hike Risks

Bob Rubin was US Treasury Secretary from 1995-99 under Bill Clinton. Early in his tenure, the US$ came under severe downward pressure. Market pundits kept calling for the Treasury to provide US$ support, to stem the slide. This evoked memories of 1987, when a growing trade deficit caused persistent US$ weakness which pushed up bond yields and eventually led to the October stock market crash.

Relying on his almost three-decade career at Goldman Sachs which culminated in co-chairman, Rubin waited, allowing the US$ to continue falling. He recognized that even the US Treasury couldn’t stand in the way of the FX markets. He waited until the US$ sell-off paused, and then retraced for a couple of days, in the kind of move analysts call a “healthy correction.” Just as the small bounce is the US$ was testing the conviction of shorts, the Treasury launched a coordinated intervention with Japan, Germany, and Switzerland. The consequent trading losses inflicted on FX speculators took a while to heal, and traders were more cautious about shorting the US$ afterwards.

Today’s Federal Reserve does not possess such a deft hand. Perhaps it’s because the FOMC has to agree on policy, constraining them to decisions at their meetings rather than allowing chair Powell to act opportunistically. In any event, the Fed is missing the opportunity to begin an elegant exit from its $120BN monthly bond buying program. Surely the ten-year treasury note yielding 1.3% is proof of sufficient demand elsewhere and that the continued debt monetization is no longer needed.

If Bob Rubin was Fed chair, his planned exit from the Fed’s bond buying would be timed for when the market no longer needs it. Given a choice between tapering now, when yields are falling, or later when continued economic strength is driving yields higher, the former is clearly less disruptive.

But that’s not the FOMC’s game plan. Their strategy is to exit when they see full employment and 2% inflation expectations (or higher). We are to expect ample and timely communication, but they will nonetheless most likely be reducing their buying into a falling market. There’s probably no easy way to scale back over $1.4TN in annual bond buying, but the FOMC’s plan looks decidedly market-insensitive.

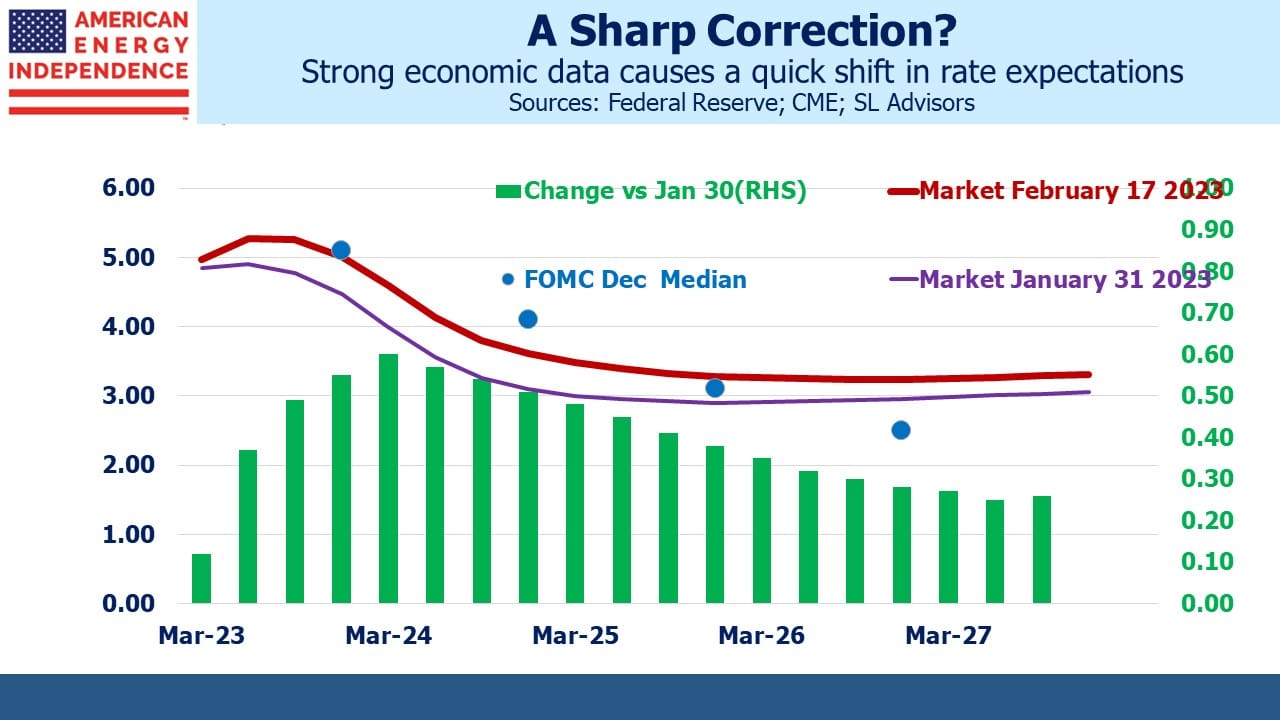
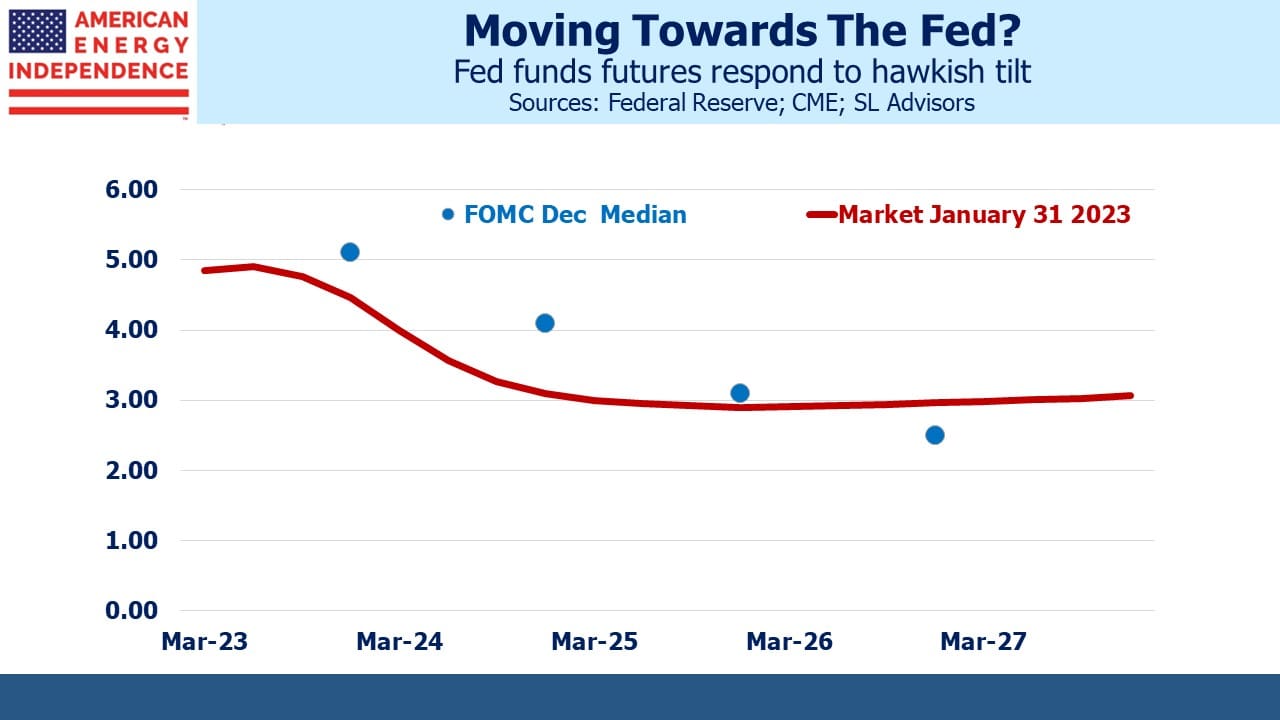
Eurodollar futures are priced for 0.75% of tightening by the end of 2023. The most dovish of the blue dots on the Fed’s Summary of Economic Projections (SEP) expects policy to still be unchanged by then. Although the median is higher, the FOMC’s composition will likely become even more dovish over the next year (see Trading Futures With The Fed).

Jay Powell has promised that, if required,“… we will use our tools to guide inflation back down.” This is the bare minimum commitment of any Fed chair, and he’d clearly rather not have to. Powell is all-in on the belief that the inflation rise will be transient.

It may be, in which case the 1% yield on December 2023 eurodollar futures is too high. But if the FOMC is wrong, and inflation expectations become anchored well above 2% as a reasonable reaction to rising prices, the Fed will likely have to move more than just once a year, which is what’s now implied by the 52bps spread between Dec ‘23 and Dec’25 eurodollars.

It’s hard to envisage the type of economic environment by then that would justify the slothful monetary tightening currently priced into the market. It would likely require a persistent shortfall in employment, inflation back below 2% and little or no new fiscal stimulus, an unimaginable degree of Congressional restraint.

The SEP blue dots suggest a tightening pace of twice that.

The yield curve it too flat. It’s currently possible to bet with the Fed’s forecast of a very slow normalization of monetary conditions in a trade that should also work if it turns out they’re moving too slowly. It’s a way of betting with the Fed while having insurance in case circumstances move against them. The trade is to go long Dec ‘23 eurodollar futures and short Dec ‘25 futures, at a spread of 52 bps.

Inflation concerns are coming up regularly in conversations with investors. Wells Fargo recently calculated that 60% of the pipeline sector’s EBITDA is subject to tariff escalators linked to PPI, which is likely to exceed 5% this year. For liquids and NGL pipelines that could add up to a more than 3% increase in cashflows in 2022 – a benefit that requires no incremental capex, and is not just a one-time gain as it’ll become embedded into the tariff structure. We believe midstream energy infrastructure offers one of the most attractive ways to invest for inflation protection.

Finally, we liked a WSJ op-ed (see The Climate-Change Agenda Goes Out With a Bang) that noted the increasing pushback from voters around the world against the agenda of environmental extremists because of cost. Swiss voters have rejected an increased fuel tax; Britain’s cabinet is split over previously announced plans to ban gas-fired home heating; a proposed French diesel tax in 2018 helped create the “yellow jackets” protests. From Joe Biden on down, political leaders have downplayed the cost of the energy transition, instead of explaining that if something’s worth doing it’s worth paying for. Hopefully this will introduce a little more realism into policy debates.

We are invested in all the components of the American Energy Independence Index via the ETF that seeks to track its performance.

Biden’s Hasty Keystone Cancelation Draws $15BN Lawsuit

The Keystone XL pipeline extension (KXL) became a political football years ago. Canada has long struggled to transport its crude oil from Alberta to markets overseas. Three years ago Kinder Morgan (KMI) found themselves embroiled in an inter-provincial dispute, when British Columbia refused to allow added capacity to the TransMountain Pipeline (TMX) that links Edmonton, Alberta with Vancouver and the Pacific. Having concluded the project had become too political, KMI fortuitously sold TMX to the Canadian federal government just weeks before a court issued a ruling that added further substantial delay (see Canada’s Failing Energy Strategy).

The Keystone Pipeline System runs from Alberta to Cushing, OK and on to the Gulf of Mexico. In 2008 planning was started for KXL, which was needed to add 830K barrels per day of additional capacity, albeit following a different route which would have allowed it to pick up oil in North Dakota too.

KXL’s size made canceling it a goal of environmental extremists. Because it was to cross the US-Canada border, the State Department was involved in its approval. Obama imposed delays for several years, but in 2017 newly-elected President Trump approved it. TRP brought in Alberta as a partner, so as to share risk with the government entity best positioned to benefit. Court challenges caused further delays, but in March 2020 TC Energy (TRP), the owner, announced plans to proceed with construction.

In January on his first day in office, newly-elected President Joe Biden issued an executive order canceling the permit for KXL. Last week TRP announced they’re suing the US for $15BN under the United States-Mexico-Canada Trade Agreement (USMCA) that replaced NAFTA.

It was a dumb move full of theatrics to play to progressive Democrats. Most of the oil that KXL was going to transport will still get to market, albeit by rail and truck which are (1) more expensive, (2) worse for the environment, and (3) not as safe as pipelines. KXL opponents presumably expect that the higher transportation cost will result in less crude being produced. That may be true, but given the second and third considerations listed above we may have higher emissions and more spills than if KXL had been built.

While environmental extremists hailed Biden’s decision, they may come to hope that TRP prevails in court. Capital investments whose timeline extends beyond a single presidential term need certainty that permits issued under one administration can’t be revoked under a later one. Just as an individual can’t simply change his mind over a prior legal commitment, neither can a country.

TRP’s lawsuit revolves around whether the US was permitted to change its mind about KXL. The concept that a permit lawfully obtained under a prior administration is nonetheless subject to subsequent revocation is not free. If allowed to stand, the capricious flexibility so allowed would inject uncertainty into a wide range of capital projects. Investors would need to consider the possible impact of an election, which would increase the required IRR to justify an investment. Corporations would become more deeply involved in elections in order to protect their investments.

Moreover, it’s entirely possible that a new Republican administration in 2025 could rescind Biden executive orders that were intended to support investment in infrastructure to support renewables. If TRP loses its lawsuit, capital commitments in support of the energy transition that rely on today’s executive orders will ultimately deliver more expensive energy than otherwise – if they even reach completion.

The US has adopted an arrogant stance to its northern ally on this issue, something easily done for a superpower. KXL and oil exports were always going to be more important to Canada, and Americans famously care little for their northern neighbors’ feelings anyway.

But there’s a lot more at stake than a lost pipeline investment in TRP’s lawsuit, which if they were to be awarded the full $15BN would amount to over $100 per US household. If the US prevails, required IRRs will rise on many projects, including renewables that could become political flashpoints. NIMBY opposition is already growing to the onshore placement of solar farms, windmills and the high voltage power lines necessary to move power from rural areas to population centers.

It may turn out that seeing TRP prevail in court will be more beneficial to the goals of the Sierra Club, flawed though they are, than uncertainty over the longevity of future presidential permits. If so, maybe their members will pay towards the $15BN they’ll have cost the rest of us.

We are invested in all the components of the American Energy Independence Index via the ETF that seeks to track its performance.

Trading Futures With The Fed

Last week’s big story was the sharp drop in bond yields. Ten-year treasuries dropped below 1.3% on Thursday, down 0.30% on the month. Big moves in bonds usually have a visible catalyst, but there was no obvious driver of last week’s move. Inflation expectations dropped somewhat, which is typically reflective of a change in the economic outlook. But around half the drop in bond yields has been caused by falling real yields, which are typically less sensitive to economic data. Today’s investors in ten-year treasuries are willingly accepting a loss, after CPI inflation, of almost 1%. Non-commercial buyers, including central banks and pension funds with rigid investment mandates that require fixed income allocations are setting bond prices today.

Eurodollar futures continue to provide a fascinating counterpoint to the FOMC’s Summary of Economic Projections (SEP). The infamous “blue dots” from the SEP are overlaid on the eurodollar yield curve below. They show the median forecast for the Fed’s overnight policy rate – the blue dots provide annual readings for 2021-23, and a long-term forecast. So we’ve assumed the equilibrium real rate of 0.5%, what the FOMC calls “r*”, is reached by 2026. With their 2% inflation target, that results in a 2.5% neutral Fed Funds rate.

We’ve also added in Fed chair Jay Powell’s blue dots. The SEP doesn’t disclose dot ownership, so we’ve simply assumed he’s the most dovish dot in each year which is consistent with his public comments.

If Jay Powell was allowed to trade eurodollar futures, he would surely bet on a steeper yield curve from 2023-2025. Even though he constantly warns us not to pay too much attention to the dot plot, he provides a forecast himself like the other FOMC members.

We’re told they will move slowly in raising rates, and the most dovish dots are 0.75% below eurodollar yields for 2023 even after the recent bond rally. But five years out even the most dovish FOMC member is 0.25% above eurodollars. The discrepancy was more pronounced on Thursday morning when the bond market’s recent rally faltered.

Although FOMC doves think the market is ahead of itself in anticipating the beginning of monetary tightening,  it’s also too relaxed about the pace of tightening once the FOMC gets started.

This shows up in calendar spreads. On Thursday the spread between December ‘23 and December ‘25 eurodollars narrowed to 0.55%, implying the Fed will be on a pace of barely more than one 25bps hike annually during that time. This is historically very slow, and at odds with what FOMC members expect. In March, the market was priced for almost five tightenings over this two year period. By the end of the week, this spread had widened back out to 0.65%.

For those who are familiar with the colors of each year of futures, the Jay Powell trade is to go “long the green Dec gold Dec spread.”

Betting against the FOMC made sense early this year, when the yield curve was too flat. Six months ago the market was priced for only a one in five odds of a tightening by the end of next year. Today, seven out of 18 FOMC “blue dots” are forecasting such, and the market has adjusted accordingly.

But the opportunity is shifting towards later rather than sooner, which is in line with Fed chair Powell’s view. Former NY Fed president Bill Dudley noted that the employment situation is likely to remain unclear until Federal unemployment benefits fully expire in September and children finally return to in-person school. So it’s going to be at least another couple of months before the Fed can conclude “substantial further progress” towards full employment has been made.

Being an inflation hawk has gradually gone out of fashion, not least because persistently low inflation has rendered such a stance out of touch. But even today’s dovish FOMC expects to raise rates within two years – their internal debate will be one of speed.

Joe Biden will have an opportunity to influence the FOMC’s composition. Fed chair Powell is up for reappointment next year and looks likely to stay. Vice chairs Richard Clarida and Randal Quarles are also both up for reappointment, and one of the seven Fed board seats is vacant, with a term that expires in 2024.

This offers the president an opportunity to modify the FOMC somewhat to reflect his views. Don’t expect anything so crass as public advice on monetary policy from the White House, but subtle pressure out of the spotlight is likely. This makes a slow pace of monetary tightening more likely, because the FOMC’s dovish tendencies will be reinforced.

Chair Jay Powell is likely to have a say in any appointments. He’s already suggested that monetary policy has a role to play in reducing income inequality. There are many considerations the FOMC could include in setting rates, and they’re all likely to lead to more dovish outcomes than a simple focus on inflation.

We are invested in all the components of the American Energy Independence Index via the ETF that seeks to track its performance.


Is Biden Vulnerable At The Gas Pump?

Voters have a history of blaming the president for high gasoline prices, even if the White House has limited power to change them. When OPEC tripled oil prices following the Iranian revolution in 1979 it was one blow too many for Jimmy Carter, who was swept aside by Reagan in 1980. The Arab world’s opposition to US foreign policy in the Middle East was one of the causes of high crude.

Although Joe Biden wasn’t at the OPEC meeting that just collapsed over the UAE’s insistence on an increased production quota, the continued bull market in oil which got a further boost can be partly traced back to his policies. Goaded by the progressive wing of the Democrat party, the Administration has a hostile attitude towards new oil and gas production.

Growing political pressure on energy companies to cut back oil and gas production is having an impact. Large publicly traded companies are especially vulnerable to such pressure. Exxon Mobil and Chevron both recently had to modify their spending plans in response to shareholder pressure, while Royal Dutch Shell was ordered to do so by a court (see Profiting From The Efforts Of Climate Extremists).

One consequence is that OPEC’s influence over oil prices is growing, as non-OPEC producers have less spare capacity. Demand is currently running at 97 Million Barrels per Day (MMB/D) and looks set to reach 100 MMB/D by year’s end. There’s no reason to expect demand to stop increasing at that point, as rising living standards in emerging Asia are likely to push it above pre-Covid levels.

The US energy industry’s newfound financial discipline is also helping. Domestic production is not rising nearly as much as in past cycles. This is all great news for energy investors. Having endured excessive capex with low prices, the pendulum is now swinging back the other way. Morgan Stanley expects the group of independent US shale producers under research coverage to boost Free Cash Flow (FCF) by a third over the next year, where they’ll have a FCF yield of 15%. We expect North American pipeline companies to generate $49BN in FCF this year, up 27%, and $56BN in 2022.

Environmental extremists are very happy with rising oil prices. There will be no energy transition unless renewables are competitive, and this helps. They tend to be more city-dwellers than rural, so gasoline prices don’t have much impact.

Energy investors are also happy, as the unlikely alignment of interests with the liberals has led to a mutually desired outcome. But what about the rest of America? Gasoline prices are now higher than at any time during the Trump presidency. This is yet another incongruity with continued fiscal and monetary support for the economy which clearly no longer needs it. Biden can quietly turn to the disillusioned progressives who think he’s abandoned them and claim credit for the high oil prices they want.

So far the energy transition has had limited impact on consumers. Apart from power outages in states where renewables have risen to an unwieldy share of electricity generation (see California and Texas), disruption has been minimal. Rising gasoline prices will eventually test society’s willingness to pay more for energy. We should pay more. The energy transition is expensive. If lowering CO2 emissions was easy we would have already done it. If it’s a worthwhile endeavor, it’s worth paying for.

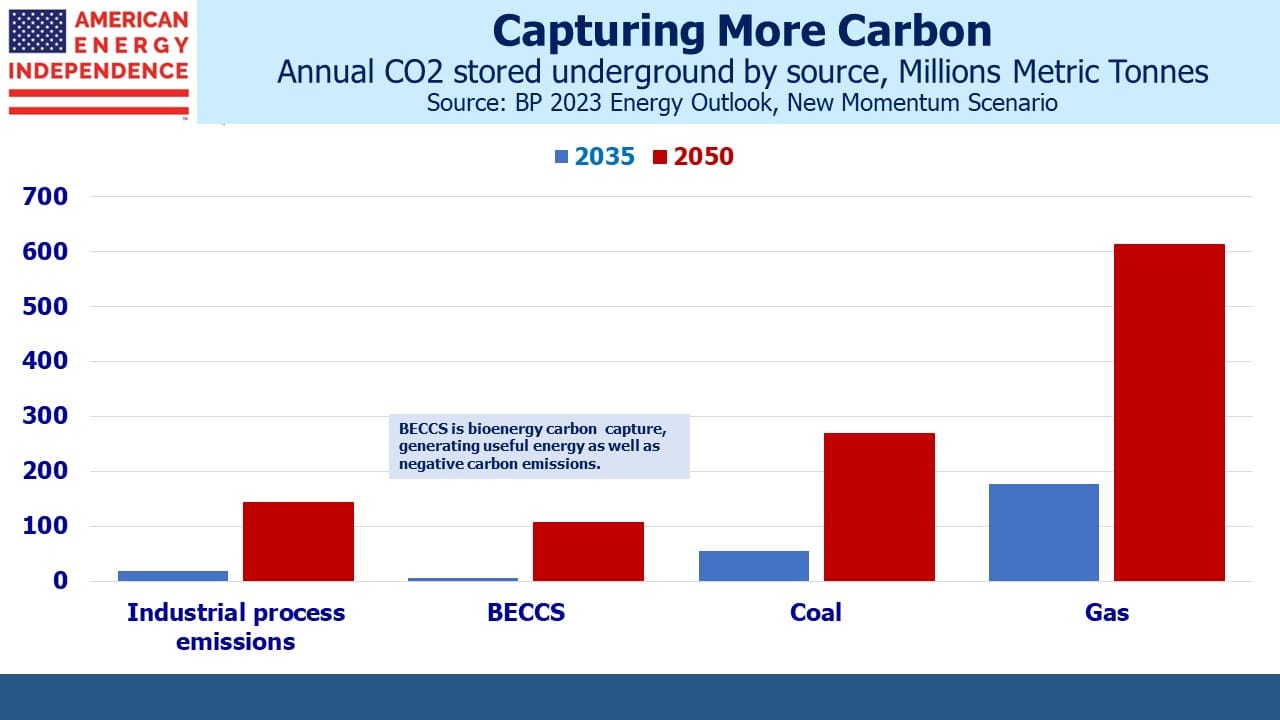
The problem is that the energy transition hasn’t been marketed as such. Candidate Biden promised us green employment opportunities that would be well-paying union jobs. It’s all been disingenuously promoted as an exciting opportunity. Instead it’s an eternal slog to avoid carpeting the landscape with intermittent solar panels and windmills until pragmatism dictates the adoption of new technologies: carbon capture and sequestration to allow increased use of natural gas (see Carbon Capture Gains Momentum); blending of hydrogen into the natural gas supply (see Europe’s Nascent Hydrogen Industry); and perhaps one day we’ll revisit nuclear, if society truly wants to solve the problem.

Although Biden gasoline prices are higher than at any time under Trump, they reached $4 a gallon in 2014 under Obama. It wasn’t much of a political issue back then, because the president hadn’t done much to cause it. That was also the peak in the energy cycle, since the Shale Revolution’s supply shock followed and prices duly fell.

This suggests that the pain threshold for rising gasoline prices is above where they are today, which is good news for energy investors. It means environmental extremists can continue shifting oil supply to foreign governments and privately held firms, continuing the publicly traded industry’s virtuous cycle of reduced capex and growing FCF. Biden’s vulnerable on gas prices because his policies are intended to push them higher, but we’re not there yet. Pipeline stocks still have plenty of upside.

We are invested in all the components of the American Energy Independence Index via the ETF that seeks to track its performance.


Happy Covid Freedom Day (Almost)

Last week a friend called to wish me Happy Independence Day. He added “Down with the British” in recognition of my immigrant status. My accent betrays my British childhood, even though I moved here in 1982. July 4th barbecues usually provoke a few joking reminders about beating the British. The obvious response is that had the War of Independence instead been the defeat of the colonial uprising, there would have been little reason for me to emigrate from the UK some two centuries later.

It is typically American that the descendants of that war’s losing side are so readily welcomed, especially on the anniversary of its kick-off.

While the U.S. will fall short of its goal to give at least one dose of Covid vaccine to 70% of adults, we can still celebrate that life is almost back to normal. After a stuttering start, once America took on Covid we were going to win. America always wins. As Churchill once said, “You can always count on the Americans to do the right thing after they have tried everything else.”

The fact that international travel is virtually impossible is a reminder that while Covid may be over in this country, it remains a dominant feature of everyday life in many others. Much as I would have loved to travel to London and watch England beat Germany at Wembley last week, testing and self-quarantine requirements made it impractical.

The economic consequences of Covid are still with us. The Fed’s full-on monetary stimulus and bond buying are barely different from a year ago even though the economy has come roaring back. Friday’s payroll showed another 850K jobs added and the unemployment rate only edged up because more people are being drawn back into the workforce. 1.6 million people report the pandemic is preventing them from looking from work, down from 2.5 million a month ago. The question hardly needs asking any longer, and the end of Federal unemployment benefits will help.

Nonetheless eurodollar futures prices rose, reflecting slightly lower tightening probabilities.

OPEC fears a crude surplus by the end of 2022, which is complicating their discussions to continue phasing out the supply cuts they implemented in May of last year. They’re evidently not too concerned about high oil prices weakening demand. By contrast, the Fed remains at full throttle, providing ever more stimulus.

Finally, for those enjoying the Euro 2020 football tournament, the photo reminds that the game doesn’t only produce moments of brilliance.

Happy Independence Day.

We are invested in all the components of the American Energy Independence Index via the ETF that seeks to track its performance.

Federal Reserve Housing Support Has Run Its Course

The red-hot housing market is a topic of cocktail conversations, at least among those comfortable to take that step back to normalcy. The S&P/Case-Shiller U.S. National Home Price Index (C-S) sports a 14.6% year-on-year increase through April. Residential real estate benefits from numerous sources of government support. Property taxes are tax-deductible up to $10K (although in NY and NJ the benefit is derisory because taxes can be 2-3% of a home’s value). Mortgage interest is also tax deductible, and the Federal government underwrites the credit risk of conforming mortgages which lowers their interest rate. Add to that the $40BN in monthly MBS purchases, part of the $120BN in long term bonds the Fed is buying which acts to further depress rates. So on top of the various tax subsidies and guarantees, the Federal government is lending almost half a trillion dollars a year to home buyers. It’s no wonder home prices are rising.

The Fed measures housing inflation by relying on a survey by the Bureau of Labor Statistics on what monthly rent homeowners think their home could command if rented. It’s safe to say that Owners Equivalent Rent (OER) is not the subject of the abovementioned excited cocktail chatter because it’s a theoretical concept – the only element of the inflation statistics not derived from actual transactions. Its weaknesses are well documented and we won’t belabor them here (for more detail, see Why You Can’t Trust Reported Inflation Numbers). Suffice it to say that OER doesn’t reflect the cost of housing for the two thirds of households who choose to own their home. The S&P/Case-Shiller U.S. National Home Price Index has risen at an annual rate of 4.4% over the past two decades, versus 2.6% for OER. The Fed’s use of OER means it has persistently ignored inflation in the biggest expense households face.

Although the FOMC is more in thrall to progressives than bond vigilantes nowadays, their full-on spiking of the punch bowl is making some increasingly uneasy. Boston Federal Reserve Bank president Eric Rosengren is worried that a housing “boom and bust cycle” will threaten financial stability. It’s hard to find any serious support for the Fed’s continued buying of MBS in the financial community. Even the liberal wing of the Democrat party must conclude that few beneficiaries of housing inflation are likely to be found among their core supporters.

The continued strong housing market speaks to the imminent conclusion of at least this element of the Fed’s $120BN monthly bond buying. Expect the FOMC to curtail it during the third quarter, as a growing chorus of economists and investors warns of another housing bubble. Eurodollar futures priced in earlier monetary tightening following Powell’s press conference a couple of weeks ago, so that the yield curve now more closely resembles the forecasts from St. Louis Fed president James Bullard than Jay Powell (see The Fed, Thinking Fast Or Slow). But there’s still more downside price risk than upside for futures.

Switching to energy markets, those of us outside California will appreciate this priceless headline:  California Asks Residents to Avoid Charging Electric Cars Amid Power Grid Strain. The Golden state is pursuing altruistic energy policies – swearing off everything but solar and wind, yet unable to provide reliable power. One problem is they’re ahead of most of the world in shifting as quickly as possible to largely renewable power (2018 was 34%). Global greenhouse gas emissions continue to rise, mostly due to rising living standards and energy consumption in developing countries. To the extent that climate change is responsible for the heatwave across western states, Californians are enduring both the results of global warming and the costs of mitigation without any visible benefit.

Of course renewables aren’t directly responsible for California’s power shortages, although had they redirected solar and wind investments to modernizing their existing grid and boosting conventional power sources they’d be in a better place.

The energy transition is a multi-generational marathon. It’s not an endeavor that lends itself to a declaration of victory, although defeat will be recognizable. This will be a problem for politicians, but it’ll be interesting to see how enduring popular support is to phase out fossil fuels in California and elsewhere. The effort will need to last decades while the connection with changing weather will remain tenuous. Few other states will see much to emulate in their approach.

We are invested in all the components of the American Energy Independence Index via the ETF that seeks to track its performance.

The Fed, Thinking Fast Or Slow

Interest rate markets became a lot more interesting this year. Uncertainty around inflation and the Fed’s likely response are creating undulations in the yield curve whose precise forecasts are sometimes a trading opportunity.

For example, late last year the spread between the December ‘21 and December ‘22 eurodollar futures contracts was around 5bps. Since the Fed typically moves its policy rate in 25bp increments, this projected a one in five probability of one tightening in 2022. This turned out to be too low. A rebounding economy combined with profligate fiscal stimulus has led to upward revisions to growth and inflation this year.

The FOMC’s Summary of Economic Projections (SEP) showed that FOMC members had brought forward their estimated timing of higher rates. By early June the spread was at 20, showing an 80% of a 2022 year-end tightening. Six months ago, taking the one in five odds by buying the spread (long December ‘21 and short December ‘22) was a good bet.

A week ago, following the June FOMC meeting, St. Louis Fed president James Bullard revealed that he is forecasting a 2022 tightening. He is one of seven (out of 18) FOMC members with that view, two of whom expect two tightenings. So we know where Bullard’s blue dot sits. Our eurodollar spread moved further, and now sits around 34 where it is priced for at least one tightening by the end of next year and around a 40% chance of a second.

Imagine sitting down with FOMC members while they tell you whether eurodollar futures are correctly priced or not. Were James Bullard to visit SL Advisors’ GHQ and enter into such a conversation, he would likely endorse the market’s pricing. Getting here was the Bullard trade. He favors a faster pace of tightening than some other FOMC members.

The slow, or dovish camp is led by Fed chair Jay Powell. 11 of the 18 FOMC members expect no tightening next year. If Powell accepts this invitation to visit SL Advisors and discuss eurodollar futures, he would say that the market is wrong. He goes to great lengths to downplay the significance of the blue dots in the SEP.

Powell regularly reminds us that the unemployment rate in February 2020 just before Covid was 3.5%, so today’s 5.8% suggests we remain far from full employment. We’re still over 7 million jobs short of where we were, and Powell wants to give those people every opportunity to return to the labor force. He expects inflation to moderate from its temporarily high level and sees little likelihood of the Fed having to hike rates next year. The market is currently skeptical of this view.

The Bullard view is currently in the ascendancy. He favors a faster path to higher rates, which by moving earlier in the economic cycle suggests less need for tightening later on. Eurodollar futures more closely reflect this outcome. Fed chair Powell may be among the majority of FOMC members, but financial markets disagree. What always makes such contrasts especially fascinating is that futures prices are telling the FOMC they disagree with their forecast. It would be bold of a bond manager to tell the Fed chair’s he’s dead wrong, but the market’s collective estimate is doing just that.

By 2023 most FOMC members expect higher rates, but there are still five who forecast no hike and two looking for just one. Powell is likely in one of these two groups – it therefore must be galling to have watched the December 2023 eurodollar futures yield climb almost 30bps from where it was prior to their meeting. At 1.15% it’s pricing in 3-4 tightenings, whereas Powell is likely expecting only one. He must think December ‘23 futures are cheap.

Powell might be right, and certainly has more influence over the outcome than most others. His term as Fed chair ends in February, but if he’s not reappointed an equally dovish replacement is likely. The bond market is no longer as powerful as when Clinton’s campaign manager Jim Carville said he’d like to be reincarnated, “…as the bond market. You can intimidate everybody.”

What this means is that while we’ve had the Bullard trade, the Powell trade is possible. This is where markets price in a more delayed tightening, meaning more later on. Looking farther out on the curve, the spread between the December ‘23 and December ‘24 eurodollar futures in forecasting less than two tightenings in 2024. The FOMC has a longer term, equilibrium rate of 2.5%, although eurodollar futures don’t forecast we’ll reach this level within even five years.

Markets expect the Fed to start tightening by 2023. It seems implausible that, once in motion, the Fed will move less than at least once per year. The Dec ‘23/Dec ‘24 spread has narrowed almost 25bps from its widest levels, mostly because the Dec ‘23 has moved farther from the FOMC. The Powell trade would be to buy this contract and sell Dec ‘24, betting on delayed tightening but ultimately two or more annually. At 43, it’s not yet a compelling opportunity but is worth watching in case it narrows a little more.

Eurodollar futures currently offer a rich source of information, and the occasional trading opportunity, by comparing market forecasts with those of the FOMC.

We are invested in all the components of the American Energy Independence Index via the ETF that seeks to track its performance.

image_pdfimage_print