Betting On Gas With LNG

In March we wrote about start-up Liquified Natural Gas (LNG) exporter, NextDecade (NEXT) (see Making LNG Cleaner). As with Tellurian (TELL) and Cheniere (LNG) before them, NEXT needs to sign up buyers of its LNG before obtaining the financing to complete the liquefaction infrastructure. The rolling global energy crisis which has seen European and Asian buyers paying over $35 per Million BTUs (MMBTUs) for shipments has improved the outlook for US LNG exports. The $25 per MMBTU regional difference with US domestic prices is testament to the constraints posed by limited LNG export capacity. NEXT aims to partially solve that – foreign buyers are eager, although US customers will wind up paying marginally more as increased exports push up prices.

French utility Engie pulled out of discussions with NEXT late last year because they were unhappy at buying Texan natural gas given the prevalence of flaring. Regulators in Texas have interpreted their oversight of methane flaring very broadly, with the result that flaring permits are routinely granted. In 2019 a dispute arose between Exco, a natural gas driller, and Williams Companies over Exco’s application to flare natural gas rather than pay the tariff Williams demanded for pipeline transportation (see Texas Reconsiders Flaring). It showed how Texas’ ready approval of flaring had abandoned the original intent, which was to allow the flaring of associated gas where no infrastructure existed in order to allow crude oil production. Williams argued that the natural gas infrastructure was available, but that Exco didn’t like the price. In September, a judge ruled in Williams favor but that may not be the conclusion.

European LNG buyers are likely to share Engie’s sensitivity to how their product is produced, so NEXT created a “carbon solutions” unit to capture the CO2 associated with their LNG activities. Last week SL Advisors partner Henry Hoffman chatted with management during Cowen’s 2021 Energy Summit.

We think NEXT is under the radar for most investors. They do have some sell-side coverage though. Credit Suisse raised them from Neutral to Outperform in March, which gave the stock a boost. The company has a firm offtake deal with Shell to deliver 2 million tons per annum (MPTA) of natural gas for 20 years. NEXT needs agreements on 9 MPTA more in order to fully sell out capacity for Phase 1 of their proposed Rio Grande facility in south Texas. They are optimistic that they’ll reach this goal next quarter, reporting discussions on volumes well in excess of what’s needed.

The Administration’s Build Back Better legislation, which is currently with the Senate, may boost revenues at Next Carbon Solutions if the CO2 tax credits are sufficient to stimulate additional demand for the new unit’s services.

NEXT is aiming to provide “green” methane, whose production is certified to have resulted in minimum methane leaks along with the capture and sequestration of the CO2 generated in its processing and eventual liquefaction for transfer to LNG tankers.

Henry Hoffman also held discussions with Tellurian’s (TELL) management. TELL’s founder and CEO is Charif Souki, whose weekly Youtube videos have developed a following among retail investors. We like TELL too, but Souki has an unpredictable, risk-seeking streak. He was forced out of Cheniere by Carl Icahn who opposed Souki’s plans to expand into natural gas trading. Why complicate a business with years of cashflow visibility not exposed to natural gas prices?

Last year Souki suffered a margin call on his personal holdings of TELL when the stock collapsed during the Covid rout. He has a healthy risk appetite. We also didn’t like the August secondary offering which was done at a substantial discount to the prevailing price. TELL has a business model that incorporates exposure to LNG prices, which is probably making it harder to finance but allows greater upside if LNG prices remain firm, as Souki believes they will.

TELL told us they were in discussions with private equity investors, which we think could be good as it will improve corporate governance, and get the company closer to having enough financing to begin construction of their LNG facility.

Natural gas remains the most impactful way for the world to lower emissions, by reducing reliance on  coal. Recently an overly hasty effort to transition to renewables in Europe has exposed weaknesses in their energy strategy and created further demand for natural gas. Although $35 per MMBTU is likely unsustainable, the long term demand for LNG is clear.

NEXT and TELL both offer the opportunity to invest in continued global demand growth for natural gas. We are invested in them.

We have three funds that seek to profit from this environment:

Energy Mutual Fund Energy ETF Real Assets Fund

Please see important Legal Disclosures.

Please sign up here for our webinar, Making Sense of Rising Inflation and the Global Energy Crisis, on Thursday, December 16 at 12 noon Eastern.

The Market’s Sanguine Inflation Outlook

Last week Fed chair Jay Powell pivoted away from “transitory”, and adopted a tone more in keeping with the market’s newly revised interest rate forecast. As a result, today’s yield curve is far away from the September FOMC projections, even though they’ll be revised at this month’s meeting.

The most important question for bond investors must be the persistence of negative real rates – currently around –1.0% on the ten year. Moreover, the market has lowered expected short term rates five years out compared with their level at the September FOMC (the last time they issued projections materials). The biggest change in the meantime has been the Fed’s assessment of the inflation outlook.

Real rates have been declining for years, and so has the economy’s resilience to high rates. The eurodollar curve is currently priced for the Fed Funds rate to peak in two years at around 1.5% and for policy to remain on hold from then on. Ten year treasury yields are inexplicably at 1.4%, with inflation running over 6% year-on-year, tapering set to begin and the Fed likely to raise rates as soon as next spring if they decide to accelerate tapering later this month.

It doesn’t seem likely that the Fed will be able to restrain economic growth much without seeing long term yields rise. A 1.5% peak Fed Funds rate probably isn’t enough.

Former NY Fed president Bill Dudley recently commented that the market was extremely sanguine about how little increase in rate will be necessary to curb inflation. Five year inflation expectations derived from the treasury yield curve are 2.7%, and ten years 2.5%.

Add it all up, and the market is priced for Fed Funds to peak at 1% or so below inflation, which is nonetheless expected to moderate without monetary policy becoming restrictive. If someone articulated such an outlook, they’d be regarded as impossibly optimistic, yet it’s the market forecast.

One of the great pleasures of writing this blog is receiving comments on it. I remain in touch with many former colleagues and business associates as a result. Last week our post on the Owners’ Equivalent Rent, or OER (see The Subtle Inflation Pressure From Housing) drew an emailed response from Donald H. Layton, former CEO of Freddie Mac from May 2012 until June 2019. Now that he is enjoying a well-earned, though still typically industrious, retirement Don is writing papers on public policy with respect to housing. He has much to offer on the subject.

For 14 years of my 23 year JPMorgan career (1986-2000) I worked under Don Layton. As vice chair, Don led global capital markets and investment banking, which included my business of US interest rate derivatives trading.

Don is one of those rare executives able to combine strategic vision with an intense focus on detail. He often kept managers on their toes by revealing more knowledge about their business unit than might be expected from one of the bank’s top three executives. He was a superb leader who inspired loyalty and respect in equal measure. To my great pleasure we have remained in touch, and our annual reunions on the golf course followed by lunch inevitably include thought-provoking discussions about finance.

A couple of months ago Don wrote an excellent blog post about OER (see What Do Runaway House Prices Mean For The US?). He noted three disadvantages of the current housing boom: increasing inequality (if you don’t own a home and/or stocks, you’re slipping farther behind the asset-owning classes); decreased home ownership (it’s harder than ever for first time homebuyers) and artificially lowering inflation (because OER fails to adequately reflect the costs of home ownership, especially for current buyers).

Don noted, as we often have on this blog, the problems with estimating the cost of shelter by surveying homeowners on the possible rental income they might earn on their home. He notes that, “while the FHFA (Federal Housing Finance Agency) is saying that house prices went up 19.2 percent over the past year, the OER says that the cost of shelter for owner-occupied homes went up by only 2.43 percent! That’s a lower percentage increase than even for the median rent of an actual rental unit.”

Don goes on to argue that, “This result fails the common sense “smell test. The OER approach may work adequately well in normal times, but it does not seem to be working properly under the stress of today’s unprecedented increases in house prices.

“Unfortunately, given the high percentage of the typical household budget that is taken up by shelter, claims of today’s inflation being transitory may therefore not be well-founded. This suggests that policymakers are flying more than a bit blind, not seeing the inflation that the citizenry feels (especially those looking to buy their first home). That does not bode well for those policymakers, especially at the Federal Reserve, making the best decisions.”

US monetary policy would be better served if such clear thinking was more prevalent among policymakers.

CPI inflation is likely to remain stubbornly higher than the FOMC might like as home price appreciation filters through to rent, and their theoretical analog OER. Market forecasts of a peak in the Fed Funds rate of 1.5% seem very optimistic.

We have three funds that seek to profit from this environment:

Energy Mutual Fund Energy ETF Real Assets Fund

Please see important Legal Disclosures.

Please sign up here for our webinar, Making Sense of Rising Inflation and the Global Energy Crisis, on Thursday, December 16 at 12 noon Eastern.

The Subtle Inflation Pressure From Housing

The Administration’s explanation for the less than transitory inflation relies on supply bottlenecks and a faster than expected rebound in energy demand. Both are wrong. The Wall Street Journal recently made an interesting argument that inflation will persist (see Another Reason Inflation May Be Here to Stay).

Personal Consumption Expenditures (PCE) on all goods (i.e. both durable and non-durable) is running well ahead of the long-term trend. March’s $1.9TN covid relief plan marked the end of Joe Biden’s presidential honeymoon. Critics of this and other elements of excessive fiscal stimulus point to the reason goods purchases are so strong with consequent higher inflation. Apparently, government planners expected prior spending patterns to be repeated, but services expenditures don’t show the same above trend trajectory.

In short, more of this $1.9TN was channeled into goods purchased online, and less than expected on services, reflecting that a portion of the population remains wary about going out to dinner, movies and other entertainment.

Services represents two thirds of PCE and goods only one third. So it might seem plausible to assume goods inflation will moderate, reinforcing the discredited transitory narrative.

However, as the Wall Street Journal points out, housing and healthcare make up over half of services PCE. With the government largely picking up the cost of Covid-related healthcare on top of Medicare and other Federally-financed programs, this sector is distorted.

But the Housing and Utilities component is dominated by rents – both actual and imputed. The WSJ notes that leases come up for renewal infrequently, and that eventually the buoyant real estate market will translate into higher rents.

This may be true – but the WSJ overlooks the fact that two thirds of American households own their homes. For them, the cost of shelter is based on Owners’ Equivalent Rent (OER), the often criticized estimate of the value of the shelter (a service) their home provides. This shows up in the services PCE.

For those unfamiliar with the distortions caused by OER, inflation is all about the cost of goods and services, not assets. A home is an asset that provides shelter, a service. Inflation statistics try and separate the two, by surveying home owners on what they think they could rent their house for. This is the estimated value of shelter. Because home ownership is so common in the US, a large chunk of estimated housing costs are based on OER. (for a more detailed explanation, see Why You Can’t Trust Reported Inflation Numbers). The Bureau of Economic Analysis published a revised explanation of housing costs earlier this year.

OER is a creation only a Bureau of Labor Statistics economist could love. It’s not supported by any cash transactions, but it’s used to estimate around $2TN of PCE. As the chart shows, it bears little relationship to the Case-Shiller index which tracks actual house prices – probably because most homeowners are puzzled when confronted with the survey question about rent. A defense of OER is that, over very long periods of time (i.e. a decade or more) it tends to track home prices – and sure enough since the last peak in home prices prior to the 2008 Great Financial Crisis the two series’ have similar returns.

Where next for OER? It’s hard to forecast since it’s drawn from survey responses and not actual transactions. But it’s unlikely to decrease its growth rate, and at least some homeowners might be expected to raise their imputed rent estimate in response to the strong housing market.

A rising OER will drive the services PCE higher, causing its trajectory to return to its prior trend or even exceed it. Although there won’t be any increase in cash receipts as a result, calculated spending on services will be higher and so will inflation, since CPI also derives its housing methodology from PCE.

Easing supply constraints may allow goods inflation to moderate, although there are no signs of that yet. Whether it does or not, services inflation seems likely to move higher. This will maintain the pressure on the FOMC to respond to inflation, even though OER doesn’t impact household budgets in the same way that, say, rising gasoline prices do.

It may even cause some at the Fed to comment about the weaknesses of OER, although strength in this metric would simply be a delayed reflection of the actual appreciation in home prices we’ve all seen.  Either way, inflation is likely to remain persistent not transitory, a term Fed chair Powell retired at his Congressional testimony yesterday.

Join us on Thursday, December 16th at 12 noon Eastern for a webinar where we’ll provide an update on the midstream sector during rising inflation.

We have three funds that seek to profit from this environment:

Energy Mutual Fund Energy ETF Real Assets Fund

Please see important Legal Disclosures.


The Emergence Of Omicron Covid

For the past few months the eurodollar futures market has steadily priced in the FOMC’s abandonment of “transitory” in its assessment of inflation. More often than not the Fed follows the market. The typical absence of public comments that precedes FOMC meetings was extended while Biden contemplated renewing Powell’s term. In short order, Powell’s reappointment was announced, several Fed governors publicly contemplated faster tapering and the release of minutes revealed a lively debate. “Transitory” has become a derogatory adjective in finance betraying cognitive dissonance. As in, “The hedge fund manager described his losses from shorting meme stocks as transitory.” Something is transitory, until its permanence becomes painfully obvious.

President Biden and Fed chair Powell had their discussion during which no doubt Biden hoped for a lethargic policy response to inflation while Powell demurred. With Powell’s reappointment secure, all that was left was for the next FOMC meeting to make the taper briefer, in preparation for three to four rate hikes beginning next spring.

B.1.1.529, the new Covid mutation identified in South Africa, has scrambled everything. The World Health Organization has assigned it the Greek letter “Omicron” since that’s the next one in the alphabet. The $8 drop in crude oil will be welcomed by the Administration which will likely claim partial credit since it so closely followed the release from the Strategic Petroleum Reserve. Eurodollar futures removed one projected tightening from next year.

The energy sector modestly outpaced the S&P 500’s 2.2% fall, dropping 2.6% (defined as the American Energy Independence Index).

Last year when investors asked for our outlook on midstream energy infrastructure, we’d often note that the path of Covid would be an important factor. We all became amateur virologists in attempting to project investment returns. The vaccine ushered in economic growth powered by an excessive fiscal response, with the removal of monetary accommodation (albeit very late).

How much has changed?

As before, the near-term direction depends on the virus. If existing vaccines prove ineffective, economic activity will slow until a new one is created and distributed. Some fear the new mutation may require a new vaccine. It’s a science question not an economic one.

The pipeline sector has just reported solid 3Q21 earnings. Cash flows continue to grow, buoyed by recovering volumes and continued financial discipline. Progressive energy policies have been more constructive than expected – impeding sufficient supply of oil and natural gas has improved prices and sentiment. COP26 revealed the gulf that exists between the climate goals of OECD countries and the growth objectives of emerging countries. Unilateral policies to accelerate the energy transition increase prices for consumers and mostly serve to accommodate increased emissions from China, India and others.

Given the uncertain near-term direction, it can be helpful to remember the long-term growth outlook for US energy consumption. Although renewables command excessive media attention, the chart shows that the big energy story of the past decade was the huge drop in coal consumption which was mostly offset by increased natural gas.

The Energy Information Administration expects the US to increase consumption of renewables, natural gas and even petroleum products over the next three decades. “Other renewables”, which is mostly solar and wind, is forecast to grow from 7.5 quadrillion BTUs to 17.5 by 2050. Even then it’ll still provide less than half the energy of natural gas.

Energy transitions are slow, and forecasters have a long history of overestimating the speed of change. Just over four years ago we noted Tony Seba’s forecast (see A Futurist’s Vision of Energy) that by 2030 US consumers would only be buying Electric Vehicles (EVs). Their share is currently around 4%, with Tesla dominating. Although we expect EVs to grow like most forecasters, reaching one third market share (defined to include hybrids) as expected by LMC Automotive seems more realistic. Electricity produced from natural gas will still be the dominant source of power generation. Incidentally, Exxon Mobil’s 2030 EV market share forecast back in 2017 was 10% — likely to be low. Forecasting adoption rates for new technology is hard.

Near term market direction will depend on the Omicron variant. Over a year or more, we still expect the constructive fundamentals of the US energy sector, especially natural gas, to drive cash flows and stock prices higher.

Join us on Thursday, December 16th at 12 noon Eastern for a webinar where we’ll provide an update on the midstream sector during rising inflation.

We have three funds that seek to profit from this environment:

Energy Mutual Fund Energy ETF Real Assets Fund

Please see important Legal Disclosures.


US States Choose Reliable Power

On Monday the Energy Information Administration (EIA) announced that 27.3 Gigawatts (GW) of natural gas power plants will be added to the US fleet over the next three years, representing a 6% increase from current capacity. The US is blessed with abundant supplies of natural gas, sufficient to power the country for many decades.

Many US states are pursuing sensible energy policies designed to maintain reliability and affordability, as well as diminish our reliance on coal. The map below shows where these power plants are being added – generally close to existing natural gas supplies. New York state is conspicuously not taking advantage of this opportunity, since its energy agenda has been hijacked by progressives.

The COP26 in Glasglow revealed the divide we’ve often chronicled between OECD countries who want lower CO2 emissions and emerging economies that are focused on raising living standards, which requires more energy. The inability of COP26 to produce anything meaningful exposed the ambivalence of countries like the US to an overly rapid energy transition. Higher crude oil has brought solicitations to OPEC to increase supply and now sales from the Strategic Petroleum Reserve (SPR).

The first failure of climate extremists is their inability to convince consumers that they should give up reliable fossil fuels and opt for higher-priced intermittency.

The most important development this year in US power generation is the resurgence of coal demand at the expense of natural gas. After several years of losing market share, domestic demand for coal has rebounded because of improved relative pricing.

US natural gas for January ‘22 delivery touched $6.50 per Million BTUs (MMBTU) a month ago, before retreating to its current level of around $5. US consumers are not immune to the policy errors in other countries (see Why The Energy Crisis Will Force More Realism) but are thankfully being spared from the type of Greta-inspired outcomes endured in the UK (see U.K. Power Prices Soar Above £2,000 on Low Winds). The new natural gas power plants noted by the EIA are an example.

By contrast, nothing newsworthy is happening with US solar and wind. They continue to grow — since January 2018 solar’s market share of US power generation has increased from 1.2% to 2.2%, and windmills have gone from 6.0% to 7.5%.

It’s possible to create some impressive numbers from this – solar output has a Compound Annual Growth Rate (CAGR) of 20% since January 2018, and wind has 9%. But as the charts show, if both disappeared tomorrow, we mostly wouldn’t notice. Coal use is up 12% in the past year, and currently generates almost twice the power of solar and wind combined. Vaclav Smil has shown that energy transitions play out over decades. Renewables will be small with a high CAGR for many years to come.

US energy-related CO2 emissions are forecast to be +7% this year – not just because energy consumption is rebounding from covid-depressed levels, but also because of this adverse fuel mix. Next year is forecast to be +1%, in part due to a shift back towards natural gas by utilities.

This leads to the second failure of climate extremists – their refusal to differentiate among fossil fuels has impeded their effectiveness. Had they pushed public policies that encouraged utilities to switch from coal to natural gas, perhaps with a carbon tax, the trend towards natgas would have continued this year and CO2 emissions wouldn’t have jumped as much. Instead, their purist approach has left market forces through cheap natural gas to drive most of the reduction in CO2 emissions the US has achieved.

The US even declined to join 40 other countries in pledging to phase out coal within two decades. This puts us alongside China, the world’s biggest emitter and consumer of half the world’s coal.

American voters want to reduce emissions as long as it doesn’t lead to higher energy prices. Administration efforts to jawbone crude oil prices lower reflect that reality. High gasoline prices should incentivize switching to electric vehicles (which are more likely to rely on natural gas power plants than any other fuel). Instead, the White House is trying to diminish this incentive with sales from the SPR. Foregoing the coal pledge is another example of pragmatism over-ruling progressives.

Pragmatic policies in many states and the White House’s incoherent energy strategy are helping us avoid the poor planning of the UK, Germany and California. Many states such as Florida are adding natural gas capacity in order to preserve reliability. It’s one more reason why migrants from New York state with its poorly conceived energy policies will continue to move to the sunshine state.

Join us on Thursday, December 16th at 12 noon Eastern for a webinar where we’ll provide an update on the midstream sector during rising inflation.

We have three funds that seek to profit from this environment:

Energy Mutual Fund Energy ETF Real Assets Fund

Please see important Legal Disclosures.


Will The Fed Catch Up With The Curve?

It’s easy to criticize the Fed. They’ve maintained their uber-accommodative monetary policy for probably a year longer than needed. Once the vaccine breakthrough was announced last November, prudence dictated that they anticipate an economic rebound and begin normalizing rates.

Instead their bond buying has had the effect of partially monetizing Federal debt issued to fund the huge fiscal response to the pandemic. The March stimulus package was clearly an additional $1.9TN in buying power that consumers collectively didn’t need, which is why personal consumption expenditures on goods are running well above the long term trend.

The relevant quote from former Fed chair William McChesney Martin, Jr., as lifted from his written speech is, “The Federal Reserve…is in the position of the chaperone who has ordered the punch bowl removed just when the party was really warming up.” Instead, current chair Jay Powell and his colleagues have been pouring in the Absolut.

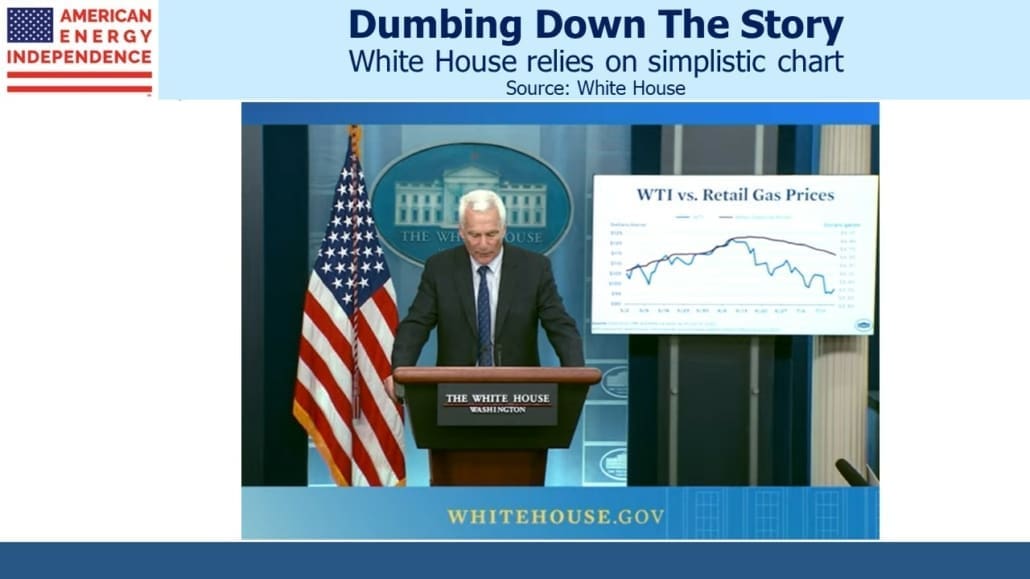
Housing is another example. The FOMC must be the only group of Americans unaware that suburban residential real estate is red hot, making it more expensive for the two thirds of American households who choose to own their home to find shelter. Owners’ Equivalent Rent (OER) allows them to pretend that nothing untoward is happening, in willful defiance of the S&P/Case-Shiller U.S. National Home Price Index (C-S).

By coincidence, since the last housing peak in July 2006 both indices have increased by approximately the same amount. The real estate market has felt a lot different to consumers versus the number crunchers at the Bureau of Labor Statistics who produce OER. They might even argue that this shows OER is a decent proxy for housing. However, the C-S is +20% over the past year.

The Fed is still buying $40BN of mortgage-backed securities every month. Even though they’re winding down, at their current tapering pace they won’t be completely out of the market until June.

It’s easy to criticize the Fed. Markets have priced in a significantly more rapid tightening than the most recent FOMC projection materials, with almost no public comments from officials that such was likely. With inflation running at 6.2% it’s easy to see why.

So it’s interesting to consider the defense of the Fed, one that the Fed chair may offer once Biden has announced his choice.

Reports that the White House is considering replacing Powell with Lael Brainard are likely all optics, and although some commentators perceive Brainard as more dovish, the FOMC has maintained the monetary gusher without much public dissent. They’re all doves.

It starts with financial markets – one of the more interesting recent charts is the one showing an unprecedented drop in the correlation between short term and long term rates. The bond market used to be a real-time measure of Fed policy, but inflation expectations and monetary policy seem to play less of a role than in the past. This may be why the correlation has dropped.

Anchored by central bank buying and other return-oblivious investors, bonds seem impervious to rising consumer prices.

Ten year treasuries at 1.6% are hardly onerous unless you think you’re entitled to a return on your money, a requirement bond investors have abandoned. TIPs yield –1.1%, so the ten year inflation expectation is 2.7%. This is somewhat higher than the Fed’s 2% target but not out of control, and not inconsistent with the Fed’s optimistically transitive narrative.

The recent shift in tightening expectations has been almost exclusively reflected in the short end of the curve. The precise market forecasts offered by eurodollar futures show that traders expect any tightening to be completed within two years or less, with stability thereafter. Ten year treasuries yield the same 1.6% as they did in May.

The Fed’s $8.5TN balance sheet has helped depress bond yields, but now the buying will slowly stop and the market knows that. There’s no shortage of other return-insensitive buyers for debt of a profligate government, starting with Japan ($1.3TN) and China ($1TN).

Interest rates are the transmission mechanism by which lenders receive compensation for inflation. In a world of negative real yields, perhaps the economy can tolerate some inflation.

The buoyant stock market is another financial market indicator that current and expected inflation aren’t creating any big problems. Quarterly earnings show that many companies seem able to pass through higher costs to their customers.

There are numerous signs that the jobs market is strong, with September job openings of 10.4 million just below August’s record of 10.6 million. Workers are increasingly willing to quit for a better job, and companies routinely complain of difficulties hiring enough qualified workers.

Unusually, inflation has become a political problem before becoming a markets problem. More common, for those of us old enough to remember tightening cycles, is for bond yields to rise, compensating investors for the risk of higher inflation and pressuring stocks. The administration, usually subtly, pushes back.

Today talk of inflation is everywhere, but anyone invested in stocks is still ahead of the game. For my part, stopping at a gas station has become a cause for unseemly celebration as I happily fork over an extra $40 while smiling at the bull market in pipeline stocks.

Borrowers are also benefiting from continued low rates.

The point is, today’s inflation is not an economic problem but a political one. Raising rates so as to drive up the unemployment rate won’t produce more truck drivers and will only appease the talking heads who are the visible pressure for action. An FOMC that has willingly monetized debt, synchronized easy policy with enormous fiscal stimulus and promoted a housing bubble doesn’t look like a group to willingly cause economic damage by hiking rates precipitously.

The FOMC will likely move slowly, because there’s plenty of justification for doing so. However, vice-chair Richard Clarida suggested on Friday a speedier tapering, which would allow faster tightening in line with current market prices. We think the FOMC’s dovish tendencies will incline them to move slowly – the market is priced for a more aggressive response.

We have three funds that seek to profit from this environment:

Energy Mutual Fund Energy ETF Real Assets Fund

Please see important Legal Disclosures.
Do Pipelines Move With Crude?

We often get questions on the correlation between pipeline stocks and crude oil. Most investors intuitively believe they are linked – and inconveniently they seem especially so when prices are falling. March of last year is a recent example.

Pipelines are a volume business — the “toll model” has often been used to describe the fact that it’s volumes passing through the pipelines, not the value of the commodity, that drive midstream economics. To the extent that high prices imply increased production it can appear that they should be related.

This year pipelines and crude oil have both marched higher, propelled by the strong economic recovery from covid and restrained investment in new output by energy companies. US oil production remains 1.5 Million Barrels per Day (MMB/D) below its pre-covid peak. The volume-driven pipeline industry ought to be suffering with less crude oil passing through its infrastructure – except that the industry’s new financial discipline has driven free cash flow higher.

Lower volumes are a result of constrained growth capex, both among the upstream customers of pipelines as well as the midstream sector itself.

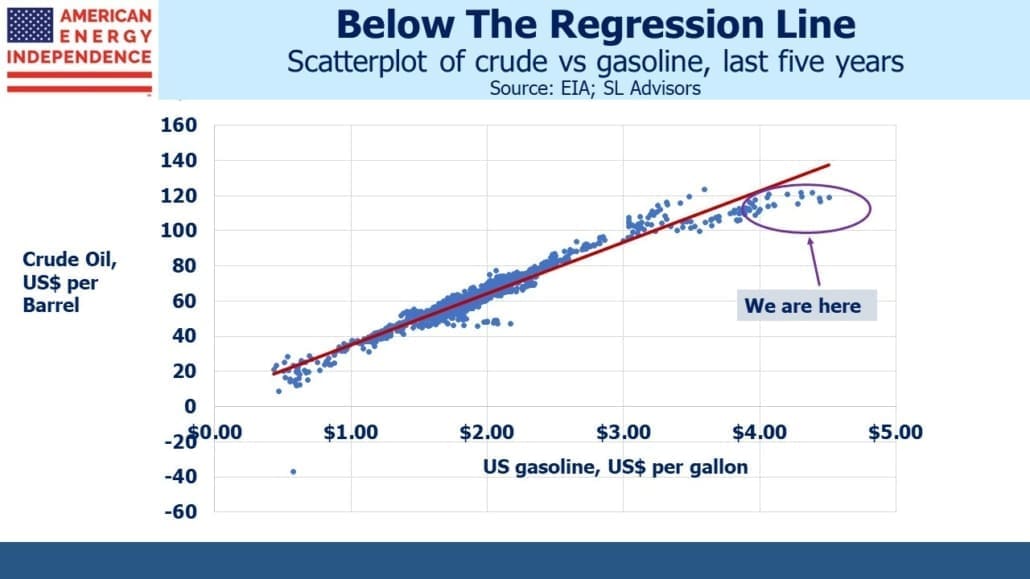
Although visually crude oil and pipelines (defined here as the American Energy Independence Index, AEITR) move together, the correlation isn’t that high. Over the past decade the average 90 day rolling correlation of daily returns is 0.41. As the table shows, year by year it doesn’t stray too far from that.

In 2015 when crude oil and pipeline stocks were falling, some clients asked us if we’d considered hedging by shorting crude oil futures. It was a reasonable question, since the sector seemed to follow oil prices relentlessly lower. But the correlation shows that it’s really a weak relationship. And the devil is in the details – any hedge would require a hedge ratio. How much crude oil should a portfolio short in order to hedge its equity exposure? The unstable relationship means that the choice of hedge ratio would depend on the past time period examined, revealing it to be a somewhat arbitrary choice.

Unable to identify a reliable hedging strategy we rejected the suggestion. In mid-2017 such a fund was launched (see Oil-Hedged MLP ETF Launches at Propitious Time) but it’s since closed, confirming how hard it is to get the hedge ratio right.

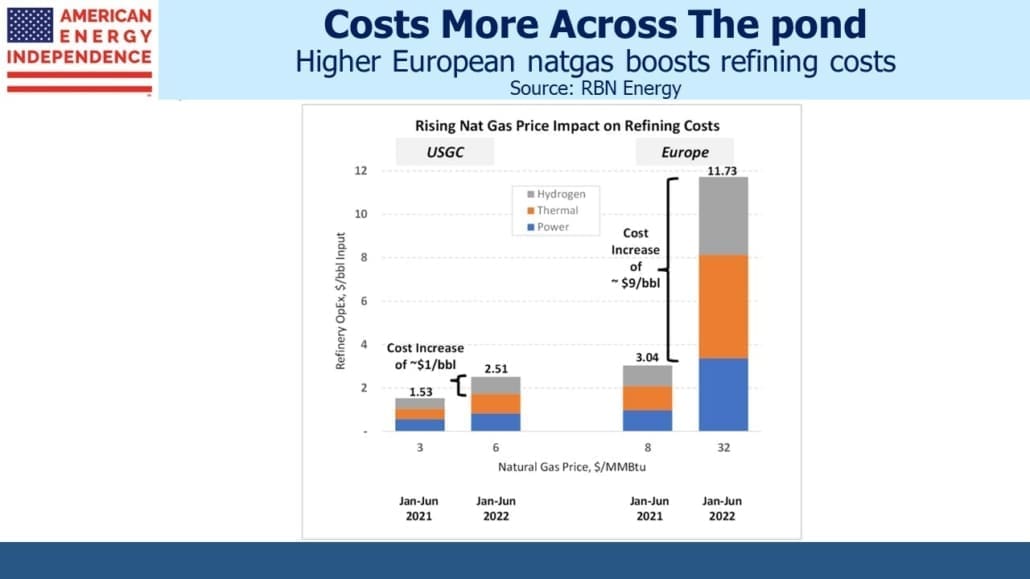
Natural gas is a more important source of cashflows for pipeline stocks than crude oil, but here the correlation is non-existent. The US is fortunate to possess decades worth of reserves of natural gas. Moreover, because exports of Liquified Natural Gas (LNG) are limited by the availability of specialized infrastructure to chill it down to 1/600th of its volume so it can be pumped onto an LNG tanker, US consumers have been mostly insulated from the energy crisis sweeping through Europe and Asia. EU governments and the UK have committed a series of policy errors in recent years. These include: becoming too reliant of intermittent solar and wind; cutting back local production and storage of natural gas; and relying too heavily on Russia’s capricious supply schedule.

Unexpectedly quiet weather in the normally blustery North Sea has once again cut electricity generation from windmills (see U.K. Power Prices Soar Above £2,000 on Low Winds). The £2,000 price per MWh cited should be compared with the $75-$140 range that US customers pay. Converted to US$, UK electricity is being sold for as much as $2,700, 20-36X times as much as American wholesale prices. Even the policymakers in California haven’t been able to screw up as badly. The UK government is subsidizing prices to avoid the political outcry that would quickly follow, so in effect the entire country is paying for past energy policy blunders.

Lowering CO2 emissions is a worthy goal, but examples of the folly of pursuing the agenda of climate extremists keep piling up.

One of the most positive developments of the year for the pipeline sector has been the steady recovery in natural gas volumes. High crude prices have buoyed investor sentiment, but the return of domestic natural gas output to its pre-covid high represents a tangible benefit that has boosted earnings at companies such as Williams and Cheniere.

COP26 showed that emerging economies such as China and India continue to value raising living standards over reducing CO2 emissions. India’s per capita GDP is $1,900, compared with the US at $63K. Hundreds of millions of Indians live in poverty. Fighting global warming isn’t resonating with them or their government. The US can help by encouraging India and other countries to buy more natural gas and use less coal. That’s the pragmatic solution, and America is well positioned for it.

We have three funds that seek to profit from this environment:

Energy Mutual Fund Energy ETF Real Assets Fund

Please see important Legal Disclosures.
 

The Best Odds Aren’t In Las Vegas

Following last week’s 6.2% inflation print, eurodollar futures fully priced in 0.75% of tightening by the end of next year. The approximate rate path envisages tapering by the summer, and rate hikes commencing around the same time. Beyond December ‘23 the curve is so flat that in effect the market expects the tightening cycle to be more or less completed, eighteen months after it began.

Ten year projected inflation edged up to 2.7% as derived from the treasury market. Although this is the highest it’s been, that figure doesn’t suggest the market believes inflation is out of control. With ten year treasuries still below 1.6%, it’s more accurate to say that the market expects the Fed to concede defeat on the transitory narrative and raise rates, even though the long term inflation outlook isn’t that far from the Fed’s 2% target.

The Fed may follow the market’s lead. The FOMC is notoriously poor at forecasting and for years projected a higher neutral rate than futures. Public comments suggest increasing discomfort among some FOMC members with persistently elevation inflation.

And yet, with their new policy regime targeting maximum employment with increased tolerance for a short term inflation overshoot, reversing the improvements achieved in the labor market will be a tough pill to swallow. The Warren/AOC wing of the Democrat party is likely to be a vocal critic of rising rates.

Hence the Administration’s growing focus on inflation. Although higher energy prices and supply constraints are two major symptoms, the real cause is surging demand boosted by the $1.9TN covid relief stimulus passed shortly after Biden’s inauguration. This is seen most clearly in the overshoot of personal consumption expenditures on all goods.

White House discussions with companies about logistics and pleas to OPEC to raise production overlook the fact that the US fiscal response to Covid was initially correct but became profligate once the welcome vaccine news was released a year ago. Both Congress and the Fed have overdone it.

Modern Monetary Theory (MMT) holds that because a government cannot go bankrupt in its own currency, deficits don’t matter. The constraint on unlimited fiscal largesse is found when Federal spending outruns the economy’s ability to provide goods and services without causing inflation.  We have found that limit – and Congressional Democrats appear set on pushing even further unless Joe Manchin provides a brake.

MMT purists should by now be advocating fiscal restraint to offset the uber-stimulus, but they will not. So the White House sees a brief window to convince Americans they have inflation under control, before they fear the Fed will be compelled to act. The market forecast of three 2022 tightenings by next year may be right, but this is a very dovish FOMC. There isn’t much economic pressure for a Fed response, since bond yields remain low and stock prices close to all-time highs.

Some economists think the Fed should tighten. The market is conceding they will but not for long. The yield curve is at the extreme. It wouldn’t take much to cast doubt on the projected 0.75% of hikes next year.

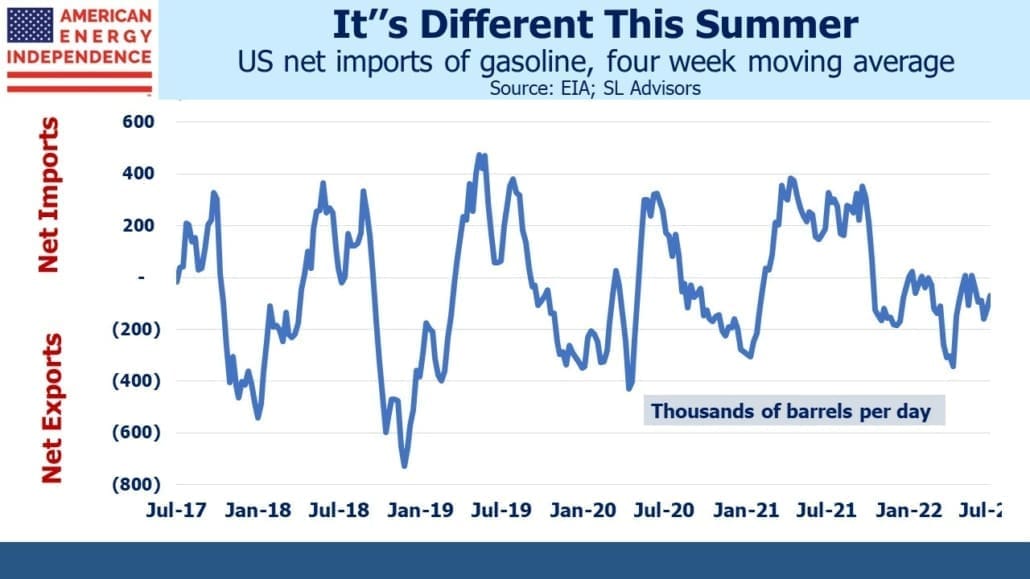
Many readers enjoy the travel photos from past trips, so see below from last week. The Grand Canyon needs no explanation – we hiked in both directions along the south rim trail and each view was more spectacular than the last. National parks have a mask mandate indoors that even extends to certain outdoor areas too. It was mildly irritating and widely ignored.

Several people recommended a visit to Sedona. Boynton Canyon with its sheer red rock walls attracts hikers, many of whom find the location spiritual and settle down to meditate. Someone we met referred to it as “Everyone’s Cathedral”.

We ended in Las Vegas, and what happened in Vegas will remain in Vegas. I am not a gambler – it’s hard enough finding attractive odds in financial markets. When I told one friend that losing $50 in a casino would ruin my day, he said I’d be unlikely to find a table offering such low stakes.

The pipeline sector and inflation trades offers far better odds.

We have three funds that seek to profit from this environment:

Energy Mutual Fund Energy ETF Real Assets Fund

Please see important Legal Disclosures.
Electrification Will Drive Natural Gas Demand Higher

Democrat policies have so far been more positive than many expected for the energy sector. Those regions and countries that have aggressively pursued renewables have demonstrated the challenges that arise when power is too reliant on unreliable, weather-dependent sources. Crossing a 20% share from solar panels and windmills seems to be the threshold at which problems occur.

Liquified Natural Gas (LNG) shipments continue to change hands at $35 per Million BTUs (MMBTU) in Europe. Underinvestment in natural gas supply and storage is one of the reasons.

The infrastructure bill that passed the House last week includes $73BN to upgrade the nation’s power grid, along with $7.5BN each for electric vehicle chargers and low-emission buses and ferries. Shifting transportation to run on electricity rather than gasoline is key to lowering CO2 emissions.

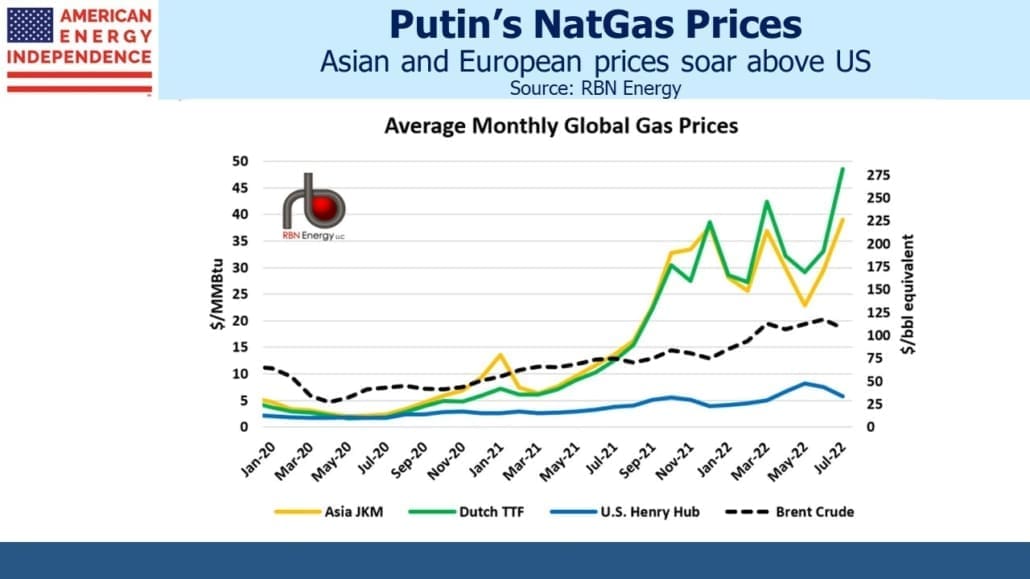
Natural gas provides 36% of America’s electricity. This is down from 39% last year, mostly because higher natgas prices have caused utilities to switch to coal, whose share has risen from 20%-24%. It’s not a trend that climate extremists will welcome, but every protester against pipelines and natural gas production has helped make this happen. Non-hydro renewables are slowly picking up market share, and are expected to reach 15% next year. Notably, the US did not join more than 40 countries in pledging to phase out domestic coal consumption. On this we joined with China, revealing the ambivalence of US climate policy and the importance of Joe Manchin (D-WVa). The White House needs Manchin’s support and West Virginia produces more coal than any other US state other than Wyoming.

Although natural gas has lost some ground in electricity generation, rising LNG exports have made up the difference. Moreover, the US Energy Information Administration sees continued growth in domestic consumption, driven by increased demand from the power and industrial sectors. Although it’s not obvious to a casual follower of renewables developments, in three decades natural gas is still projected to provide twice as much energy to Americans as renewables.

This doesn’t take account of exports, which are virtually certain to grow as emerging economies use more energy to raise living standards. Cheniere provided confirmation of this trend in recent weeks with several announcements of long term LNG supply agreements with foreign buyers (see It Takes Energy To Keep Up With Inflation). On most forecasts the world’s energy needs are likely to increase faster than renewables generation, so although solar panels and windmills will gradually pick up market share we’re likely to use more of everything. The COP26 doesn’t seem to have done much to change that.

The infrastructure bill has supporters on both sides. Investing in transportation through fixing roads and bridges and improving the rail system. The Build Back Better bill, whose passage is still not assured, includes home energy tax credits and up to $12,500 for electric vehicles manufactured by US union workers. My partner Henry once noted that conventional automobiles using an internal combustion engine are in effect built around a small generator. If we were designing personal vehicles today, we might start with battery-powered instead.

The bottom line is that increased focus on electrification of transportation looks very positive for natural gas and the infrastructure that supports it. The energy transition is going well for the energy sector.

We have three funds that seek to profit from this environment:

Energy Mutual Fund Energy ETF Real Assets Fund

Please see important Legal Disclosures.


It Takes Energy To Keep Up With Inflation

Pipeline earnings last week provided further support for the bull market in energy. Cheniere is +67% so far this year. The strong global market for Liquified Natural Gas (LNG) caused them to increase their 2021 EBITDA guidance to a midpoint of $4.8BN, up $0.1BN. They also provided 2022 guidance of $5.8-6.3BN. The company has signed several long-term LNG contracts recently – Friday’s press release announced a 17 year deal with Sinochem to provide up to 1.8 million tons per annum. In recent weeks they’ve announced 13 year deals with Glencore and ENN LNG of Singapore.

Cheniere continues to be an attractive investment in spite of this year’s sharp rise. The completion of a sixth “train” (the name given to an LNG liquefaction unit) at Sabine Pass looks to be on track for 1Q22. Their growth capex needs are falling sharply, which driving free cash flow.

Morgan Stanley produces a chart of estimated sustaining capex as a % of EBITDA – what each company needs to reinvest annually to maintain its profitability. Cheniere’s situation is the best in the industry. Their stock price doesn’t yet reflect these very strong fundamentals.

The energy crisis engulfing much of the world has prompted Asian buyers to lock in long term supplies of LNG. It demonstrates that natural gas is uniquely situated among fossil fuels to benefit from the energy transition – when burned it generates typically a third to a half less CO2 than coal and doesn’t cause the same type of local pollution. Natural gas power plants are also easy to start up when weather-dependent renewables suddenly stop producing.

Alex Epstein, who wrote The Moral Case for Fossil Fuels and routinely exposes the sloppy thinking of environmental extremists, refers to solar and wind an “unreliables”. Epstein lives in California, so has some experience with expensive and unreliable power. The Golden State recently announced plans to increase its natural gas storage capacity to assure reliable power this winter. They’re finding the limits to weather-dependent power.

Oil and gas are higher because of rebounding demand, but the energy transition is another important factor. For years public policy and climate extremists have warned of stranded assets as renewables render reserves of traditional fuels uneconomic. Al Gore, who’s been warning us about climate change for decades, describes oil and gas reserves as “a subprime carbon bubble of $22 trillion, based on an absurd assumption that all of those carbon fuels are going to be burned.” Although Al Gore doesn’t drive energy sector capital allocation, extreme views like his are boosting returns by curbing new investments.

High energy prices are contributing to elevated inflation. Although Fed chair Jay Powell is retaining the “transitory” narrative, supply chain problems did not drive LNG shipments as high as $56 per million BTUs in Asia (see Energy Demand Drives Earnings Higher). Equivalent US prices are under $6. Pipeline investments have performed well as a hedge against inflation since the market low of March 2020. Although the S&P500 has rallied strongly since then, the American Energy Independence Index (AEITR), representing the North American energy infrastructure sector, has a visually better fit with inflation expectation (defined here as ten year forward inflation derived from the yield on ten year treasuries minus TIPs).  Daily returns on the AEITR versus inflation are correlated at 0.43 during this time, versus only 0.31 for the S&P500.

In his press conference last week, Chair Jay Powell once again emphasized that the FOMC expects inflation to moderate, although some commentators assessed slightly less conviction in his delivery. Eurodollar futures continue to forecast short term rates 0.65% higher by the end of next year, although a week ago expectations were even higher. The sharp flattening of the yield curve in several markets appears to be at least partially due to some hedge funds exiting losing trades in a hurry (see Balyasny, BlueCrest, ExodusPoint Ground Traders Over Losses). Nonetheless, the market is still expecting the Fed to concede a policy error and quickly raise rates.

Compared with past interest rate cycles, the Fed is in a pretty good position. Neither the energy transition nor drawn out supply problems are issues to be resolved by raising short term rates. Those states and countries that have high renewables penetration (California, UK and Germany) also have high prices. Efforts to reduce CO2 emissions will result in more costly power, and the Fed shows no inclination to lean against this.

Moreover, negative real yields on treasury securities are leading to persistent low interest rates. Although the Fed has made a mistake in waiting until now to curb its bond buying, there has been no visible penalty in terms of slumping bond prices. The traditional pressure from bond vigilantes is absent, because so much return-insensitive money is invested in fixed income. Stocks make new highs almost every day. So although financial professionals are taught about the evils of inflation from an early age, the pressure on the Fed that’s often cited is limited to criticism from Larry Summers and others. Absent any clear economic or market stress from rising inflation, the case for maintaining low rates until the pre-Covid level of employment is reached must seem compelling to Powell and many others on the FOMC.

What this means is that the Fed’s tolerance for inflation is likely to be higher than fixed income markets perceive. Combined with negative real rates, we’re a long way from where the bond market will offer an adequate return. This implies that stocks, and especially inflation-sensitive stocks, will remain the only plausible means of maintain purchasing power for a long time to come.

We have three funds that seek to profit from this environment:

Energy Mutual Fund Energy ETF Real Assets Fund

Please see important Legal Disclosures.
 

image_pdfimage_print