Williams Companies Sees A Climate Change Winner In Natural Gas

Last week Williams Companies (WMB) held their first ever ESG Event. As might be expected, the most interesting parts were on the “E” (Environmental). It’s hard to find much original to say on Social issues, and Governance should simply mean following industry best practice.

WMB is in a position to be a big winner from policies to combat climate change. If pragmatists seize control from renewable evangelists, which they should now that Democrats own the issue, they’ll realize that measurable progress on reducing emissions will come from natural gas. Rising CO2 emissions over the next couple of years will be no surprise after almost a year of lockdowns. But the deteriorating mix of power generation (i.e. more coal and negligible increase in clean energy) mean that President Biden isn’t assured of overseeing lower emissions during his current term.

There may be valid reasons but failing to reduce emissions below their prevailing level at Trump’s exit will represent failure. Gains in natural gas over coal for power generation are set to reverse this year, because of higher prices for the former (see Emissions To Rise Under Democrats). Democrat policies to inhibit oil and gas production are already having an impact. Spending on new production continues to fall.

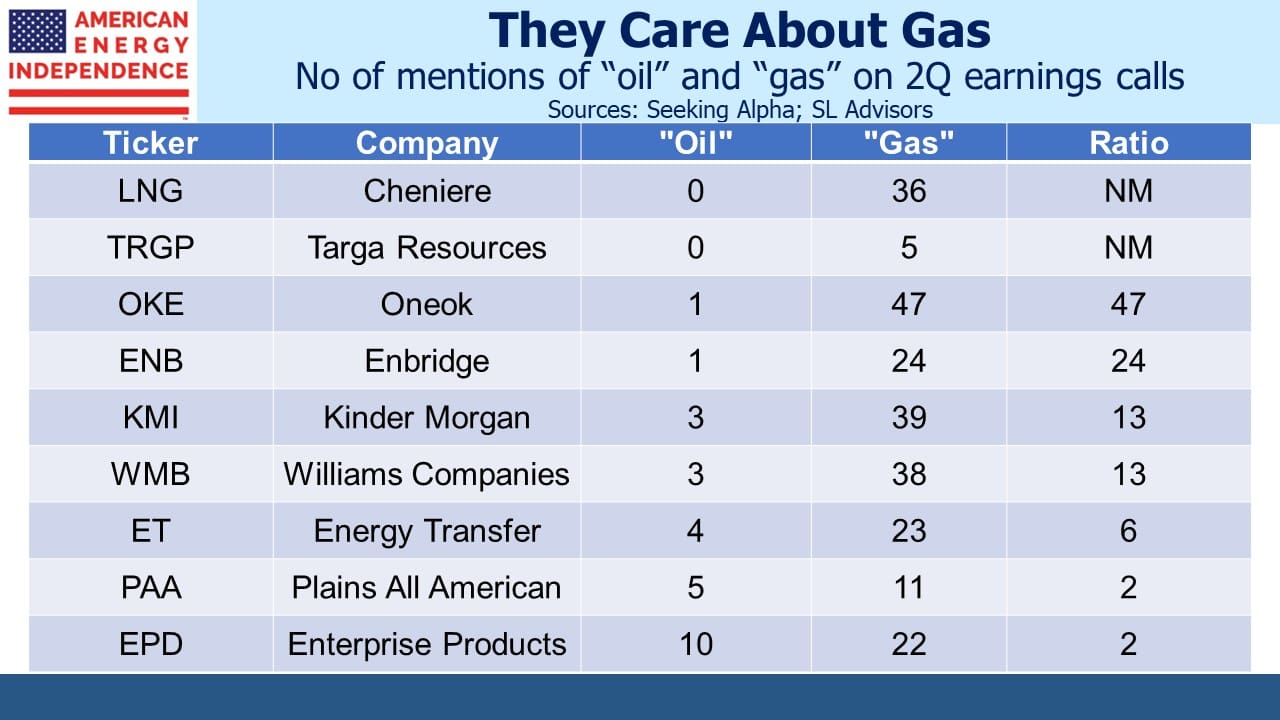
WMB moves 30% of America’s natural gas, much of it via their extensive Transco pipeline that runs from Texas to NY. Originally built to supply natural gas from the southeast to New York, in recent years it’s switched directions in places. Some natural gas now moves south, from the Marcellus Shale to Cheniere’s LNG export facilities in Texas and Louisiana.

WMB has identified 77 coal-burning power plants that are within Transco’s “footprint”. That is, they operate in a state through which Transco passes, and therefore can be supplied with natural gas should they be converted. Converting them all would lower US energy-related CO2 emissions by over 8%.

It must be the easiest 8% reduction available over the next few years, if the Administration can find a way to do it. WMB CEO Alan Armstrong clearly grasps the opportunity.

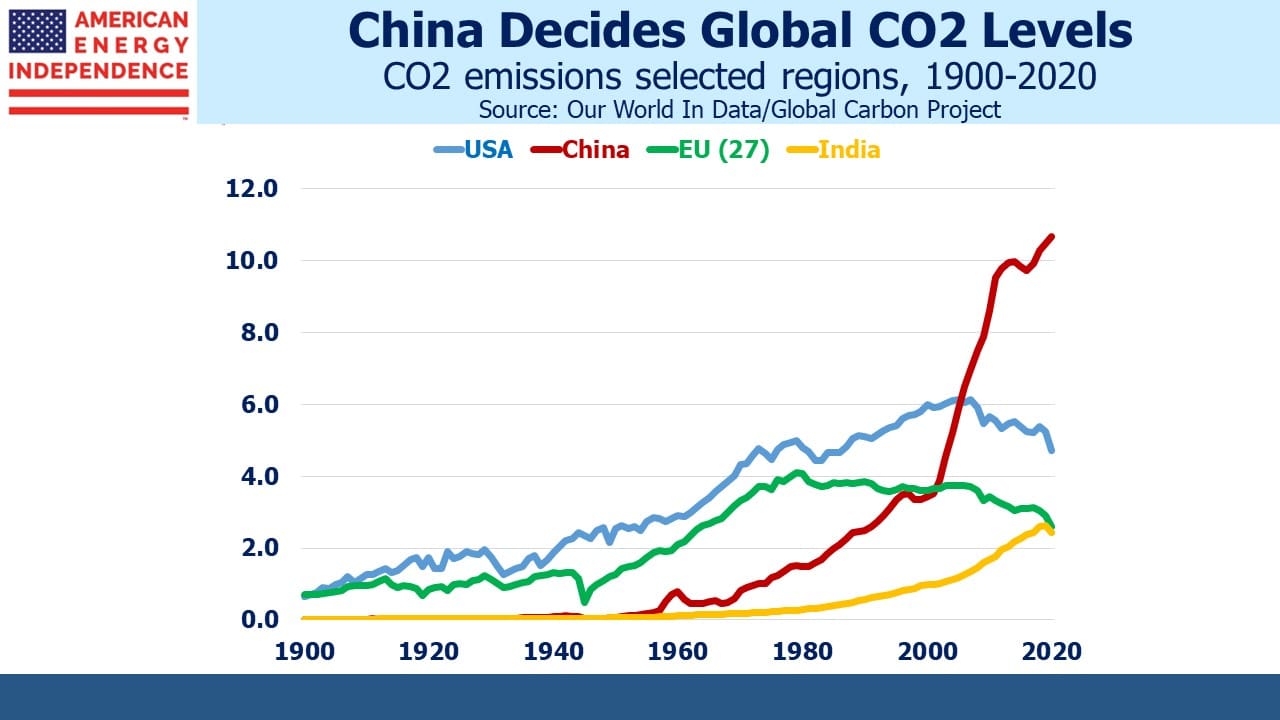
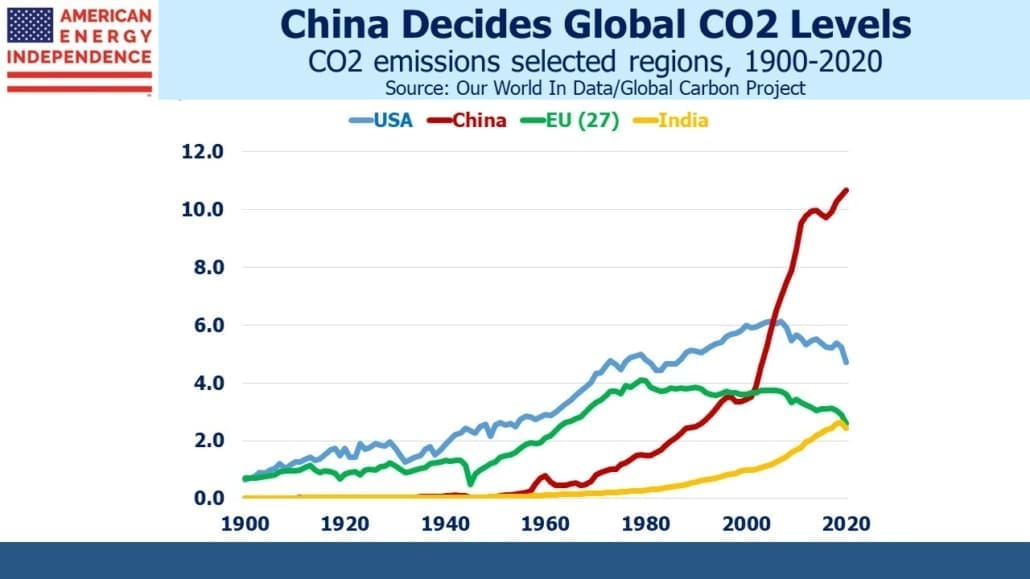
While America stands to benefit from shutting down coal plants, the world needs China to head in this direction. China burns half the world’s coal. They have four times the power output from such plants as the U.S. Much of the world’s planned investment in new coal burning power plants is in China. The Administration is already publicly calling for China to toughen its targets on greenhouse emissions, which are scheduled to keep rising for at least another decade.

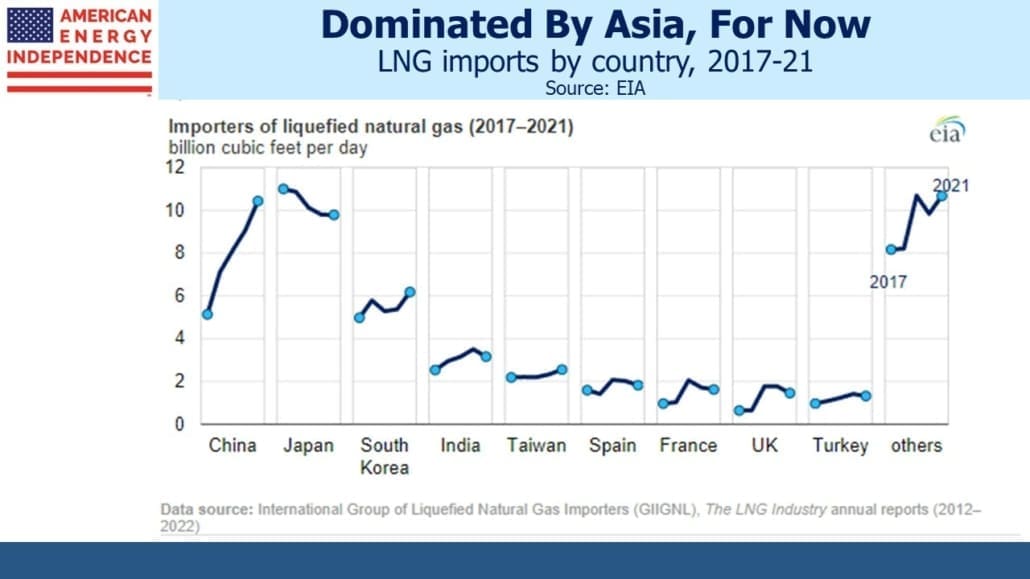
It’s no coincidence that 68% of global trade in Liquified Natural gas (LNG) is in Asia. Last year a sudden drop in demand caused shipments to plunge from Cheniere’s Sabine Pass LNG facility in Louisiana. But helped by a cold winter, European and Asian demand has driven shipments to a new record. U.S. LNG exports last year were up 10% on 2019, a result that seem improbably six months ago.

China sources almost half of its LNG imports from Australia, and the rest from other Asian countries and Qatar, because shipping costs are significant. American natural gas prices have been rising but remain among the lowest in the world. The EIA expects higher prices to drive increased production next year.

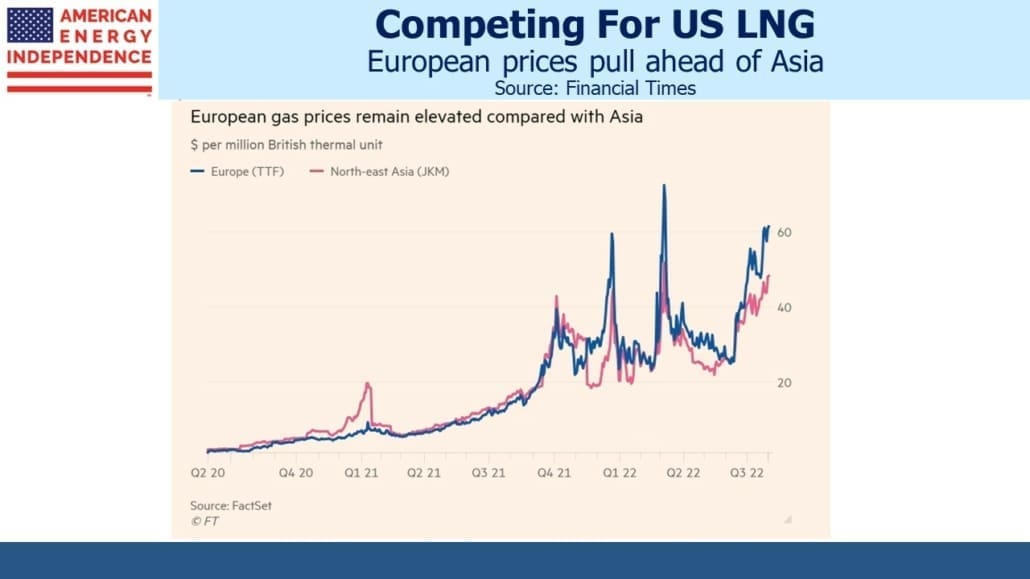
Even though U.S. LNG exports to China are incopnsequential, our LNG exports will still benefit. The recent price spike in Asian prices has slashed European LNG imports – because shipments have been diverted to Asia. Consequently, Morgan Stanley recently raised its 2021 price for European natural gas by 35% (from $4.30 per MCF to $5.80). They expect global trade in LNG to grow at a 4% compound annual rate through 2030, with Asia driving over 80% of this increased demand and rising to 73% of the global market.

The U.S. opportunity in natural gas is to substitute it for coal. The global opportunity is to take advantage of low U.S. prices to meet growing Asian demand. WMB is well positioned to be part of both solutions.

We are invested in all the components of the American Energy Independence Index via the ETF that seeks to track its performance.

Emissions To Rise Under Democrats

By the end of President Biden’s first year in office, his administration’s report card on climate change will offer some uncomfortable facts. Natural gas, after taking market share from coal for power generation under the Trump administration, will see those gains reversed. In the U.S. Energy Information Administration’s (EIA) most recent Short Term Energy Outlook, they forecast that U.S. coal consumption will increase its share of power generation from 20% last year to 24% by next. The biggest source of falling CO2 emissions in the U.S. has been the reduction in burning coal, a trend that pre-dated the last administration but continued through it.

President Biden will no more accept the blame for this unhappy shift than Trump could claim credit for the positive trend that preceded it. But policy changes are partly the cause.

Natural gas consumption grew over the past several years because it was cheap. Trump’s pro-energy stance stimulated oil and gas production, much to the chagrin of investors who would have benefited from less. Prices have been rising recently, and although there are many global macro factors at play, the chilling effect of Democrat policies on new fossil fuel production is playing a part.

Over the next two years, world liquids fuel consumption is expected to recoup the Covid slump, so that 2022 will look much like 2019. The same is true in the U.S.

Optimists will point to the growth in solar and wind energy, whose share of U.S. electricity production is set to increase, from 12% last year to 16% in 2022. However, nuclear power will lose 2% (from 21% to 19%), as continued opposition which includes climate extremists reduces one source of zero-emission power. Add in a 1% drop in hydropower, and clean energy is set to gain 1% market share over the next two years – hardly dramatic.

As a result, U.S. CO2 emissions are going to begin rising again. By the middle of Biden’s term, there will be little to point to in terms of actual U.S. results on climate change. The entire story will be one of hope. It’ll be hard to lecture China on the need to curb their emissions, which are forecast to keep rising along with rising living standards.

Fortunately, U.S. natural gas exports are expected to keep rising. Over the next couple of years it looks as if America’s biggest contribution to curbing global emissions will be enabling the foreign buyers of our natural gas to use less coal than they otherwise would.

It’s hard to pivot towards cleaner energy. The two places where public policy has been aggressive (Germany and California) have little to emulate. Increased coal consumption to counter renewables’ intermittency (Germany), unreliability (California) and high prices (both) aren’t an appealing destination for the rest of us.

The politics of this will be fascinating. Climate extremists are likely to be frustrated at the lack of results. The Democrats’ razor-thin margin in the Senate make sweeping policy changes unlikely.

Reducing coal consumption is the low hanging fruit of reducing emissions. It not only generates twice the CO2 emissions of natural gas when burned, but also pollutes locally with fine particulate matter and nasty chemicals such as mercury. Executive actions via the Environmental Protection Agency and aggressive enforcement of existing environmental laws could increase the cost of coal, offering the new administration some chance of improved results.

Trump won three of the five biggest coal producing states (Wyoming, West Virginia and Kentucky) with Pennsylvania and Illinois voting for Biden. Democrats might therefore conclude that they have little to lose by taking on the coal industry, a move that would be easily supported by the science. It’ll be a tricky decision though, because they’d risk losing the other two.

The biggest weakness in policies to combat climate change is their reliance on supply constraints. Billions of people use fossil fuels, and we are all contributing to emissions to varying degrees. But rather than raising prices directly on the consumption of energy, policies more often seek to manage sources of supply. Public support to reduce emissions is shallow – if people believed the planet was truly at risk, nuclear energy would be an obvious solution. We’d have a carbon tax in the U.S., but that’s a political non-starter. So policy focuses on supply, because the impact is less visible.

The logical progression is to engineer higher coal prices. The natural winner would be natural gas, the only energy source with the capacity to quickly compensate for, say, a 5% drop in coal production.

Democrats own the U.S. response to climate change for the next four years. Higher energy prices are part of their strategy. It’s what energy investors would like too.

We are invested in all the components of the American Energy Independence Index via the ETF that seeks to track its performance.

Warnings Of Inflation Grow

In early November when Pfizer’s vaccine announcement triggered a strong rally, technology stocks lagged small cap value. Having been out of favor for years, the Russell 2000 sprang to life, drawing in buyers at the expense of tech.

The relative movement of tech to value, defined as the ratio of the Nasdaq and Russell 2000 indices, crossed through its two hundred day moving average. This signaled an end to tech’s previous ascendancy, at least for those who follow charts.

The pattern has continued since, with the ratio now solidly below its two hundred day. It looks like a new trend has begun. Pipeline stocks are beginning to show up on recommended lists. US News included Kinder Morgan (KMI) among their ‘7 Best Value Stocks to Buy for 2021.’ Barrons regularly pushes midstream energy infrastructure for yield. The components of the American Energy Independence Index, undoubtedly a value play, still yield over 8% on a market cap weighted basis even after rallying 12% in January.

Coincident with this shift in leadership, signs of inflation are appearing. Liquefied Natural Gas (LNG) prices have soared in Asia because of unusually cold weather. JNK LNG, the regional benchmark, recently traded up eightfold from last April with some Asia-bound shipments trading at 10X the price of the US Henry Hub benchmark last week. This is great news US LNG exporters.

The JNK squeeze is dramatic but temporary. However, other commodities have also been rising sharply. Crude oil has firmed up on hopes that vaccinations will allow a return to our former lives by summer. China’s sharp economic rebound has more than doubled the price they pay for iron ore compared with March. Even rice has risen over a third since October.  Prices for hot rolled steel have doubled. Inflation is increasingly a conversation topic among investors, and is drawing more media attention such as Higher inflation is coming and it will hit bondholders in yesterday’s FT.

Gold has been weakening in recent months, but Bitcoin has soared, perhaps becoming the refuge of choice for some fleeing fiat money.

The Federal government is doing its best to cause bond investors sleepless nights. This week incoming President Biden will press Congress to approve an additional $1.9TN in pandemic relief, our third package in a year. The Federal Reserve is actively seeking inflation above its 2% target, to compensate for years of undershooting.

If inflation doesn’t rise, it won’t be because we didn’t try. It’ll reflect the continuation of disinflationary forces that have constrained it for so long.

Money Supply as measured by M2 is growing at the fastest rate since records exist. However, nominal GDP is not similarly rising, since money velocity is plunging to new depths. During the 2008-09 financial crisis, when the Fed’s Quantitative Easing led to M2 growth less than half as strong as it is now, some feared a resurgence of inflation. However, the extra liquidity sat in bank reserves and was only slowly recycled into the economy.

The difference today is that money market funds for institutional and retail accounts are $4.3TN, far higher than a year ago. The US savings rate soared above 30% last April, and although it’s been falling since then it remains historically high.  By contrast with 2008-09, these balances are readily available to fund consumption.

There is substantial dry powder for households to spend, should they so wish.

But there’s also substantial overseas demand for US treasuries, which yield the most of any G7 nation. Japan holds $1.3TN, and China $1.1TN. Theoretically, interest rate parity means that yield differentials among different sovereigns shouldn’t matter once the cost of FX hedging is factored in. But as this article implies, Japanese buyers of ten year treasuries aren’t using ten year forward FX trades to hedge their risk – they’re most likely hedging within one year, where interest rate differentials are narrower and liquidity better, making it cheaper. In effect, they’re taking yield curve risk between short term and long-term rates, but it’s been working for years. With the Fed unlikely to raise rates in the near term, it probably still looks low risk.

The bottom line is that, as long as U.S. inflation remains low, long term rates are likely to remain low too. But as lockdowns finally end, many months of frustrated purchasing power could be unleashed. How that plays out will determine the path for bonds. The market isn’t pricing in repeat of the ‘Roaring 20s’, a century after the first one.

We are invested in all the components of the American Energy Independence Index via the ETF that seeks to track its performance.


Democrats Will Test The Limits On Spending

Modern Monetary Theory (MMT) is taking hold. Relying on the insight that a government can never go bankrupt in its own currency, it posits that deficits don’t matter until they cause inflation (see our review of The Deficit Myth by Stephanie Kelton).

On a week that incoming President Biden unveiled a $1.9TN package to fight Covid and the economic downturn, ten year treasury yields fell. This was helped by Fed Chair Powell, who said, “When the time comes to raise interest rates, we’ll certainly do that, and that time, by the way, is no time soon,”

Meanwhile, JPMorgan, Citi and Wells Fargo released $5BN from their loan loss reserves because of the improving economic outlook.

Empirically, deficits don’t seem to matter. The Congressional Budget Office (CBO) projects that Federal Debt:GDP will reach 107% in two years, eclipsing the past high that followed World War II. After a brief pause, it is projected to move stratospherically towards 200% and beyond. This projection was made last September, so omitted the $1.9TN that Biden proposes to add.

Meanwhile, thirty year bonds, which encompass the period during which Debt:GDP will soar, yield under 2%.

MMT remains a fringe theory among mainstream economists. Paul Krugman, liberal credentials burnished by his regular NYTimes op-ed slot, is a critic. Far across the political divide, Larry Summers describes it as a “recipe for disaster.” It’s not political orthodoxy for either party, although progressive Democrats see in it a way to finance their liberal agenda. But you could also envisage Republicans relying on MMT to justify tax cuts.

While economists like Paul Krugman and Larry Summers are debating the merits of MMT, practically speaking the debate is over. In Kelton’s book, she doesn’t argue that deficits never matter – if government spending exceeds the economy’s non-inflationary productive capacity, inflation will rise. That’s how you find out where the limit is.

As the bond market shows, we’re not there yet.

What isn’t receiving enough attention is that our fiscal policy is steadily adopting the MMT framework. Persistently low interest rates have removed the last remaining bulwark against fiscal profligacy. Spending hawks have gradually retired from Congress or been voted out. Holding such views is a thankless task. You don’t need to be an MMT advocate to ask why we don’t borrow huge sums at such low rates. The deficit was already growing under Trump because of tax cuts, before Covid relief took it higher still.

Last March, Trump tweeted, “With interest rates for the United States being at ZERO, this is the time to do our decades long awaited Infrastructure Bill. It should be VERY BIG & BOLD, Two Trillion Dollars, and be focused solely on jobs and rebuilding the once great infrastructure of our Country! Phase 4”

Biden’s $1.9TN package is to be financed fully with debt as opposed to taxes – for now anyway. And it doesn’t include anything from the Green New Deal (see The Bovine Green Dream). Or for infrastructure.

Big spending is a bi-partisan strategy.

What seems increasingly likely is that we’ll keep pushing our deficit higher until we generate inflation. To fail to do so is to needlessly leave people worse off. The government should spend, and provide jobs for all, because as Kelton writes in her book, “…poverty strips people of the opportunities to flourish and to participate in the American dream.”

Bernie Sanders, who will chair the Senate Budget Committee once the Democrats take control of the Senate next week, has Stephanie Kelton as an adviser. His platform during his run for the presidency last year included $30TN for Medicare for All, $16TN for the Green New Deal and $7.5TN in Federal job guarantees. Any complaints he may have on Biden’s spending plans are likely to criticize their lack of ambition.

Worrying about the deficit has been a fool’s errand for decades. Betting on higher inflation has been a losing trade for the entirety of most investors’ careers. That could remain the case this year too, although there are signs of price pressure. Hot rolled steel has doubled in price since October. Money supply (M2) is growing at 26%, faster than even the inflationary 1970s and 80s.

Protecting against inflation is incredibly cheap. December 2022 eurodollar futures yield 0.29%, only 0.06% more than today’s three month Libor, with almost two years to go. Pipeline stocks, which often have inflation escalators embedded in their tariffs, yield over 8%.

Inflation may stay quiescent, but the cost of protection is very low.

We are invested in all the components of the American Energy Independence Index via the ETF that seeks to track its performance.

We are short December 2022 eurodollar futures.

Renewables: More Capacity, Less Utilization

The U.S. Energy Information Administration (EIA) is generally apolitical – they’re not championing any single energy source. That may change under the new Administration, and they may become a shrill for renewables, but so far, they largely report data.

Yesterday their website carried Renewables account for most new U.S. electricity generating capacity in 2021, highlighting that 70% of the 39.7 Gigawatts (GW) of new capacity to be added is solar and wind.

Recently they also ran with Nuclear and coal will account for majority of U.S. generating capacity retirements in 2021. The continued drop in coal is good news – its elimination is the fastest route to reduced emissions globally. This trend is unfortunately moving in the opposite direction in China and India, but at least in the U.S. we’re getting it right.

The drop in nuclear is not helpful in terms of lowering emissions, since it produces none. A realistic path towards fighting climate change includes using more nuclear, rather than relying fully on solar panels and windmills.

What’s notable is that we’re adding 39.7GW of generating capacity while retiring 9.1GW, for a net gain of 30.6GW. Total U.S. power generating capacity is 1,100 GW, so we’re adding around 3%. But U.S. power consumption for the past decade is flat. Energy intensity, the amount of energy consumed per $ of GDP, has been falling for decades in developed countries, reflecting ongoing energy efficiencies and the steady decline of manufacturing’s share of economic output.

So why is the U.S. increasing its energy capacity?

The 39.7GW being added is certainly expected to be used – otherwise the capital wouldn’t have been invested. Most likely, it reflects the lower utilization of renewables, which typically runs 20-30%. By contrast, baseload natural gas power plants run at 90% of capacity, with nuclear higher still.

The dismal truth that, for all the excitement about solar and wind, it takes more than 1 GW of solar capacity to decommission 1GW of coal power. This lower utilization is beginning to show up in the figures. The U.S. is net adding capacity while consumption is flat. Maybe enormous growth in electric vehicles will shift energy consumption from petroleum to electricity, but it’s likely we will gradually utilize less of our power generating capacity as the mix shifts.

Comparing the cost per GW of different power sources doesn’t account for differences in utilization, which therefore flatters renewables. The need for back-up power to offset their intermittency is also normally overlooked.

Germany has pursued renewables aggressively, adding capacity even while demand has been falling. Because of this, they also have among the highest electricity prices in the world. More of their power generation sits idle than in the past, because the windpower they’ve been adding has lower utilization. Watching the “Energiewend” (Energy Transition) has been instructive for the rest of us (see It’s Not Easy Being Green).

At least they’re not as bad as California, the state with America’s most expensive and least reliable electricity (see California’s Altruistic Carbon Policy).

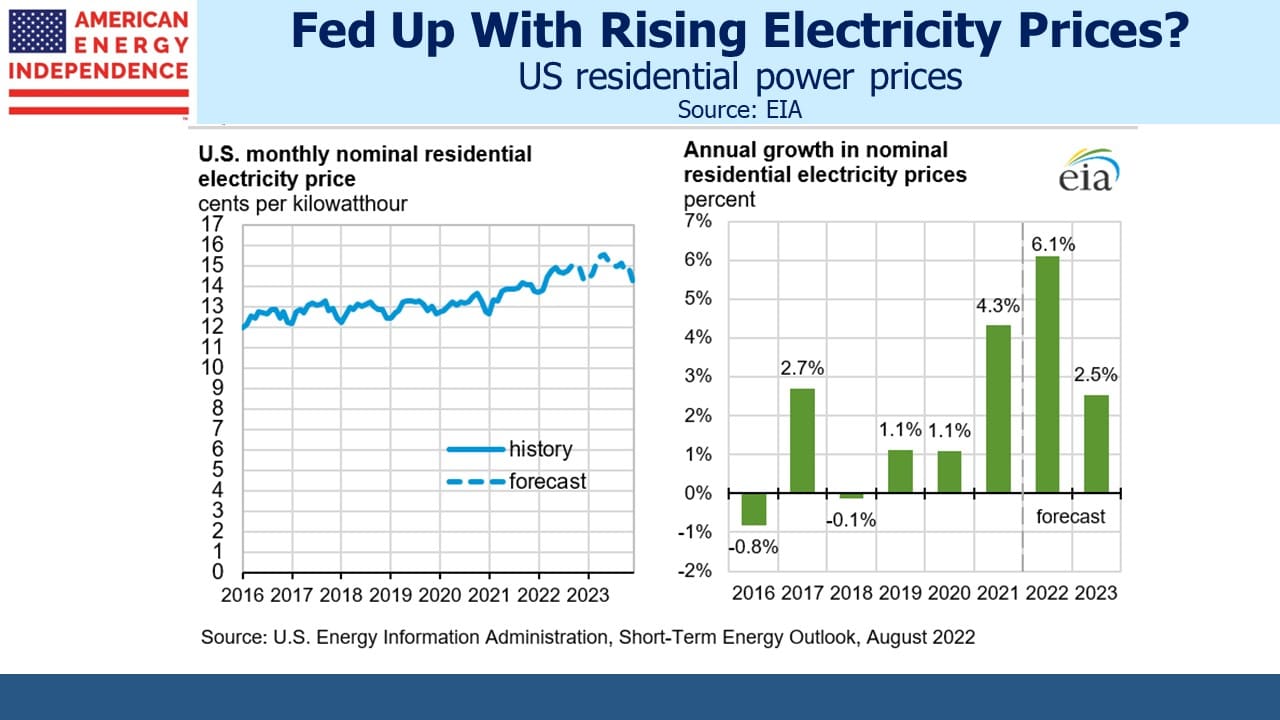
Outside of California, electricity is cheap in the U.S. Some may believe there is plenty of room for prices to rise. If we are serious about climate change, prices should rise. Germany’s example shows where this can go. It’s not yet part of the climate change debate in America. It should be.

We are invested in all the components of the American Energy Independence Index via the ETF that seeks to track its performance.

Asia Snaps Up Natural Gas

The cold winter currently being endured in north-east Asia isn’t just a boon for those hoping the planet isn’t burning up. It is setting a fire under local prices for Liquified Natural Gas (LNG). Because of the relatively high cost of moving LNG by tanker, regional price differences can be far wider than for crude oil, where transportation costs are a much smaller portion of the overall shipment.

February LNG prices for the JKM benchmark used by Japan and South Korea eclipsed $17 per thousand cubic feet (MCF) last week, with reports of at least one individual cargo trading at above $33. Wholesale electricity prices touched 100¥ per KWh. By contrast, U.S. February natural gas is at $2.70 per MCF.

$3-5 per MCF is generally the cost to ship LNG from the U.S. Gulf coast to Asia. With regional prices until recently around $7-9, the differential was already boosting LNG exports from the U.S. and elsewhere.

The low temperature in Beijing on Thursday was -3F, not seen since 1967. China’s electricity demand is likely to set a new high this winter, with manufacturing rebounding strongly from the Covid slump. China stepped up its LNG imports last year, seeking to moderate its reliance on coal, where it consumes half the world’s output.

The EIA estimates that 58% of China’s total energy consumption comes from coal, with natural gas just 8%. Cheniere, the biggest operator of LNG export facilities in the U.S., estimates that China will double its natural gas pipeline network, to 163,000km, by 2025. South Korea, Taiwan, India, Vietnam and Thailand (i.e. most of developing Asia) similarly intend to increase natural gas consumption. During the first three quarters of last year, China’s LNG imports increase by 4.4 Million Tonnes, equivalent to more than half the increase in U.S. LNG exports over the same period.

It’s why Cheniere’s stock is up over the past year, handily beating the energy sector.

China’s motivation to switch from coal to natural gas for power generation is to reduce local pollution, a much bigger domestic concern than global warming. While the region around Beijing has largely eliminated coal power, China is building almost as many new coal plants as the U.S. currently has operating (see Fighting Climate Change Is Hard).

Japan relies almost completely on imported LNG for its natural gas. Around 30% of this comes from the U.S. Japanese power generation relies on coal and natural gas for almost two thirds of its output.

The Fukushima nuclear disaster led to sharp reductions in nuclear power, which increased the need for fossil fuels. Although this has been partially reversed over the past couple of years, natural gas remains vital and its superior carbon footprint is likely to give it an edge over coal for some time.

If our incoming Climate Czar John Kerry wishes to offer Japan and China some advice on the subject, he might suggest emulating the U.S. in using more natural gas to reduce emissions. It would be a pragmatic way to pursue the fight against climate change while also benefiting the U.S. economy.

High LNG prices in Asia are good for our domestic natural gas business through increased exports. After dipping in the summer, volumes increased to 9 BCF/D (Billion Cubic Feet per Day) in November, beating the prior monthly record of 8.1 BCF/D set last January. Last month, feedstock to LNG export facilities was 11.2 BCF/D. As additional liquefaction capacity becomes operational, LNG exports will rise further.

U.S. natural gas is among the cheapest in the world, and our exports are the fastest growing. The opportunity for America to provide cheap, clean-burning natural gas to developing Asia is enormous. Increased energy consumption to drive rising living standards is assured in non-OECD countries. Let’s see if John Kerry is sensibly pragmatic or perversely progressive.

We are invested in all the components of the American Energy Independence Index via the ETF that seeks to track its performance.

The Changing Pipeline Investor

The S&P500 (SPTR) had a strong decade, returning 13.6% p.a. from 2011-20. By contrast, MLPs had a lousy ten years, delivering –1.2% p.a. The reasons have been well documented on this blog and scarcely need repeating. The Shale Revolution induced overinvestment which led to excessive leverage. Distribution cuts followed, driving away many traditional MLP investors.

But midstream energy infrastructure didn’t do nearly as poorly as MLPs. The broad-based American Energy Independence Index (AEITR) returned 7.5% p.a. MLPs have dragged down the overall sector for several years. The Alerian MLP Index (AMZX) does a poor job of representing the pipeline sector nowadays, with most of the industry having dropped the MLP structure in search of a wider set of investors.

Pipelines lagged the S&P500 to be sure, but much of the miss occurred last year.  In the nine years prior to last year (I.e. 2011-19) annual returns are 13.1% and 10.1% respectively. Covid hit the energy sector hard, but strongly growing free cash flow and rising commodity prices offer reasons for optimism this year.

There’s also evidence that income-seeking buyers, long a core investor base for MLPs, are less relevant. For a couple of decades there existed a clear intra-year seasonal pattern around MLP returns. Because of the high yields, sellers would often wait until just after a quarterly distribution to sell. Buyers would similarly invest just prior to a distribution. This created a quarterly pattern in which the first month of the quarter, typically the record date for quarterly distributions, saw higher than average returns.

Holding a stock so as to receive the dividend is a pointless strategy, unless there are tax considerations. Stock prices, including MLPs, adjust for the payout once they go ex-dividend. It’s an example of some retail investors misunderstanding this. Clearly, over 1995-2015, sales timed just before a distribution would have generated better returns, as would purchases just after.

The K-1s also give a January boost – if you’re planning to buy an MLP in December, waiting a month avoids a K-1 for the year, just as selling in December avoids one for the following year.

But in the last five years, higher volatility and distribution cuts have reduced the importance of quarterly distributions as a factor in timing buys or sales. Because 2020 was so volatile, it distorts average returns by month over the past five years; however, the median shows a similar result. The overall sector, as represented by the AEITR, shows a more muted pattern than MLPs, probably because of its broader, institutional investor base.

The result is that only January and April now show reliable above-average returns. Returns are positive 70-80% of the time, depending on the index. July and October no longer stand out. Trading around quarterly distributions has lost importance – that the effect remains visible in January/April could be random, or at least not related to payouts. The S&P500 has a modest January effect too, likely reflecting year-end portfolio decisions by investors.

What the data shows is that pipelines haven’t been nearly as bad an investment as MLPs alone indicate. Corporations, especially the Canadians which are prudently managed, have made the difference. And individual investors focused on distributions are a diminishing part of the overall investor base.

We are invested in all the components of the American Energy Independence Index via the ETF that seeks to track its performance.

The Blogs You Liked, Part 2

Although we generally write about investing in midstream energy infrastructure, we find macro subjects interest our readers too. In April, not long after the market low, The Stock Market’s Heartless Optimism was popular, as any guide to the market’s direction was eagerly sought. We regularly use the Equity Risk Premium (ERP) to illustrate the relative value of stocks versus bonds. Earnings forecasts never fell as far as the market, which is what propelled its rebound for the remainder of the year.

Full year S&P500 EPS is currently forecast by Factset to come in at around $140 once 4Q20 reports are out. For 2021, analysts are forecasting S&P500 EPS of $170. The 21% increase looks impressive, but a year ago the 2021 EPS forecast was $197. Despite this 14% drop in forecast earnings, the market returned 18%. It’s been cheaper. Lower bond yields helped, but relative value has clearly deteriorated. At 3.6, the 2021 ERP shows stocks are attractive compared with the past 50 years, but mid-range for the past decade.

A 1% jump in bond yields would likely expose the market’s lofty valuation. This has been true for years without result. Investors need to consider the possibility of such, improbable though it seems. Recent M2 money supply growth of 26% has eclipsed the inflationary ‘70s and ‘80s. Taming the deficit is a quaint hobby with few votes, and the Fed wants to see inflation above its 2% target for a period of time before acting. This doesn’t mean inflation is about to jump, but the mismatch between investor positioning and the odds of such a surprise appears significant.

We wrote on this topic recently (see A Cheap Bet On Inflation), drawing a good number of emailed comments. One friend and client generously described it as “post of the year”.

Inevitably, we wrote on Covid, as reasonably numerate non-medical people trying to figure it out. Opinions are strong on both sides, and the most reasoned responses came from those who believed we were underestimating the threat. Our morning meetings often include a discussion, and there isn’t complete agreement even within SL Advisors on certain elements. What is unarguable is that life won’t return to normal until people feel safe, regardless of whether they’re over-estimating their risk or not.

For my part, in New Jersey in March and April of last year we endured a loss of personal liberty I never thought possible in America. Even a solitary walk in the woods was banned. As soon as we could, my wife and I escaped for a trip south, where infections were lower and society more open. This was briefly chronicled in Having a Better Pandemic in Charleston, SC, which many enjoyed.

Climate change will continue to be a dominant driver of energy sector returns. Anything linked to the energy transition draws fund flows (see Hydrogen Lifts an LNG Company).

Valuations defy fossil fuels’ 80% share of global energy, and the relentless growth in developing countries’ consumption to support rising living standards. We have long thought natural gas a better bet than crude oil. 2020 highlighted the former’s resilience as the collapse in transportation demand was mostly felt in oil markets (see With Energy Uncertainty, Natural Gas Offers Stability and Natural Gas Demand Still Stable).

The election result means energy companies will continue cutting growth spending, a welcome development. Next week’s Georgia runoffs for the Senate will determine whether Goldilocks Gridlock or a razor-thin Democrat majority prevail. The former is better, but pipeline free cash flow is growing in either scenario. Why Exxon Mobil Investors Might Like Biden explained how we thought politics would affect the sector.

Our podcasts have developed a growing listener base too. Among the most popular were Joe Biden and Energy, Climate Change Was Never Our Biggest Threat, Exxon’s Bet Against Renewables and Democrats Mean Higher Energy Prices.

As always, we invite your feedback whether positive or negative. We aim to produce what you want to read or listen to.

We are invested in all the components of the American Energy Independence Index via the ETF that seeks to track its performance.

The Blogs You Liked, Part 1

Writers care what their audience thinks, and we monitor pageviews and comments to learn what resonates. For pipeline investors, a few months into the year it was looking like the mother of all bear markets. The sector had been persistently lagging the S&P500 since peaking in 2014, and pre-Covid the fundamentals were improving strongly. Fortunately, the recovery since then has repaired much of the damage to portfolio values, if not the emotional scars from extreme volatility. The American Energy Independence Index is –13% for the year, compared with –51% at the end of 1Q.  

In reviewing the year’s most popular blogs, they can be divided into (a) commentary on the energy market, and (b) politics, especially around climate change. Part one of this two-part, year-end review will focus on the market blogs. 

Most of all, investors want to understand why stocks are moving as they are. Pipeline stocks bottomed in March, and crude oil in April when it briefly traded at negative prices. Can An ETF Go Negative? looked at the United States Oil Fund, LP (USO)an ETF that provides exposure to crude oilIt’s a result of our Balkanized regulatory structure which separates stocks from futures. That the SEC and CFTC persist as separate entities is because their overseers are separate Senate Committees (Banking and Agriculture, respectively). Merging them would eliminate campaign contributions to one Senate committee’s members, a battle successive Administrations have avoided.  

Different oversight means different rules, so firms tend to offer either stocks or futures, but not both. Buying crude oil futures would be a more efficient way for oil bulls to express a view but preferring to keep assets at one firm they buy USO instead. USO then buys oil futures, increasing the friction for the ultimate investor. 

A regular theme is the diminishing importance of the MLP structure. The shrinking pool of MLP buyers, caused by serial distribution cuts, has reduced MLPs to only a third of North America’s midstream energy infrastructure sector (see The Disappearing MLP Buyer). It’s also created problem for MLP-dedicated funds, which are becoming increasingly concentrated in the few remaining names (see Today’s Pipelines Leave MLPs Behind and Are You In The Wrong MLP Fund?). 

MLP closed end funds offer a target-rich environment for criticism (see MLP Closed End Funds – Masters Of Value Destruction). As Warren Buffett said, if you’re not going to kick a man when he’s down, when are you going to? They are a dumb idea, and if they didn’t already exist no responsible fund manager would fill the void. Most recently, the Fiduciary/Claymore Energy Infrastructure Fund (sporting the delightfully inappropriate FMO ticker — Fear of Missing Out) announced an “income tax accrual adjustment” following “a further review and change in understanding” of the tax rules under which they operate. Markets and the tax code are too much for this hapless fund, -86% YTD 

In a year of superlatives, pipelines have surprised by maintaining strong growth in Free Cash Flow (FCF) despite the pandemic. During the collapse in transportation demand that culminated with April’s briefly negative crude prices, any FCF growth appeared implausible. Nonetheless, even by May the outlook was improving (see Pipeline Cash Flows Will Still Double This Year), and one of our most read pieces was from two days before the low (see The Upside Case For Pipelines). We were bullish then, but as regular readers know we usually are, so won’t claim any credit for foresight.  

The outlook remains very positive, with FCF expected to increase by a further 50% next year supported by lower spending on new projects. Incoming President Biden is likely to be an impediment to growth capex, a welcome development.  

  We are invested in all the components of the American Energy Independence Index via the ETF that seeks to track its performance.

A Cheap Bet On Inflation

“If I seem unduly clear to you, you must have misunderstood what I said” was Fed chair Alan Greenspan’s response during testimony to the Senate in 1987. Transparent communication has come a long way since then. Greenspan continued the policy of obfuscating responses, reflecting a belief that it improved the Fed’s operating flexibility by disguising mistakes. This inspired Secrets of the Temple: How the Federal Reserve Runs the Country, William Greider’s 1989 scripture describing faith-based monetary policy.

Today, the Fed’s projections are public. Their meeting minutes are published. The mystery has gone, although they still are the most important market participant. Transparency allows for comparison between market forecasts of interest rates and the Fed’s. Of course, the latter has the advantage of being able to make their forecasts correct through their actions, should they be so moved. Fortunately, the Federal Open Market Committee (FOMC) is not burdened with excess vanity, so serially inaccurate interest rate projections do not bother them.

In recent years it’s been mildly amusing, in a nerdy sort of way, to show how the FOMC’s long term forecasts for inflation and the Fed Funds rate have followed bond yields lower, conceding the market’s prescience. Fixed income investors have been ahead of this for years, exhibiting greater accuracy about Fed policy than the FOMC itself (see Bond Market Looks Past Fed). Covid made such games irrelevant, but as markets look beyond the pandemic, revisiting FOMC Projection Materials is becoming worthwhile again.

In August, Fed chair Powell gave a speech where he addressed persistently low inflation and how this had caused FOMC members to continually lower their rate forecasts. He explained how 2% inflation remained their definition of price stability, but since recessions typically cause it to undershoot, the FOMC would henceforth be more tolerant of greater than 2% during a strong economy. The inference, reflected in subsequent FOMC projection materials, is that short term rates will remain low for a long time, at least long enough for inflation to exceed 2%.

The chart compares the futures market with the FOMC’s forecasts. There is some judgment involved – the FOMC provides annual estimates through 2023 followed by a long-term assumption. The chart assumes that the long run is five years away. The market, as has been the case for years, is assuming lower rates than the FOMC.

Rates probably will stay low. Betting on higher inflation has been a fool’s game for longer than the average investor’s career. But these are unusual times. M2 money supply growth is 24%, higher even than when we were trying to whip inflation in the 70s and 80s. The fiscal outlook is as bad as ever, with debt projected to exceed the wartime highs of 1945, and stay there.

Modern Monetary Theory (MMT) as explained by Stephanie Kelton in The Deficit Myth: Modern Monetary Theory and the Birth of the People’s Economy, holds that deficits don’t matter until they cause inflation. MMT has been widely panned by mainstream economists and isn’t regarded as a serious framework for fiscal policy. But the reality is that deficit hawks win few votes nowadays. We are, in truth, already pursuing the unlimited government spending that MMT advocates. Higher inflation is the only remaining obstacle, as we noted on Sunday in Deficit Spending May Yet Cause Inflation.

Low inflation remains likely, so betting against this is unbelievably cheap. The eurodollar futures curve offers precise forecasts of short-term interest rates, which in 2022 are expected to rise only 0.06%; that is, the spread between the December ‘21 and December ‘22 futures contracts is 0.06%.

Suppose that the economy emerges from Covid by the spring, as the vaccines allow a return to our previous lives. Consider whether a desire to live for the present promotes a vigorous economic rebound, as people catch up on experiences, trips and visits long delayed. The Roaring 20s followed the 1918 Great Influenza, although the still fresh horrors of World War I also played a significant role in the zeitgeist.

If inflation does pop above 2% next year, markets will start looking more carefully at near-zero Fed Funds and its longevity. No rate hike until 2023 will look to some like an awfully long time. The 0.06% spread between the December ‘21 and December ‘22 futures contracts could easily move to 0.25%, still representing only a single rate hike over that year.

The question is whether the odds offered by the market are sufficiently different from the odds of such happening, the minimum criteria to justify a trade. The money market curve is unlikely to invert, so the loss if nothing happens is a few basis points. The risk/return on this trade is a long way from 50/50, but the odds of an inflation jump are low too. Call it the MMT trade.

Some investors are already contemplating higher inflation. Bitcoin buyers are among them. There are cheaper ways, with well-defined downside, to express such a view. The eurodollar futures curve is one of the best. Your blogger has already initiated this trade.

We are invested in all the components of the American Energy Independence Index via the ETF that seeks to track its performance.

image_pdfimage_print