Can Pay Raises Keep Up With Inflation?

SL Advisors Talks Markets
Can Pay Raises Keep Up With Inflation?
Loading
/

For the first time in history, nurses who work for Britain’s National Health Service went on strike last week. They’re demanding a 19% pay increase, to make up for current inflation as well as the “20 per cent that has been eroded” from pay over the past decade, according to union leader Pat Cullen.

Nurses in the UK occupy a special place in the public consciousness, evoking memories of Florence Nightingale who led a team of 38 to treat wounded soldiers during the Crimean War in 1854. Underpaid yet much loved is how many Britons feel towards them. In Germany, average pay for nurses is €33K ($35K). The US median is $78K.  The average British nurse makes £26K ($32K). Some report relying on patients’ food at the end of the month while awaiting their paycheck.

Europeans are supportive of unions and tolerate strikes more than the US. Traveling by train from London to Paris last Friday, our daughter was advised to allow extra time to pass through Immigration, thanks to Brexit. The transit system faced another strike the following day, and her (perhaps over-protective) father reminded her not to get sick while the nurses were on strike.

The problem is that workers in many fields are getting pay raises less than inflation, imposing a drop in living standards. Congress shouldn’t have passed last year’s $1.9TN American Rescue Plan (ARP), and the Federal Reserve was at least a year late in shifting from its accommodative policy. These were two large mistakes. As a result, the Fed wants to drive unemployment higher, thereby pressuring real incomes. This is the consequence of the twin fiscal and monetary failures.

Pay that lags inflation requires workers to conclude no better alternative is available. There are signs of economic weakness. House prices are softening.  November’s auto sales figure of 14.6 million (seasonally adjusted, annualized) is recession-like, with 15-17 million more typical when the economy is growing. Recession forecasts are common, but the jobs market remains strong.

In April 2021, CPI registered 4.2% year-on-year, just when Congress passed the ARP and checks started going out to tens of millions of Americans. We’re close to two years of above target inflation. It’ll increasingly figure in wage negotiations until there’s more slack in the labor market.

The Employment Cost Index (ECI) is rising at 5%, but adjusted for inflation is –2.9%. Year-end pay reviews are the norm across corporate America. For the vast majority of people who have held their current job for at least the last year, first quarter pay raises are common.

The ECI is seasonally adjusted, but the adjustment factors may be inadequate this time because annual raises will likely be bigger than usual. There are signs this is already happening. For several years the March ECI report has been above the trailing 4Q average. This bias has become more noticeable in the last two years. The seasonals haven’t caught up with higher annual pay raises to reflect increased inflation.

This suggests that wage inflation reported in the March ECI will be above trend and higher than the Fed would like. It’ll be published in April so is some way off – we’ll revisit this topic closer to the date. Some annual pay raises occur during the 4Q so will be picked up in January’s release, but so far there hasn’t been any visible anomaly in past releases of the December ECI.

Last week the FOMC updated their Summary of Economic Projections (SEP). A more hawkish path for the Federal funds rate depressed stocks. The biggest discrepancy is with Dec ‘24 futures which yield 3%, 1% less than the SEP. The market thinks a recession is more likely than the Fed does, and therefore expects the Fed to cut rates next summer.

Inflation expectations remain well contained, which provides an exit ramp from tight policy anytime the FOMC wants to use it. But Fed chair Jay Powell doesn’t sound as if 4.6% unemployment (the SEP forecast for the end of next year) will be problematic. Economists debate what unemployment rate represents full employment. Its snappy title is the Non-Accelerating Inflation Rate of Unemployment (NAIRU). You only know where NAIRU is when falling unemployment causes inflation. Today’s 3.7% rate is well below it.

The St Louis Fed has a chart showing NAIRU at 4.4%. Some economists think it’s higher because of Covid-induced goods-inflation and reduced labor force participation. The Fed is unlikely to reduce rates until they’re sure the unemployment rate is above NAIRU, because they’ll be motivated to avoid yet another policy error. Once they start cutting rates, if inflation doesn’t keep falling, they’ll face no shortage of critics.

Jay Powell insists they’ll stay the course and maintain restrictive policy until inflation is clearly returning to 2%. When the blue dots on the SEP differ from the futures market, it’s usually resolved at the cost of the FOMC’s forecasting reputation. This time may be different.

We have three funds that seek to profit from this environment:

Energy Mutual Fund Energy ETF Real Assets Fund


Energy – The Only Bright Spot In 2022

SL Advisors Talks Markets
Energy – The Only Bright Spot In 2022
Loading
/

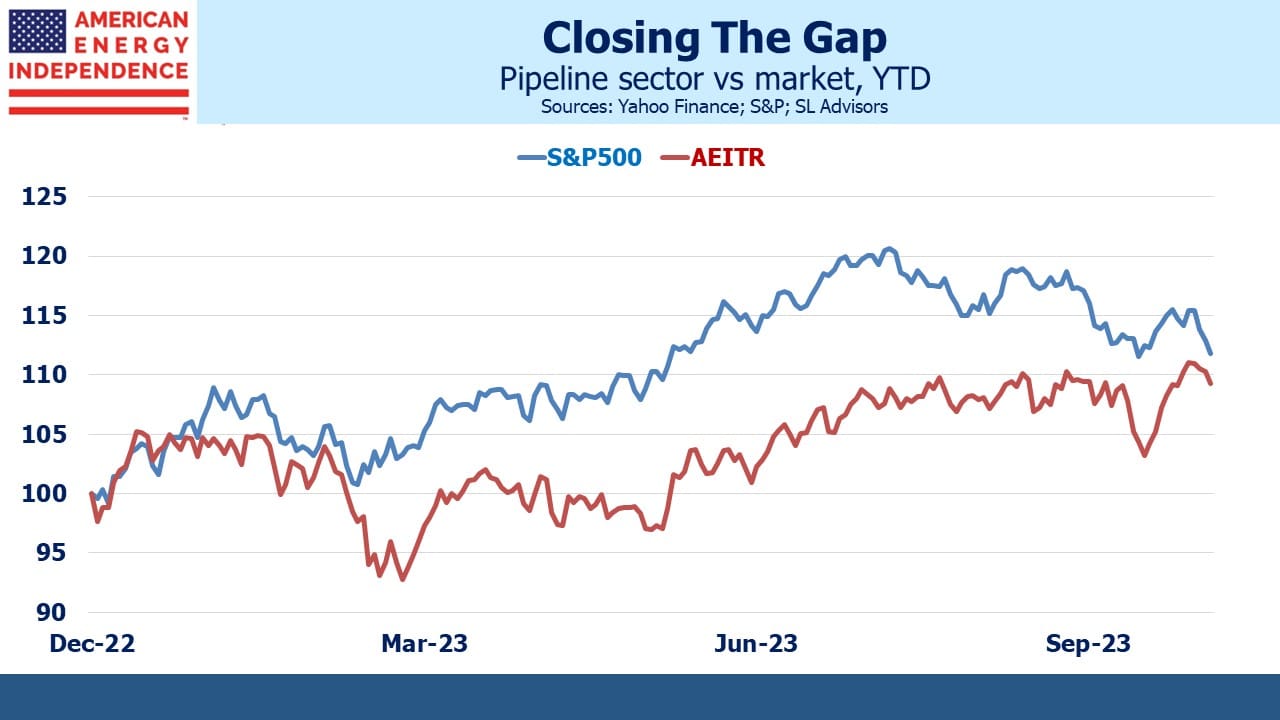
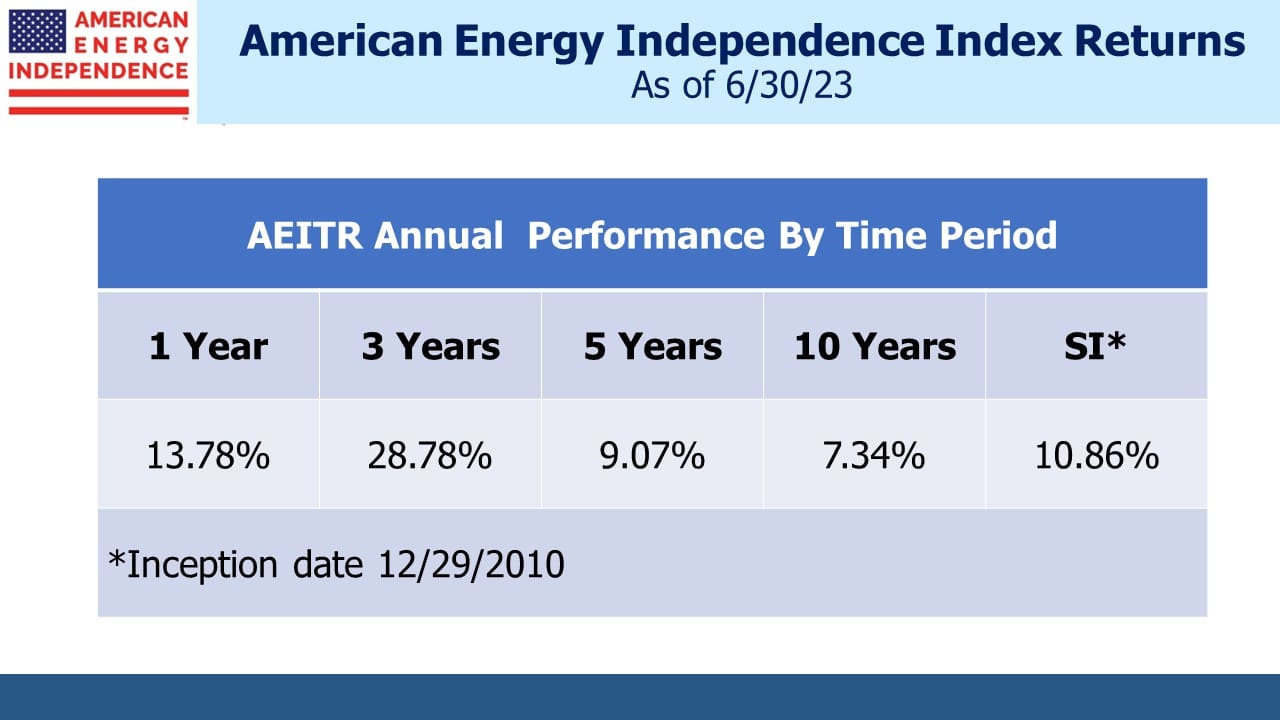
The energy sector is closing out a strong year weakly. This shouldn’t detract from the fundamentals, which remain strong. The American Energy Independence Index (AEITR) is 36% ahead of the S&P500 YTD after finishing 10% ahead last year. That almost two-year period of outperformance is the best since the index’s inception date in 2010. Battle-hardened pipeline investors might fear a correction next year. It’s worth remembering what’s going right.

MLPs have outperformed the broader pipeline sector by 7% this year, recapturing a small portion of the past five years’ underperformance. Unfortunately, investors in the Alerian MLP ETF (AMLP) will miss out on over half of that because of a tax error (see AMLP Trips Up On Tax Complexity). Some MLPs are attractively priced, including Energy Transfer and Enterprise Products Partners, which both yield close to 8%.

However, there aren’t enough MLPs to make up a diversified portfolio — one way to own the few that are worth the time is through a RIC-compliant fund that limits MLPs to less than 25% of assets. That avoids the tax drag faced by AMLP and other MLP-dedicated funds while still benefiting from the yield and shielding the investor from any K1s.

US E&P companies are generating record amounts of cash. Examine the chart above carefully, because it shows each of this year’s quarterly pre-tax earnings and cash flow figures beating each of the full year results going back to 2014. E&P companies are having a great year every quarter! These are the pipeline sector’s customers. Profitability in the upstream segment is supportive for midstream, as this year’s results have shown.

The chart showing gas-weighted E&Ps profitability converts into barrels of oil equivalent and shows that margin expansion is a big driver of profitability.

Factset projects S&P energy sector earnings growth of 150% this year, but that’s a broader universe than E&Ps and is dominated by majors such as Exxon Mobil and Chevron. Capital discipline continues for the most part – analysts expect TC Energy to sell some assets to fund its growing capex budget – but investor returns continue to dominate decision making.

Even though the White House’s chief energy adviser Amos Hochstein has accused investors of being “un-American” in not sharing the Administration ephemeral desire for increased output, investment returns are likely to reinforce capital parsimony.

Domestic production of natural gas continues to set new records, and because it’s not a transportation fuel the pandemic had much less impact than it did for crude oil. The Energy Information Administration (EIA) is expecting record output next year.

By contrast, jet fuel demand has still not fully recovered. Airfares in the CPI are up 43% over the past year, although they’re down 16% since the high in May.

Countries with weather-dependent electricity such as the United Kingdom are enduring unusually cold and calm weather, which is reducing windmill output. London saw snow, which only happens about once a decade. UK wholesale power prices have spiked, but that will mostly be absorbed by the government since for now there are caps on consumer heating bills.

The EIA produced an interesting pair of maps showing each state’s largest source of in-state power generation. The shift from coal to gas is easily seen, but there are three states (South Dakota, Iowa and Kansas) for whom wind power is number one. Personally, I don’t want to live in a state that relies on intermittent energy that takes up vast amounts of space, but some people are fine with it.

Asian demand for crude oil continues to grow. Morgan Stanley reported year-on-year increases of 10.2% in India and 12% in China – this being especially surprising given the widespread lockdowns that have been in place in China. There remains a strong underlying growth trend. Meanwhile Russian exports to Europe are down 80% on a year ago. It’s clear where those shipments unwanted by European buyers will be going.

There was an interesting report that linked the Keystone pipeline’s third spill in five years with increased operating pressure. US crude oil pipelines are limited to operating at a “yield strength” of 72% of maximum. In 2017 Transcanada, who owns and operates the Keystone, obtained approval to go to 80%. They will dispute circumstantial evidence that points to this increased pressure as the cause. Regulators are reviewing the data. Following the leak into the Kansas Mill Creek, the segment from Steele City, KS to the Cushing, OK storage terminal is closed.

Recent sector weakness belies strong underlying volume growth and increasing cash flow. Pipeline investors will have plenty to celebrate this Christmas.

We have three funds that seek to profit from this environment:

Energy Mutual Fund Energy ETF Real Assets Fund


Is BREIT Marked To Market?

SL Advisors Talks Markets
Is BREIT Marked To Market?
Loading
/

How do you conservatively value illiquid assets in a fund that offers liquidity to existing investors and accepts money from new ones? That’s the unsolvable question inadequately answered by the $125BN Blackstone Real Estate Investment Trust (BREIT), which is why they were forced to suspend withdrawals.

Private equity funds typically raise money and invest it over time. Generally, a fund’s investors commit at around the same time and share the portfolio results pro-rata. If a seasoned fund allowed latecomers who were enticed by early investment results, it would be unfair to those who committed at the outset without that information. In such a case, conservative low valuations on existing investments would harm the early investors whose stake in those positions would be diluted on unfavorable terms. High valuations might dissuade later investors if they felt they were paying too much for the existing positions.

It’s why successful private equity managers run one fund after another. It allows them to keep raising capital while ensuring each class of investors is pari passu. With realizations driving liquidity for investors and the manager’s incentive fee, interim valuations don’t matter that much.

When it comes to illiquid assets such as real estate, a valuation range is more realistic than a single point. By allowing inflows and outflows, BREIT has sought to provide liquidity at odds with their underlying assets.  Smooth monthly returns, the promise of “consistent, tax-advantaged distributions” and the Blackstone brand made BREIT attractive to institutions. Their published monthly returns go to two decimal places, suggesting a precision at odds with what they own. They’ve reported three down months out of 69. Such unerring profitability should draw skepticism.

The fall in price of other publicly traded REITs has challenged the credibility of Blackstone’s valuation of the BREIT portfolio. The Vanguard Real Estate Index Fund (VNQ) was down 26% for the year through October. BREIT reports it is up 8.5% over the same period (they report with a lag). Some investors doubt that such a large fund could so nimbly avoid the markdowns that public market investors have endured. The biggest REITs in VNQ have seen their Price/Book ratio drop by over a quarter this year, suggesting book value for other funds will eventually be marked down.

BREIT addresses this, noting that they’ve sold $5BN of real estate this year “at a meaningful premium to carrying values.” They argue that because public real estate is only 8% of the market, private market values are more representative. Therefore, Blackstone regards today’s publicly traded real estate as being discounted to private market values rather than their own portfolio of private investments being overvalued.

Nonetheless, the BREIT investors who have exited recently and others blocked from doing so deem it attractive to redeem at an unchanged Price/Book.

Non-traded REITs, which are registered so as to have the widest possible set of buyers but unlisted to discourage analyst coverage, attract the ethically challenged as fund managers. Almost a decade ago we published Inland American Realty Runs Its Own Hotel California, concluding that disclosing how many ways you intend to fleece your investors can provide some defense when the SEC takes a close look. Non-traded REITs don’t perform regular appraisals, which has led their promoters to disingenuously extoll the consequent “absence of public market volatility.” For more, see Unlisted, Registered REITs; an Investment Designed for Brokers, and also chapter one of my 2015 book Wall Street Potholes.

BREIT shares some of the ignominious qualities of the maligned and shrunken non-traded REIT sector, although they prudently omit claims of low volatility or a high Sharpe Ratio that smooth monthly performance suggests.

Years ago as a hedge fund investor I ran into this problem with a convertible bond arbitrage fund (for the full story see The Hedge Fund Mirage Pp 107-111). If a fund’s bonds are priced by market makers at 101-102, they can be valued anywhere within that one-point range without the manager being open to accusations of misvaluation. If inflows are expected it can make sense to value at 102, pushing up the NAV at which new money comes in and helping performance.

Similarly, outflows might induce valuation at 101, benefiting remaining investors over those exiting. Since the manager must buy or sell bonds in response to flows, incurring transactions costs for the fund, this will always create winners and losers. Investors generally assume greater liquidity than really exists, and don’t consider transactions costs. Fund managers rarely educate them.

The less liquid the assets, the bigger the range of valuations. Real estate doesn’t belong in a fund that allows regular investor flows. BREIT’s NAV sweeps majestically higher, impervious to the carnage afflicting all markets other than energy. But investors in Blackstone’s stock (BX) see a closer relationship with public real estate values as measured by VNQ rather than the private valuations represented by BREIT. Blackstone created the appearance of public market liquidity for privately held assets and asserts valuations remain strong. Their bluff is being called.

We have three funds that seek to profit from this environment:

Energy Mutual Fund Energy ETF Real Assets Fund


Putting Carbon Back In The Ground

SL Advisors Talks Markets
Putting Carbon Back In The Ground
Loading
/

Dinner in late 2017 with Enlink’s soon to be CEO Mike Garberding and his management team was the most expensive I’ve ever had. Not because I had to pick up the check – they were gracious hosts. But because I left the restaurant impressed with Garberding’s grasp of the company’s opportunities and knowledge of the business. The result was we stayed invested in Enlink during Garberding’s time as CEO from January 2018 to August 2019, when it lost half its value.

Sometimes a careful, dispassionate analysis of a company’s SEC filings can tell you everything you need to know. Calls with management can improve your understanding but can also color your judgment. Eventually former CEO Barry Davis was pulled out of retirement to right the ship.

That was five years ago, and today Enlink is a different story. CEO Barry Davis retired (again) in the summer and was replaced by Jesse Arenivas who joined from Kinder Morgan where he ran their CO2 division. Enhanced Oil Recovery (EOR) used to be the energy sector’s main use for CO2, pumping it into mature oil wells to force out more crude oil. If the CO2 is permanently sequestered underground, it even earns a tax credit under Section 45Q of the tax code..

The recently passed Inflation Reduction Act (IRA)  raised this credit to $60 per Metric Tonne (MT). Tax credits for producing crude oil may strike some as not consistent with reducing emissions, but the 45Q credits are turning out to be an important tool. The IRA raised the credit for CO2 captured from industrial processes to $85. Capturing CO2 from the ambient air (Direct Air Capture), where it’s 0.04% can earn up to $180 per MT.

Under its new CEO Enlink is positioning itself as a key player in carbon capture. Their 4,000 mile natural gas pipeline network in southern Louisiana supplies the majority of industrial emitters in the region. In October they announced an emissions reduction agreement with CF Industries and Exxon Mobil to capture 2 million MTs pa of CO2. CF Industries is a major producer of ammonia, the key input for which is natural gas. CO2 is a byproduct of this process. Enlink estimates the potential could be as much as 80 million MTs pa, over 1% of total US greenhouse gas emissions. CEO Arenivas said Enlink is aiming to be, “…the transporter of choice for carbon in Louisiana.”

Commodities typically flow from upstream companies (such as Exxon Mobil) via midstream (ie Enlink) to downstream customers like CF Industries. There’s an interesting symmetry in the agreement in that CF Industries will send the CO2 it generates through Enlink’s pipeline network back to the upstream companies who are best placed to understand which geological formations are suited for storage. The carbon is being returned to its point of origin. It left as CH4 (methane, or natural gas) and is returning as CO2.

Since the agreement was announced on October 12th, Enlink has outperformed the American Energy Independence Index (AEITR) where it was a 2.37% weight at the last rebalancing on September 30. Midstream energy infrastructure companies are developing an important role in reducing CO2 emissions. For years climate extremists have opposed new pipeline construction thereby driving up free cash flow. Remember to hug a climate protester and offer them a ride. They’re vital to putting the CO2 underground.

Last week Enbridge and Occidental announced plans to develop a CO2 pipeline and sequestration hub near Corpus Christi in Texas. Occidental will handle the CO2 storage and Enbridge the transportation, in another example of reversing the traditional direction in which the commodity flows. When it comes to carbon capture, upstream is the new downstream.

Carbon capture is a twofold benefit for pipeline companies. Reducing the CO2 released into the air by petrochemical facilities demonstrates that natural gas consumption is not living on borrowed time, and the subsequent carbon capture offers a new revenue source.

Meanwhile Europe is ramping up its capacity to import LNG. By 2024 they should be able to regassify 6.8 Billion Cubic Feet per Day, up by a third since 2021. Most of this additional capacity relies on floating storage and regassification units which can be operational more quickly than permanent, land-based facilities although they’re typically smaller as well. Poland is expanding capacity at an existing import terminal in the northwest. Within a couple of years there will be substantially more LNG tanker traffic through the North Sea and into the Baltic.

Until now Germany has never imported LNG, relying instead on natural gas from Russia via pipeline. Their energy policy is confused – long term goals to substantially reduce fossil fuel consumption remain in place, although they did recently sign a 15 year LNG deal with Qatar. They’re also contracting with trading house Trafigura to supply gas.

Enlink’s role in carbon capture is likely to be copied by other pipeline companies with similar infrastructure. This time we have no dinner plans with the management team.

We have three funds that seek to profit from this environment:

Energy Mutual Fund Energy ETF Real Assets Fund


AMLP Trips Up On Tax Complexity

SL Advisors Talks Markets
AMLP Trips Up On Tax Complexity
Loading
/

We all know the US tax code is complicated. ALPS Advisors, manager of the Alerian MLP ETF (AMLP), has been tripped up by the tax complexities inherent in their fund structure. As a result they’ve been forced to make an embarrassing NAV adjustment to AMLP for taxes, depressing the fund’s NAV by almost 4%. It must be frustrating for recent buyers, since it shifted the fund to a 2.7% monthly loss, 3.9% behind its index.

AMLP is that rare ‘40 Act fund that pays corporate tax. Under the 1940 Investment Company Act, mutual funds and ETFs, which are corporations, can qualify to be RICs (Regulated Investment Companies) and therefore be exempt from corporate tax if they meet certain rules. These include being fully invested in securities, meeting certain diversification thresholds and so on. Almost all such funds qualify. Investing more than 25% of your assets in Master Limited Partnerships (MLPs) fails the test to be a RIC.

AMLP holds MLPs because in 2010 when it was launched, midstream energy infrastructure businesses were mostly MLPs, not corporations. AMLP provides a way for retail investors who don’t want K1s to invest in MLPs – but at the cost of lower returns because AMLP first pays corporate taxes on its realized returns before making distributions to its investors. We’ve written about this in the past (see  AMLP’s Tax Bondage and Uncle Sam Helps You Short AMLP).

An MLP-dedicated portfolio is out of touch with today’s sector, since many MLPs have converted to be corporations. The pool of money willing to invest directly in MLPs is limited to K1-tolerant US taxpayers – older, wealthy Americans. US equities are overwhelmingly held by institutions such as pension funds, endowments, foundations and sovereign wealth funds. These investors are mostly exempt from US taxes, so they avoid MLPs because it would create a tax liability for them. Only two of the ten biggest North American pipeline businesses are MLPs – the rest are corporations.

Several years ago the Federal Energy Regulatory Commission (FERC) announced a change in how their expenses were calculated that was adverse to natural gas pipeline MLPs. Taxes owed by their investors used to be included in the operating costs on which MLPs based their tariffs. FERC’s new rule would have lowered revenues, so natural gas pipelines soon converted to corporations to sidestep the issue.

It’s another example of the tax complexity that comes with MLPs. Although FERC later modified their stance, today’s MLPs tend to be (i) more liquids/less natural gas oriented, (ii) smaller, and (iii) more levered. The pipeline sector and MLPs are no longer synonymous.

AMLP has stuck with MLPs despite their shrinking relevance. If they considered diversifying into corporations this would put downward pressure on their current holdings, depressing their NAV and alarming investors. They’d need to obtain shareholder approval for this change of strategy and doing so would signal to the market an impending seller of MLPs. Many investors use AMLP to achieve pipeline exposure and, in our experience, few consider either the dwindling number of MLPs or the tax drag on returns. If AMLP was created today it would include pipeline corporations, in order to reflect the entire industry. It is an anachronism.

It now appears that AMLP investors must consider tax uncertainty on top of the haircut this imposes on returns. In their press release ALPS Advisors blames the NAV reduction on tax legislation passed in 2017, as well as the Coronavirus Aid, Relief, and Economic Security Act (“CARES Act”), which was passed in March 2020. The problem is not recent.

AMLP’s tax liability is updated daily, which suggests some certainty around its calculation. It looks as if ALPS had to modify their interpretation of the tax code, resulting in the sudden 3.9% NAV reduction. It must be complicated. Going forward, investors can no longer rely on the published tax liability. The press release warns that, “the daily estimate of the Fund’s deferred tax liability used to calculate the Fund’s NAV could vary significantly from the Fund’s actual tax liability.”

In other words, if ALPS gets their tax math wrong again, investors might face another big NAV adjustment. Because AMLP is a tax-paying entity and the tax code is fiendishly complicated, you can’t rely on the NAV being accurate.

Over the past five years, AMLP has significantly lagged the midstream energy infrastructure sector, because MLPs have lagged corporations and been more likely to cut their distributions. Investor inertia has presented little reason for any changes but lagging performance and now uncertain tax expense leave little here for the discerning investor.


Pipeline Stocks Defy Retail Fund Selling

SL Advisors Talks Markets
Pipeline Stocks Defy Retail Fund Selling
Loading
/

Midstream is up 27% for the year as of Tuesday, but investors are showing no irrational exuberance. The North American pipeline sector retains its MLP moniker because MLPs used to be the dominant business structure. Even though it’s now two thirds corporations, the ‘40 Act funds who specialize in the sector are still called MLP funds.

Investors have been exiting MLP funds for several years. JP Morgan calculates that 2016 was the last calendar year that saw inflows. The shale bust led to distribution cuts and saw several big MLPs convert to corporations. They did this in search of a broader investor base but often created a poor tax outcome for their MLP holders. The archetypal K-1 tolerant, US taxable, income seeking investor (ie rich old American) left in disgust. The Covid collapse in March 2020 was, for some, the last straw.

Fund flows are a notoriously poor predictor of performance. Look at the ARK Innovation ETF, where inflows were synchronized with its peak in early 2021. Within a year it had achieved the ignominy of earning a negative return on the average dollar invested (see ARKK’s Investors Have In Aggregate Lost Money).

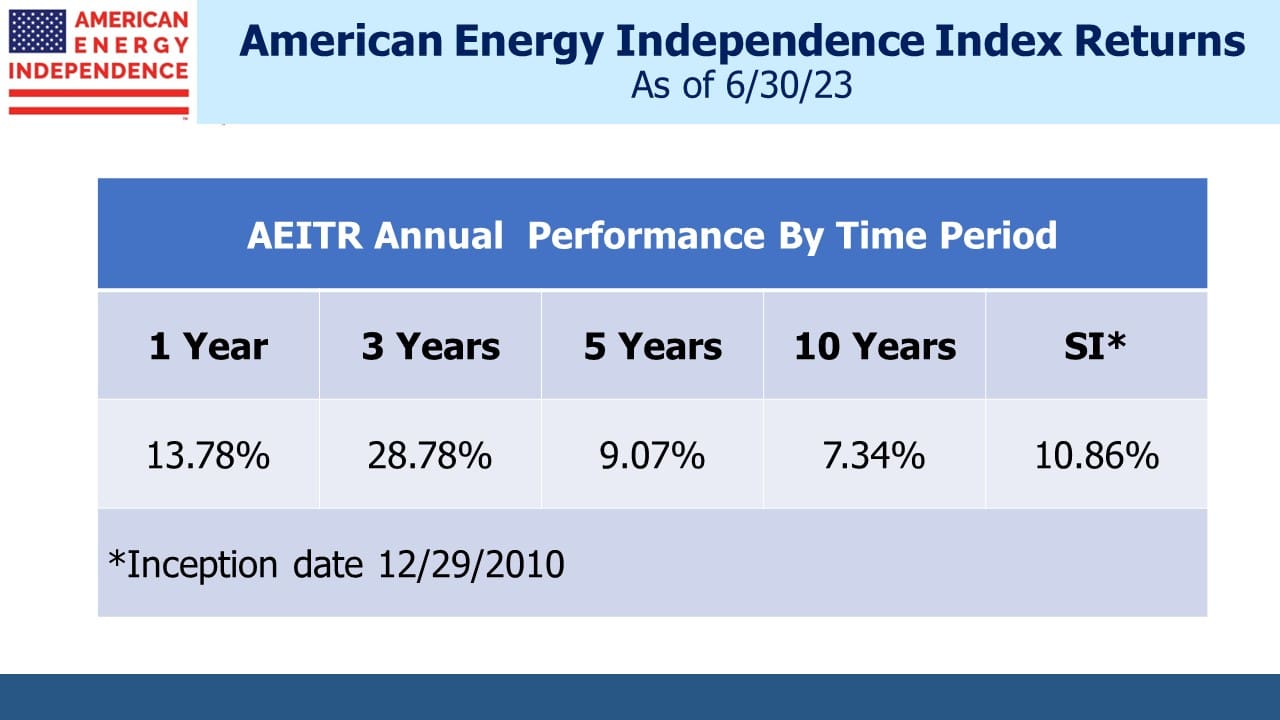
The history of MLP fund outflows coincides with a generally declining Alerian MLP Index (AMZ), but that is misleading because AMZ omits pipeline corporations which are held by the more diversified funds. Since September 2018 (the beginning of the fund flow chart) the broad and therefore more representative American Energy Independence Index (AEITR) has returned 10.8% pa.

The fundamentally bullish case for the sector is familiar to regular readers. However, the positive return despite persistent retail selling of MLP funds is another reason for optimism. If prices are rising when investors are turning away, it suggests that even a cessation of outflows could provide a further boost.

Morgan Stanley calculates that for the first nine months of this year midstream companies repurchased over $3.1BN in stock. This more than offset the selling of MLP funds by retail investors. What could be more bullish than the less informed selling to the better informed?

Investors like the link to PPI inherent in pipeline tariffs. It allows the companies to raise prices in line with inflation, expectations for which have remained surprisingly quiescent. The ten year CPI implied by treasury yields minus TIPs is a remarkable 2.28%. Since the next year will be well over the Fed’s 2% target, investors seem very comfortable that inflation will be back at pre-pandemic levels soon after. The University of Michigan survey provides a slightly different view, with CPI for the year ahead expected to be 5% and 2.9% over the long run.

More consumers report hearing about inflation hurting business conditions, and 43% report that rising prices are eroding their own living standards, up from 20% a year ago. John Williams, president of the Federal Reserve Bank of New York, warned that the unemployment rate could reach 5% as the Fed cools the economy, which would mean around 2.5 million extra unemployed.

With the unemployment rate at 3.7% and inflation just under 8%, the Employment Cost Index (ECI) is rising at 5%. This still leaves many workers worse off in real terms. Greater awareness of inflation as shown in the Michigan survey suggests it will figure more in pay demands as well as spending patterns where half of consumers report cutting back.

Four railroad unions have rejected a 24% pay increase over four years, threatening a strike that could cripple the movement of freight across the US. Congress may force them back to work. The US has a history of legislating against the disruption caused by strikes. In 2005 the New York City transit system shut down for a couple of days over a pay dispute. Under the law, the union leader was sentenced to ten days in prison and the union fined $2.5 million. Workers can strike but not if it causes substantial economic harm, which seems right.

By contrast, in the UK workers on the London underground schedule one day strikes every couple of weeks. An email update sent to travelers in early November breezily advised that there are “lots of public transport options” but added, “There are also some planned strikes taking place over the weekend and into next week.”  There is no equivalent legislation that prevents a small group from inconveniencing millions, a significant omission from UK labor law reflecting the country’s liberal leanings.

It’s one reason why UK inflation tends to run higher than in the US.

Upcoming ECI releases will be interesting because pay raises tend to come around year end. Consequently, the December and March ECI seasonal adjustments correct for this and lower the index. The seasonal factors are based on pay increases in a world of 2% inflation. With pay raises running at 5% and the job market robust, it would seem that the ECI could reflect higher than normal pay raises because the seasonal adjustments will be inadequate. Inflation will appear more entrenched, requiring a higher rate cycle peak.

The December ECI is some way off – the September report will be released on December 15th. Inflation won’t return to 2% until workers accept reduced compensation. There’s plenty of reasons to think this won’t happen soon.

Some Energy Forecasts Are Aspirational

SL Advisors Talks Markets
Some Energy Forecasts Are Aspirational
Loading
/

Long term energy forecasts are nowadays subject to a partisan test by many readers based on whether or not they project a rapid energy transition. The biggest oil and gas producers such as Exxon Mobil and Shell understand that the media interprets their published long run energy forecasts as reflecting their capex criteria. The result is a set of projections leavened with cheerleading for renewable energy, leaving the reader to separate the two.

The International Energy Agency (IEA) recently published their 2022 World Energy Outlook, and for the first time it projects a peak in natural gas consumption around 2030. The shift is caused by the loss of Russian exports to Europe, which has driven prices for LNG higher. The EU will import over 1.7 Trillion Cubic Feet (TCF) of additional LNG this year. This has caused many regions, including the EU, to turn to rely more on coal, as a workable alternative to high natural gas prices. But over the next decade, the IEA has increased its forecast of solar and wind power generation too.

The IEA’s base case is the Stated Policies Scenario (STEPS) which assumes current policies continue. Other scenarios envisage new policies, including a set consistent with achieving zero emissions by 2050. The world isn’t even consistent with STEPS, although it remains the most plausible of the IEA’s three scenarios. Including more extreme outcomes allows the IEA to be an energy transition champion if not an unbiased forecaster.

The 2022 Outlook includes many useful facts: this year fossil fuel producers have enjoyed a $2TN jump in net income (a “windfall”) versus 2021; governments have committed over $500BN in tax breaks and energy subsidies to households, hence the trend towards taxing windfall profits in Europe. Permitting and construction of overhead electricity transmission lines can take up to 13 years, with developed countries often the slowest. 75 million people who recently gained access to electricity are likely to lose it this year.

How likely is the IEA STEPS to be right?

The US Energy Information Administration (EIA) sees consumption of all energy sources increasing. They see renewables output more than doubling over three decades and gaining market share. Rising energy consumption to support higher living standards in the developing world is the dominant theme. The EIA sees global energy consumption rising by over 40%, a 1.2% annual rate of increase. This is slower than the 1.9% annual rate of increase the world experienced in the decade (2009-19) leading up to Covid.

By contrast, the IEA STEPS outlook based on existing policies projects a growth rate collapsing to under 0.3% per annum. There is no basis in history to support this. It implies a much longer path to the rising living standards that are the aspiration of developing countries. Their other scenarios assume almost no growth and an actual decline.

In 2020 the world’s ten year growth rate in energy consumption dipped to 1% pa for the first time in several decades because of Covid. Last year’s 5.8% annual increase brought the ten year growth rate back up to 1.3%, and it’s likely to edge higher again after this year. Forecasts are becoming less neutral and more aspirational, a form of political correctness at large organizations that requires more skeptical reading. In BP’s projections of global energy consumption, their three scenarios are called Accelerated, Net Zero and New Momentum. Their projected annual growth rates are 0.3%, 0.1% and 0.6% respectively.

The EIA, an agency of the US Department of Energy, provides the most plausible growth rate of the three. Accepting even the most realistic forecasts of the IEA or BP suggests billions of poor people acquiescing to constrained improvement in living standards.

Meanwhile Shell sees a bright future for LNG.

The chart showing a sharp drop in EU wind turbine orders illustrates some of the challenges facing that industry. Russia’s invasion could have been a big boost for wind (watch Why Aren’t Renewables Stocks Soaring?), but companies are struggling to make a profit.

The Economist magazine is projecting an increase in deaths this coming winter, with even a mild winter causing a seasonally adjusted rise. Such are the consequences of Europe’s failing energy strategy.

Lastly, Tellurian CEO Sharif Souki is the subject of a WSJ article that examines his failure to repeat the success he enjoyed at Cheniere (see US Natural-Gas Pioneer Struggles in His Second Act). Souki is a visionary, but he’s been handsomely paid for not delivering. We highlighted this “pay for performance in advance” in a recent video (see What’s Next For Tellurian?).

Souki admitted recently that his mistake had been to retain the price risk on shipped LNG. He’s bullish on prices, but lenders don’t share his enthusiasm for the risk. Conventional LNG projects charge a liquefaction fee that largely leavers the price risk with the buyers and sellers.

Although Tellurian has been forced to adjust its business model, Souki’s expectation for continued growth in energy demand from emerging economies looks realistic to us. Forecasters such as the IEA might benefit from considering it.


COP27 Realism Is Good For Gas

SL Advisors Talks Markets
COP27 Realism Is Good For Gas
Loading
/

The COP27 ended with an agreement by rich countries to make increased payments to poor ones, but a commitment to phase out all fossil fuels failed to gather unanimous support. The holdouts included Saudi Arabia and Russia, who supply substantial volumes of oil and gas to willing buyers but don’t rank highly on the list of global emitters. Developing countries were also reluctant to make such a pledge, because they’re trying to raise living standards which requires more energy.

The EU and several OECD nations regarded the missing phase-out of fossil fuels as a failure. Climate change negotiations remain hobbled by two incongruities: the first is that developing nations who are most exposed to rising sea levels are less enthusiastic about steps to prevent this than the rich world.

The second is that suppliers of reliable energy are constantly pressured to reduce output while consumers face little incentive to curb demand. Rich countries could adopt policies that force their citizens to stop buying fossil fuels, but it would be too disruptive.

Unable to persuade voters that they should reject anything made with reliable energy, policymakers are left with forcing supply scarcity. The ESG movement and climate extremists have caused reduced capex which has raised prices, but there’s little sign of a demand response. Instead, they’ve made energy the best performing sector in the S&P500.

Some observers regarded COP27 as a failure. But the uneven support for phasing out fossil fuels forced the first incongruity noted above into the open. Namibia’s Maggy Shino said, “Africa wants to send a message that we are going to develop all of our energy resources for the benefit of our people because our issue is energy poverty.”

The Inflation Reduction Act (IRA) that President Biden signed on August 16th improved the viability of carbon capture via increaseed 45Q tax credits. Energy executives have figured out that more CO2 buried underground means reduced emissions and less pressure to phase out natural gas. 3Q earnings calls were sprinkled with references to carbon. It was mentioned 25 times on Occidental’s call, where they reported, “we broke ground on the world’s largest direct air capture plant in Ector County, Texas.”

Exxon Mobil plans to share more details about their “low-carbon solutions business” in December.

Among pipeline companies, Kinder Morgan’s CEO Steve Kean said the IRA, “has made more sources of CO2 economic for capture.”

Energy Transfer plans to sequester (ie bury) CO2 emissions from its planned Lake Charles LNG export facility.

Enbridge CEO Al Monaco said the IRA, “is providing a real catalyst for low-carbon investments.”

Jim Teague, Enterprise Products’ Partners co-CEO, said, “Asia continues to make no bones about their long-term appetite for our energy. We at Enterprise have been emphatic that it’s going to take all of the above in order to meet the world’s growing energy needs. That’s why in addition to traditional midstream services, we’re also focused on investments in lower carbon projects like carbon capture and sequestration and providing blue ammonia into export markets.”

Midstream energy infrastructure has an important role to play in the energy transition.

Demonstrating Asia’s willingness to make long term natural gas commitments, Qatar  signed a 27 year deal with China’s Sinopec for 4 million tonnes per annum, Qatar is playing in their first World Cup and became the only host nation in history to lose its opening game. Having watched it, betting on three straight losses seems safe. But on the world’s LNG stage they are top three (with the US and Australia).

EU climate policy chief Frans Timmermans thinks compared with coal and oil, natural gas, “is a different situation for which I have some understanding, especially if you combine that with infrastructure that is prefitted to also carry gases with other densities, such as green hydrogen or green ammonia in the future.”

European buyers continue to shun long term LNG contracts, preferring to buy as needed on the spot market at prevailing prices. The coming northern hemisphere winter is a swing factor for global LNG prices over the next several months. But over the next three years, Japan’s trade ministry warned that competition for supplies will intensify, with no new contracts available before 2026.

Many investors often note the correlation between midstream and crude oil. This month the sharp drop in oil has not been reflected in the pipeline sector which is roughly flat MTD. We think the continued growth in free cash flow and decreasing leverage are allowing a decoupling from commodity prices. If so, investors will welcome it.


Why Aren’t Renewables Stocks Soaring?

SL Advisors Talks Markets
Why Aren’t Renewables Stocks Soaring?
Loading
/

2022 should have been a great year for renewables. The prices of fossil fuels, which they are supposed to replace, have jumped. Russia’s invasion of Ukraine has heightened the importance of energy security, which solar panels and windmills offer because most countries can find places to build them. And global Green House Gas emissions (GHGs) have rebounded following the dip caused by the pandemic. So why aren’t renewables stocks riding high?

One reason could be that some of them had benefited from the long rally in tech stocks. Investors in both sectors are typically relying on high growth rates which means years of waiting for a reasonable free cash flow yield. Rising interest rates put a higher discount rate on those delayed future earnings.

A more likely answer is that investors are becoming more realistic about the profitability of renewables. Germany’s north coast is windy, but they and others scrambling to replace Russian natural gas did not bid up the price of windmills. Instead, they hoovered up every available Floating Storage and Regasification Unit (FSRU) on the planet. The onshore pier, pipelines and electricity lines for the first one were completed last week in a brief 194 days in Wilhelmshaven on the North Sea. They’re also planning to build onshore import terminals for LNG, which have greater capacity than FSRUs.

European LNG prices famously reached ten times the US price earlier in the summer before dropping back to around 5X now. European storage is full in preparation for winter. Dozens of LNG tankers are idling offshore waiting for better prices before they unload their cargoes. Many analysts expect it’ll be harder to replenish stocks for next winter, since Russian gas was flowing west through Nord Stream 1 for the first half of this year.

Coal prices have soared as developing countries have been deterred from competing with Europe’s new appetite for LNG. Among non-OECD (ie developing) countries coal provides 46% of their power, versus only 19% in the rich world. And developing countries are where energy demand is growing.

China burns half the world’s coal and relies on it for 63% of their electricity.   They’ve even justified new coal plants as necessary for energy security (what’s Chinese for chutzpah?). Egypt is making government buildings and shopping malls turn their air conditioning up to 77° F, thereby reducing domestic demand for natural gas so they can export more.

Coal and gas together provide 59% of the world’s electricity, and both are much more expensive than a year ago. It’s as if the world had agreed on carbon taxes to improve the economics of renewables. There are numerous articles stating that solar and wind are cheaper than reliable energy, most of which pre-date the run-up in coal and gas. Renewables stocks should be soaring.

But they’re not. Danish wind turbine manufacturer Vestas expects a profit margin this year of minus 5% and recently reported a bigger 3Q loss than expected. They are optimistic that they can boost prices over the long run.

The CEO of Siemens Energy reminded viewers on CNBC that, “renewables like wind roughly, roughly, need 10 times the material [compared to] what conventional technologies need.” Current fiscal year EBITDA is down 42% and the company isn’t planning to pay a dividend.

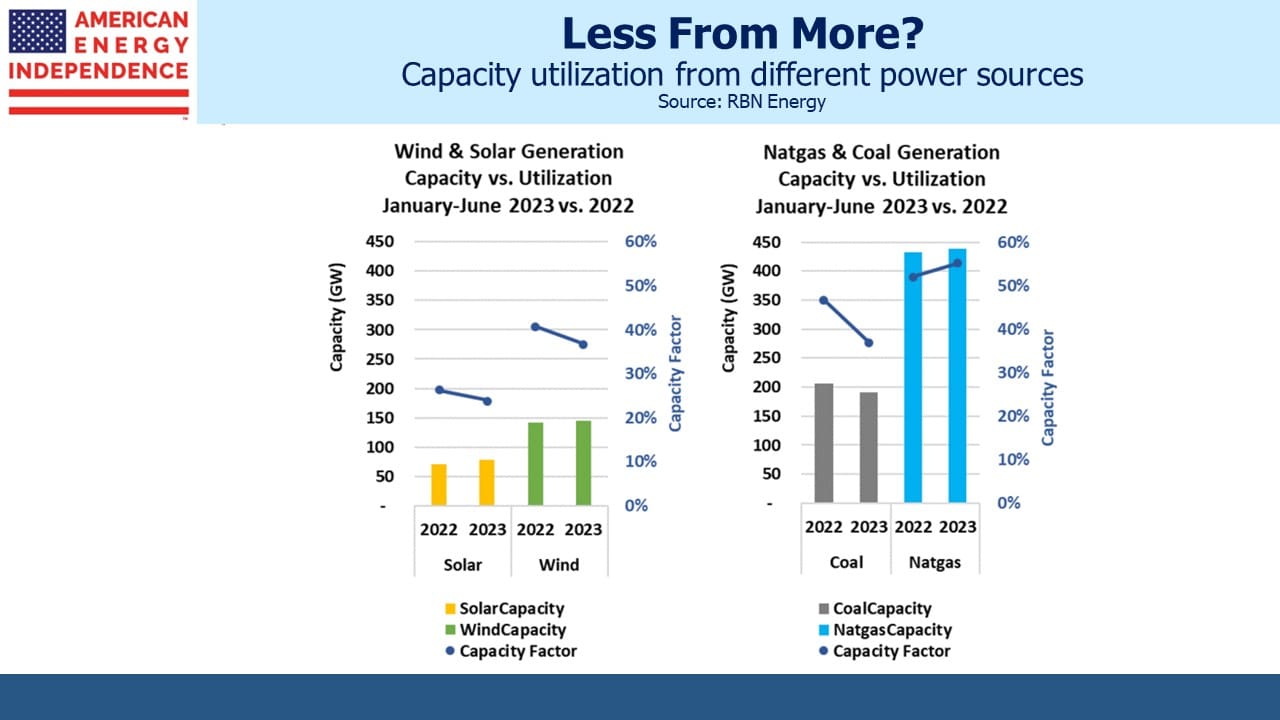
UK solar operator Toucan Energy has gone bankrupt, with debts including £655 million ($779 million) to Thurrock Council, the local government where it operates. Neighboring London averages 1,481 hours of sunshine a year, which is 17% (Tampa, FL is 33%). 48% of UK electricity comes from natural gas. Although solar is 7%, UK solar farms can expect 83% or more downtime. Combined cycle natural gas power plants are typically down 5% of the time for maintenance. That’s why Toucan borrowed money from a local government rather than return-oriented investors.

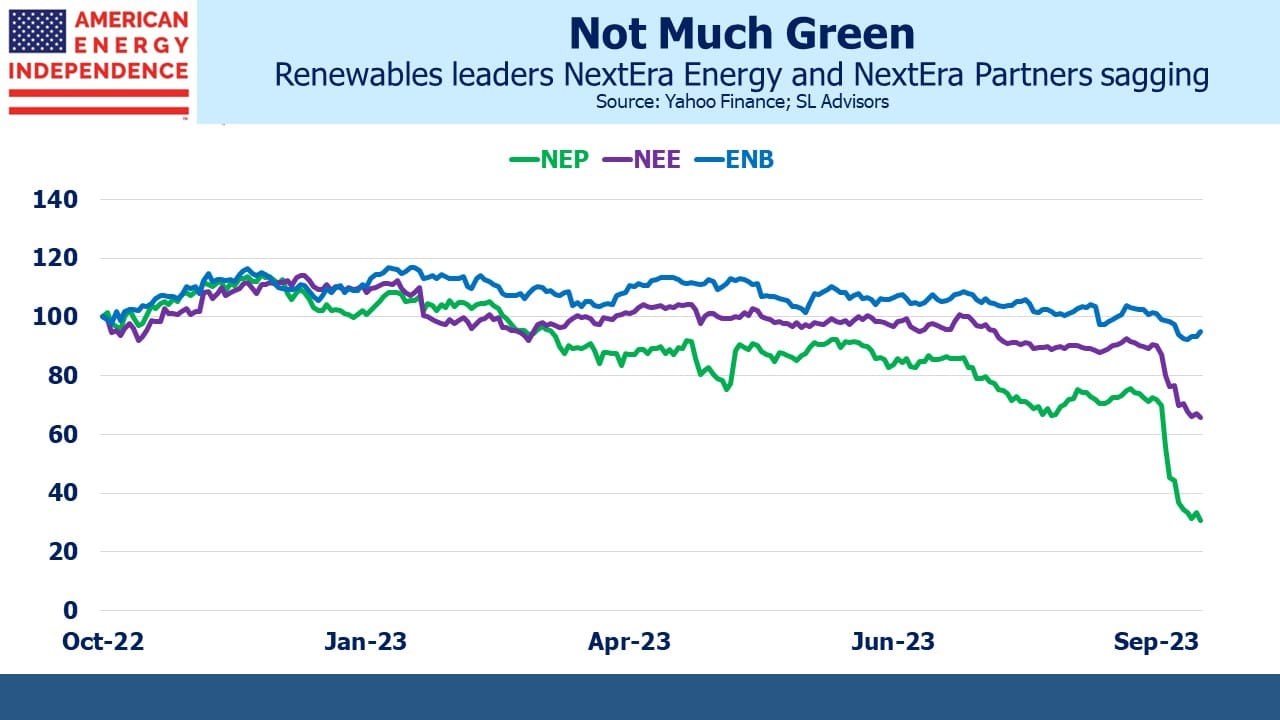
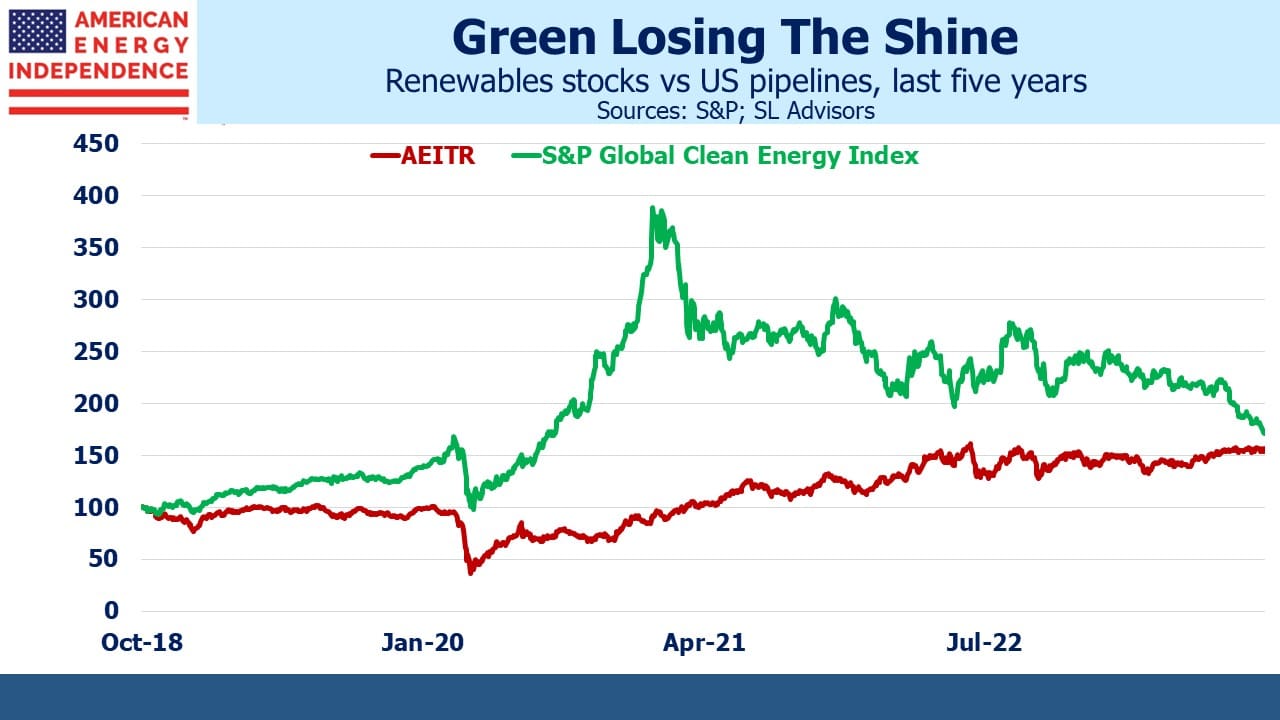
The five biggest renewables ETFs are beating the S&P500 but lagging the American Energy Independence Index (AEITR). The global economy is rebounding from Covid, apart from China. Relying on foreign countries for energy is suddenly riskier. Fossil-fuel inputs for almost 60% of the world’s electricity have jumped in price. All these factors should have made renewables a hot sector.

Instead, a weary realism has cooled belief in a rapid energy transition. Developing countries are looking for very large payments from the rich world to help them invest in cleaner energies. This challenges the claims of those who argue that solar and wind are already the cheapest way to generate electricity.

The International Energy Agency (IEA) forecasts 0.5% annual production growth in natural gas through 2030 in their Stated Policies Scenario (STEPS). This is the most plausible one because it doesn’t assume every government’s climate pledges will be fulfilled. In their 2022 World Energy Outlook the IEA expects unconventional gas production (ie shale, overwhelmingly US) to grow at 2% annually. They estimate 750 million people don’t have access to electricity, and 2.4 billion don’t have access to clean cooking (meaning they cook using fuelwood, charcoal, tree leaves, crop residues or animal dung). Getting these families onto natural gas would improve their lives and leave the planet better off as well.


Of Red Crypto And Black Pipelines

SL Advisors Talks Markets
Of Red Crypto And Black Pipelines
Loading
/

Bitcoin could be poised for another ascent. Bulls will be encouraged that Jim Cramer advised holders to sell following the collapse of FTX. Few readers would have been surprised when this blog first expressed crypto-skepticism in December 2017. Its return since then is 1.7% pa, substantially behind the market and, naturally, midstream energy infrastructure.

But annualized returns are too pedestrian to be the metric of choice for crypto-traders. They prefer “X”, as in “I made 3X on crypto so far this year.” For them, red is the new black.

Bitcoin is too volatile to be a store of value. Exchanges are routinely hacked. And the government can seize it. So what’s the point of it? You don’t have to short bitcoin to be unconvinced – avoiding it is sufficient. It has always looked like a modern Dutch tulip bulb craze. Not everything that changes in value is an investment or needs to be traded. Many investors in FTX were proponents of decentralized finance (“defi”), valuing the freedom to operate outside existing regulatory structures. Now as many as a million creditors are relying on regulators and national justice systems to salvage value for them.

The long term bull case for bitcoin sees it assuming the role of a widely-held currency, with a yield curve reflecting interest rate expectations set in the absence of a central bank. For now the US$ is not threatened with a loss of dominance. Fed funds futures project a cycle peak of just under 5%, sooner and higher than a few weeks ago. Like the FOMC, the market expects rates to begin decreasing a few months later. Fed chair Jay Powell did suggest rates could peak at a higher level than previously expected, but that was before the benign CPI number.

Investors sometimes ask us about the exposure of pipeline companies to rising interest rates. The chart from Wells Fargo is informative and shows the preponderance of fixed rate debt across the sector. Wells Fargo estimates that a 1% increase in short term rates would reduce free cash flow by a similar percentage. With around half the industry’s EBITDA subject to inflation-linked tariffs, elevated PPI and interest rates is preferable short of causing a recession.

The COP27 is notable for more realism (see Energy Pragmatism Is Beating Extremism) and the presence of traditional energy companies. EQT is the biggest producer of natural gas in the US. Their CEO Toby Rice has been vocal in making the case for natural gas as a substitute for coal. “The most important thing is for people to see America’s largest natural gas producer here at COP27 as a symbol that we’re going to be a leader in energy transition,” said Rice on the sidelines of the conference.

Coal power plants produced a fifth of global greenhouse gas emissions in 2021, more than any other single source, according to the International Energy Agency. China consumes half the world’s coal. Their representatives at COP27 offered the novel argument that Russia’s invasion of Ukraine justifies this. China is building coal burning power plants roughly equal to what the US has operating, but this is apparently to improve energy security and does not represent a shift in emissions policies. Do residents of California or Germany, where expensive electricity comes with high renewables penetration, grasp this? Should we believe it?

The White House has been frustrated that US E&P companies haven’t responded to higher prices by increasing drilling. Few are surprised given the hostile posture the Administration has towards the energy industry. It’s imperceptible on the chart but Drilled Uncompleted wells (“DUCs”) increased for the first time in over two years. The steady decline in DUCs has long frustrated Joe Biden, who has excoriated companies for not producing more oil in between promising no more fracking.

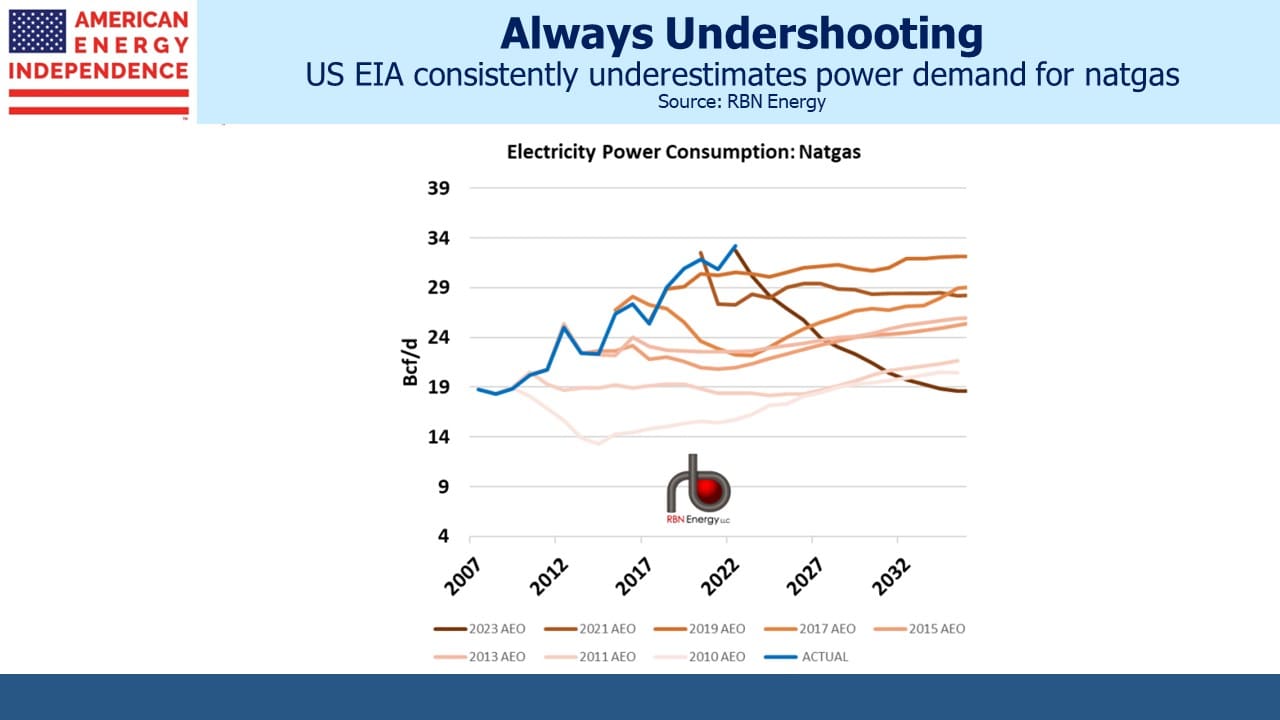
Meanwhile, natural gas production continues to move higher. The US Energy Information Administration noted that natural gas is providing 38% of US electricity, up from 37% last year. In recent months the power sector has taken record amounts, consuming about a third of total US output. The EIA projects a slight drop next year, although that was once their 2022 forecast as well.  Along with renewables, growth is at the expense of coal.

The industrial sector and exports of Liquefied Natural Gas (LNG) have both been growing in recent years. There’s little doubt that LNG will continue to rise, providing energy security and a cleaner alternative to coal for its buyers. Crypto investors probably regard pipelines as boring, but tangible assets have their place too.

image_pdfimage_print