The Cool North Sea Breeze Lifting US Coal
Anyone who’s visited Felixstowe on England’s windy east coast knows that umbrellas enjoy a brief existence in offering protection from the rain. Farther north off the coast of Scotland, the North Sea is one of earth’s most hostile places to drill for oil. Gales are common. Working an oil rig isn’t for the nervous.
Consequently, the North Sea is an obvious location for windfarms. Last year Britain obtained almost a quarter of its electricity from wind, a key element in the country’s drive to reduce CO2 emissions. But even the North Sea isn’t always windy, and a recent period of relative tranquility has caused havoc to European markets for electricity.
Renewables clearly have their place, but the problem of their intermittency increases with their share of power generation. They’re also non-diversified – ten gas-burning power plants operate independently with downtime at one unlikely to affect the others. But if it’s not sunny or windy, a region’s entire renewables supply can be rendered inoperative. One indicator of a grid overly reliant on unreliable power is sharp spikes in electricity prices.
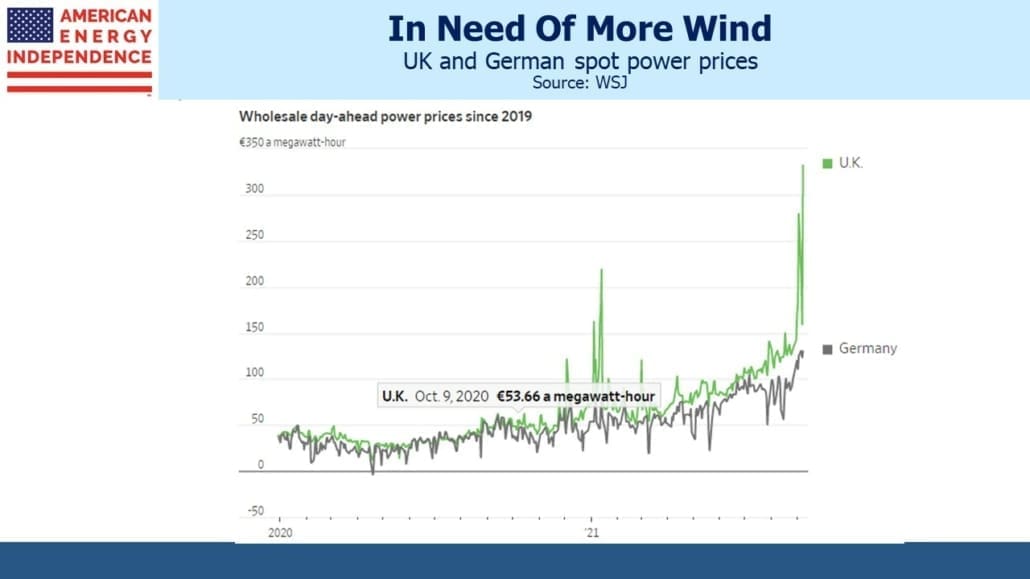
Wholesale electricity prices one day ahead (in effect, the spot market) soared to €331 per Megawatt Hour (MWh) in the UK recently. It’s priced in Euros not Sterling because the UK grid sometimes imports electricity from France or the Netherlands. Britain had to restart gas and coal burning power plants, including one in Nottinghamshire that will be permanently closed by 2024 when the government has committed to phase out coal completely.
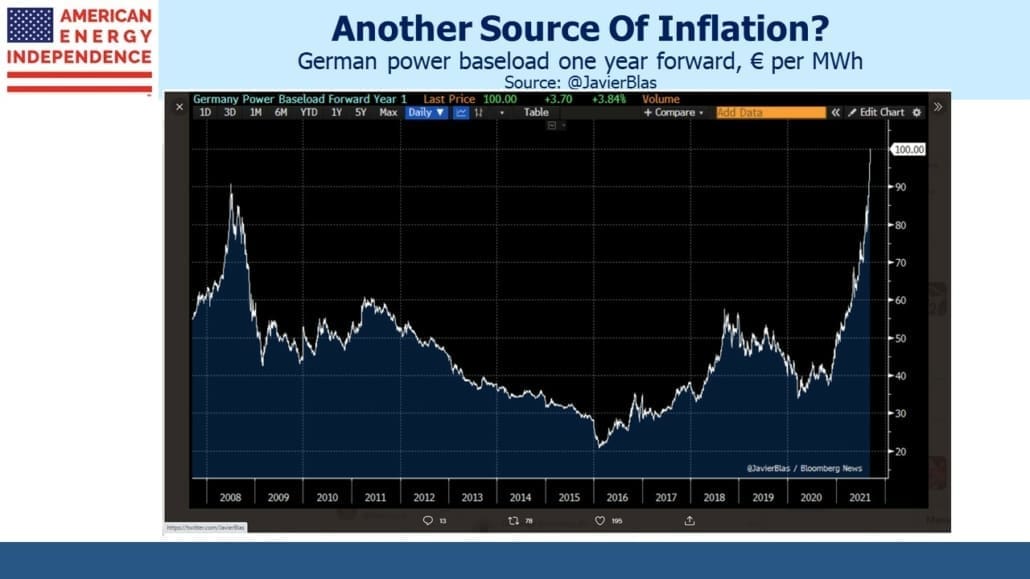
There was a ripple effect into European markets. But there are reasons to think this recent price spike is not just a temporary result of unusually calm North Sea weather. In Germany, one year ahead baseload power prices continued their ascent and reached a new thirteen-year high.
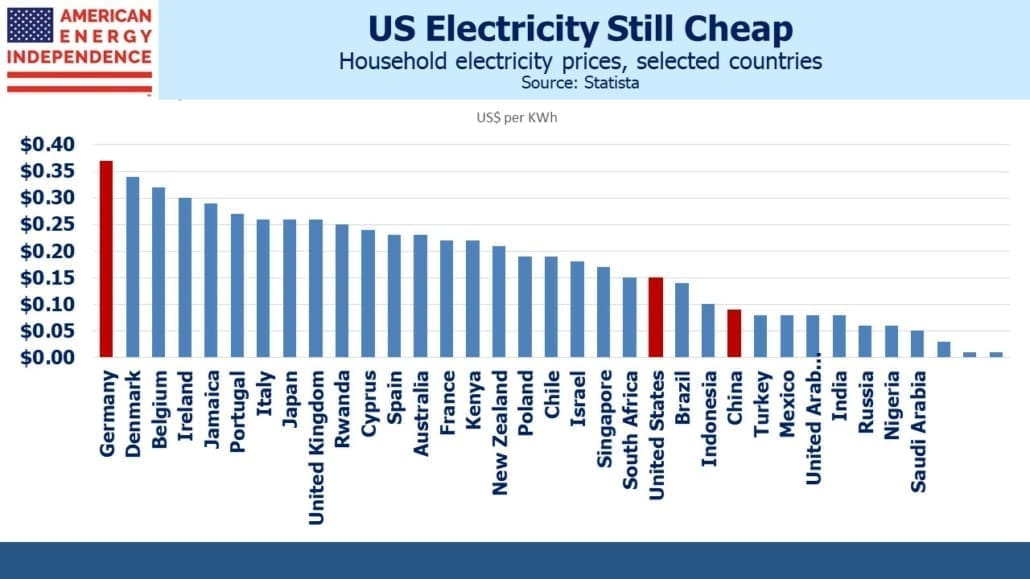
German household electricity prices are already the world’s highest, more than double the US and four times China. There are a couple of lessons here – the first is that western societies will clearly tolerate much higher energy prices than we have in the US. Environmental extremists continue to disingenuously promote renewables as cheaper than conventional power. But the biggest users, such as Germany or California, have the highest prices.
The second lesson is that it’s implausible for China to wish to emulate OECD countries’ electricity cost structure. Their commitments on emissions reductions aren’t credible. Progressive Democrats seem to think that with solar and wind the US can alter the climate alone and lower prices. Instead, they should be honestly promoting much higher energy prices as easily affordable and worth paying for. They should also be advocating to confront China on its hollow CO2 commitments.
Less wind in Europe has boosted demand for natural gas, including imports of Liquified Natural Gas (LNG) from the US (see The Bull Market in Natural Gas). This has pushed up domestic natural gas prices to such an extent that the US Energy Information Administration expects gas to provide 35% of power generation this year and 34% in 2022, down from 39% last year.
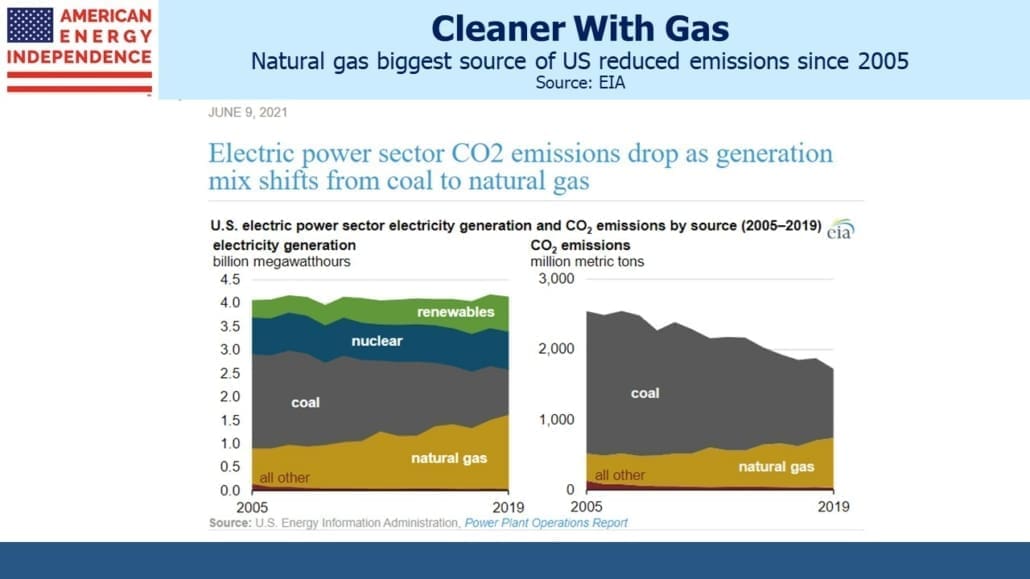
Coal-to-gas switching has been the biggest source of reduced US emissions over the past fifteen years. Although solar panels and windmills get all the attention, actual progress has come about through increased use of natural gas. The Shale Revolution may not have delivered promised investment returns, but the abundant and cheap natural gas that resulted have driven our CO2 emissions down.
This positive development came about through relative pricing — cheap natural gas caused utilities to use more of it versus relatively higher-priced coal. Today’s increased natural gas prices are causing this positive development to reverse. The good news is that the US has enormous supplies of natural gas that can be profitable below $3 per MMBTU, compared with current prices of over $5.
US coal production has been in steady decline for over a decade. Connected global energy markets have created a link between a windless North Sea and increased US coal demand.
OPEC also revised up their forecast for 2022 global crude oil demand, which they now expect to eclipse the 2019 pre-Covid level of 100.3 Million Barrels per Day. It’s more proof that the world will use more of all energy sources in the years to come.
Important Disclosures
The information provided is for informational purposes only and investors should determine for themselves whether a particular service, security or product is suitable for their investment needs. The information contained herein is not complete, may not be current, is subject to change, and is subject to, and qualified in its entirety by, the more complete disclosures, risk factors and other terms that are contained in the disclosure, prospectus, and offering. Certain information herein has been obtained from third party sources and, although believed to be reliable, has not been independently verified and its accuracy or completeness cannot be guaranteed. No representation is made with respect to the accuracy, completeness or timeliness of this information. Nothing provided on this site constitutes tax advice. Individuals should seek the advice of their own tax advisor for specific information regarding tax consequences of investments. Investments in securities entail risk and are not suitable for all investors. This site is not a recommendation nor an offer to sell (or solicitation of an offer to buy) securities in the United States or in any other jurisdiction.
References to indexes and benchmarks are hypothetical illustrations of aggregate returns and do not reflect the performance of any actual investment. Investors cannot invest in an index and do not reflect the deduction of the advisor’s fees or other trading expenses. There can be no assurance that current investments will be profitable. Actual realized returns will depend on, among other factors, the value of assets and market conditions at the time of disposition, any related transaction costs, and the timing of the purchase. Indexes and benchmarks may not directly correlate or only partially relate to portfolios managed by SL Advisors as they have different underlying investments and may use different strategies or have different objectives than portfolios managed by SL Advisors (e.g. The Alerian index is a group MLP securities in the oil and gas industries. Portfolios may not include the same investments that are included in the Alerian Index. The S & P Index does not directly relate to investment strategies managed by SL Advisers.)
This site may contain forward-looking statements relating to the objectives, opportunities, and the future performance of the U.S. market generally. Forward-looking statements may be identified by the use of such words as; “believe,” “expect,” “anticipate,” “should,” “planned,” “estimated,” “potential” and other similar terms. Examples of forward-looking statements include, but are not limited to, estimates with respect to financial condition, results of operations, and success or lack of success of any particular investment strategy. All are subject to various factors, including, but not limited to general and local economic conditions, changing levels of competition within certain industries and markets, changes in interest rates, changes in legislation or regulation, and other economic, competitive, governmental, regulatory and technological factors affecting a portfolio’s operations that could cause actual results to differ materially from projected results. Such statements are forward-looking in nature and involves a number of known and unknown risks, uncertainties and other factors, and accordingly, actual results may differ materially from those reflected or contemplated in such forward-looking statements. Prospective investors are cautioned not to place undue reliance on any forward-looking statements or examples. None of SL Advisors LLC or any of its affiliates or principals nor any other individual or entity assumes any obligation to update any forward-looking statements as a result of new information, subsequent events or any other circumstances. All statements made herein speak only as of the date that they were made. r
Certain hyperlinks or referenced websites on the Site, if any, are for your convenience and forward you to third parties’ websites, which generally are recognized by their top level domain name. Any descriptions of, references to, or links to other products, publications or services does not constitute an endorsement, authorization, sponsorship by or affiliation with SL Advisors LLC with respect to any linked site or its sponsor, unless expressly stated by SL Advisors LLC. Any such information, products or sites have not necessarily been reviewed by SL Advisors LLC and are provided or maintained by third parties over whom SL Advisors LLC exercise no control. SL Advisors LLC expressly disclaim any responsibility for the content, the accuracy of the information, and/or quality of products or services provided by or advertised on these third-party sites.
All investment strategies have the potential for profit or loss. Different types of investments involve varying degrees of risk, and there can be no assurance that any specific investment will be suitable or profitable for a client’s investment portfolio.
Past performance of the American Energy Independence Index is not indicative of future returns.


Leave a Reply
Want to join the discussion?Feel free to contribute!