Partnering with Pipeline Protesters

Suppose that the owner of a pipeline operating at 100% capacity opposed the construction by a competitor seeking to meet unsatisfied demand. Or consider two operators of competing pipelines that agree to refrain from adding needed capacity. Such behavior would be anti-competitive, hurting consumers but good for the pipeline operators and their owners. Scarcity of pipeline capacity would allow higher tariffs and curtailed investment in new projects. Investors would cheer.

Pipeline Protesters Unite

In many ways, the efforts of environmental extremists to oppose new pipeline construction has the same effect as if the pipeline operators themselves declined to invest in meeting new demand. Con Edison has placed a moratorium on new gas hookups across most of Westchester County, because of the inability to bring more gas into New York State.

Over the last decade, New York’s residential gas consumption has jumped by 20%, and electricity generation has become increasingly dependent on gas-fired generators. When the state retires its two Indian Point nuclear reactors in 2020 and 2021, it will need to find a replacement for 25% of the power for New York City and Westchester county. Anti-nuclear groups call for renewables to replace the lost power, but that may be difficult as non-hydroelectric renewables account for just 6% of the current mix.  Natural gas provides the largest share at 35%.

Category New York Net Electricity Generation thousand MWh % of Electric Mix
Natural Gas-Fired 3,343 35%
Nuclear 2,796 29%
Hydroelectric 2,710 28%
Nonhydroelectric Renewables 608 6%
Coal-Fired 66 1%
Petroleum-Fired 12 0%

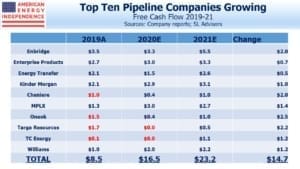
Opponents of new pipelines want to impede consumption of natural gas in their quixotic effort to combat climate change. Although they would appear to share little common ground with pipeline investors, their success reduces the backlog of new projects, thereby lowering the sector’s capex. Perversely, pipeline investors complaining about poor capital discipline are being helped by environmental activists.

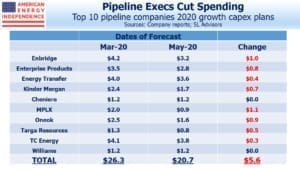
Natural gas demand is growing across the U.S., and globally. U.S. crude oil is gaining market share and meeting most of the growth in demand, which is largely from developing countries. The midstream energy infrastructure sector continues to plan new projects to transport America’s growing output. Although growth capex probably peaked last year, substantial investments are planned this year. Williams Companies (WMB) estimates $2.4BN in spending on new projects, including their proposed natural gas pipeline across New York harbor that was recently rejected.

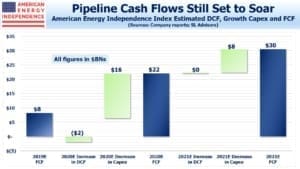
Growth capex is the chief headwind to generating higher Free Cash Flow (FCF), a metric broadly familiar to generalist equity investors and likely to draw non-traditional buyers once FCF yields exceed the S&P500.

Moreover, recognizing the strength of opposition to new construction allows pipeline operators to enjoy stronger pricing supported by relative scarcity. They have a convenient excuse for their customers and regulators to justify profitable bottlenecks and constrained capacity. If the industry sought to create such conditions itself, an anti-trust investigation would surely follow. In fact, environmental opposition is providing the political cover to seek oligopolistic profits.

Building new infrastructure is in the DNA of every midstream management company. Their dislike of the Sierra Club is visceral. Investors have reflexively joined the criticism of those who would impede customers’ access to more oil and gas.

But on reflection, while we disagree with the virtue-signaling that governs much of the anti-carbon movement, we’ve concluded that, as investors in midstream energy infrastructure wanting higher FCF, our interests are more aligned than with company managements.

We want fewer new pipelines too. MLP investors might consider joining the next protest. The outcome could be better than you think.

Gas Pipelines having Problems Gets Built? Owner Description
Atlantic Coast Coin flip Dominion, Duke, Piedmont, Southern WV  to VA & NC
Constitution Long shot Williams, Cabot, Piedmont, WGL PA to NY
Mountain Valley Perhaps EQM, NextEra, Con Edison,  WGL, RGC WV to Southern VA
Northeast Supply Enhancement Doubtful Williams PA to NYC

We are invested in WMB.

SL Advisors is the sub-advisor to the Catalyst MLP & Infrastructure Fund.  To learn more about the Fund,  please click here.

SL Advisors is also the advisor to an ETF (USAIETF.com).


Pipelines Get Adult Supervision…Private Equity

Last week’s blog (see Plain Talk, Fuzzy Math) showed how Plains All American (PAA) miscalculates its cost of equity capital. Equity is the key component in a company’s Weighted Average Cost of Capital (WACC). In the presentation from their investor day, it was too low. We received several comments from readers and investors on the topic. The energy industry has been plagued with executives who value growth in assets over achieving an appropriate Return On Invested Capital (ROIC). Profits come from ensuring that a company’s assets earn a return higher than the cost of financing them, or that ROIC > WACC.

Return of Capital v Cost of Capital for pipeline companies

In one meeting with PAA, we asked if they’d considered selling themselves, since there’s a case that the company’s worth more in another’s hands. “Not yet ready to retire” was the answer. Financial discipline comes in many forms.

In too many cases, a CEO’s pay is directly linked to a company’s size. Per share operating metrics and capital efficiency ought to dominate. Management teams often strive for growth, which can conflict with an owner’s desire to earn a good return. Identifying companies where interests are more clearly aligned with investors is worthwhile.

Calculating ROIC for energy infrastructure businesses is tricky. Projects are funded over several years, and project-based returns are generally not disclosed. Therefore, some judgment is required. Wells Fargo made a serious attempt at calculating company-specific ROIC figures last year. A couple of companies (Enterprise Products and Plains) preferred their own methodology over that used by Wells Fargo, and their objections were duly noted in the research report. We explained in last week’s blog why we disagreed with PAA’s approach.

Pipeline Companies Five Year Return on Capital

One solution to poor capital allocation decisions is to favor public companies with a significant private equity investor. At first this might seem odd. Private Equity (PE) has delivered mediocre results for investors (see a recent WSJ article, Private-Equity Firms Are Raising Bigger and Bigger Funds. They Often Don’t Deliver). The problem for PE investors is the ubiquitous “2 and 20” fee structure, which is a big drag on returns and has created some fabulous fortunes. However, most PE managers are financially more astute than the typical pipeline company finance department. The best apply rigorous financial analysis, and investing alongside them can be an attractive proposition.

Pipeline companies with a large private investor

Having a PE partner doesn’t guarantee good judgment, but it does assure that when such decisions are being made, there will be a voice demanding a profitable spread between ROIC versus WACC. Private equity is all about capital efficiency and achieving an attractive IRR. Many energy companies could benefit from greater financial discipline. A few already have such a partner, reflecting the more optimistic outlook PE investors have of the sector compared with public market valuations.

Blackstone and its affiliates own 44% of Tallgrass Energy (TGE). Investors in TGE are in effect co-investing alongside Blackstone, without having to pay Blackstone a fee. It’s appealing to all TGE holders to know that capital allocation decisions require Blackstone’s support.

Crestwood (CEQP) is a similar situation, with their private equity partner First Reserve, who own 25% of CEQP and has also invested in JVs with CEQP on mutually beneficial terms.

Activists can also play a constructive role. In 2016 Carl Icahn pushed Cheniere’s (LNG) CEO Charif Souki out of the company. That’s one solution to the principal-agent problem. Souki is a colorful character (see Coals to Newcastle), but Icahn disagreed with LNG’s investments in oil companies, which were not linked to their core business of exporting liquefied natural gas. In an interview with CNBC, Icahn explained why, and also vented his frustration with Souki’s compensation. The subsequent improved capital allocation and focus on executing their core business plan has seen LNG stock rise from $39 at the time of Icahn’s intervention to $66 today, without paying a dividend.

Enterprise Products Partners (EPD) has a well-regarded reputation for prudent management. Growth projects are funded internally. The Duncan family owns a third of the company and controls EPD, helping align shareholder interests with managements.

Global Infrastructure Partners recently invested in Enlink Midstream (ENLC), and currently owns 41%. Texas Pacific Group and Goldman together own 12% in preferred securities which are convertible into common equity. It’s too early to judge the impact of their ownership, but encouragingly ENLC’s CEO Mike Garberding was previously the CFO. We think it’s highly likely that capital discipline will become apparent at ENLC.

Significant equity ownership by management doesn’t always lead to good decisions. Rich Kinder continued to add to his already significant holding in Kinder Morgan (KMI), even as it lost two thirds of its value from 2015-16. KMI investors could have benefitted from an influential outsider. Energy Transfer (ET) is also heavily owned by management, but trades at a steep valuation discount because CEO Kelcy Warren has shown a willingness to exploit his investors if he can (see Will Energy Transfer Act with Integrity?).

Prior to their simplification, the significant insider ownership at Plains may have led the GP to place too much leverage at the MLP level, leading to unsustainable dividends at the MLP before consolidation. In some cases, management teams whose interests weren’t aligned with investors under the old GP-MLP model have not yet altered their behavior to acknowledge the alignment of interests that simplification brings.

The addition of PE investors makes creating value for all stockholders a higher priority.  This requires disciplined capital allocation.  While Rich Kinder, Kelcy Warren, and the insiders at Plains still own significant stakes, they are holdovers from a different model of wealth creation.  Under their old structure, the GP directed the MLP’s activities while receiving preferential economics through Incentive Distribution Rights (IDRs).  Growing the MLP increased IDRs even if it diluted returns for MLP investors.

Kinder’s simplification was almost five years ago, and yet their continued use of DCF and EBITDA in evaluating their Enhanced Oil Recovery (EOR) business betrays that they still haven’t updated their thinking. Depleting assets such as these reduce the return earned by equity holders, while the GP and his IDRs are largely immune. As a simplified, single entity KMI still hasn’t shown that it understands its long term ROIC for the EOR business.

Plains is using flawed math for capital allocation decisions.  And, Kelcy may be back on the hunt for acquisitions to continue building his pipeline empire at ET.

The energy sector has been roundly criticized for overinvesting. Investors who favor companies where the rigor of PE analysis is applied to future projects could find that better capital allocation decisions follow. In our portfolios, we are biased towards companies likely to choose their investments wisely.

We invest in CEQP, ENCL, EPD,  ET, LNG, KMI, TGE, PAA via Plains GP Holdings.

SL Advisors is the sub-advisor to the Catalyst MLP & Infrastructure Fund.  To learn more about the Fund,  please click here.

SL Advisors is also the advisor to an ETF (USAIETF.com).

Oil and Gas Growth Powered by U.S.

Last year the U.S. set a new world record for annual increase in production of oil and gas by any country in history. The recently-released BP Statistical Review of World Energy 2019 highlights these and many other useful facts.

U.S. Sets Record in Oil Production
U.S. sets World Record in Natural Gas Production

Total U.S. energy consumption rose by 3.5% last year, the fastest in 30 years and a surprising jump following a decade of no growth. Growth in population and GDP have normally been offset by lower energy intensity and improving efficiency. But periods of extreme weather (both excessive heat and cold) boosted energy demand, as well increased use of ethane for America’s resurgent petrochemicals industry.

US Annual Energy Consumption

The U.S. was one fifth of the 2018 increase in global energy consumption, with China and India together representing half. Climate change and CO2 emissions figured prominently in the report. Developed countries desire lower emissions and emerging countries higher living standards. China consumes 42% more energy than the U.S., a gap that will grow in the decades ahead. The resolution of these conflicting goals dominates the outcome.

Per Capita Oil Consumption US v China and India

So it’s worth noting that the Asia-Pacific region energy consumption is more than double North America’s, and half of this comes from coal. The difference in coal volumes is by a factor of 8X. China alone consumes 6X as much coal as the U.S. But to illustrate unmet energy demand, China and India’s per capita consumption of crude oil is only 10% that of the U.S.

World Energy Consumption by Fuel

Until we confront these twin issues, little else that’s done to reduce emissions will have much impact.

Global carbon emissions grew by 600 million tons, or around 2%, the fastest for many years. This is the equivalent of increasing the global passenger car fleet by a third. Last week, India’s Adani Mining won Australian regulatory approval to begin developing one of the world’s largest untapped coalmines. Its critics contend that this project alone will eventually add 700 million tons of CO2 emissions, exceeding last year’s global increase from all sources. This is where India’s desire for more energy to raise living standards manifests itself. New York’s environmental extremists opposing a new natural gas pipeline might consider where the real problem lies.

Increased use of renewables alone will not solve the issues of climate change. BP notes that simply maintaining carbon emissions from the power sector at 2015 levels would have required growth in renewables generation at more than double the actual rate. The additional output is equal to all of the U.S. and China’s 2018 energy output from renewables.

US Natural Gas and Renewables Consumption

Natural gas provided 43% of the additional power the world consumed, more than twice that provided by renewables. For all the excitement about increasing use of solar and wind, their share rose by 1.4%. 84.7% of the world’s energy came from fossil fuels in 2018, versus 85.1% in 2017. As Bill Gates and others have pointed out, R&D should be directed towards making the 85% less carbon intensive, rather than trying to replace what obviously works.

Netpower is developing the ability to generate electricity from natural gas with no emissions, which would represent a significant breakthrough if successful.

It’s still possible to find writers warning of a production collapse because of shale’s chronic unprofitability.  An article on Seeking Alpha (see Here’s Why Oil Stocks Are Priced For Armageddon) or Bethany Mclean’s Saudi America: The Truth About Fracking and How It’s Changing the World both reflect a simplistic view. Exxon Mobil (XOM), now the biggest driller in the Permian, clearly finds it profitable. Anadarko had two suitors for its Permian assets. Volumes keep growing, in defiance of some writers’ claims to better understand the economics.

BP’s report showed that the 2.2 Million Barrels per Day (MMB/D) of increased global crude oil production came from the U.S., a point echoed in Plains All American’s (PAA) Investor Day.

The path to lower global emissions requires far more use of nuclear power, far less coal use in China and India, and more R&D into using existing energy sources more efficiently. Otherwise, investments in seawalls and flood mitigation will be a safer bet.

We are invested in PAA, via Plains GP Holdings.

SL Advisors is the sub-advisor to the Catalyst MLP & Infrastructure Fund.  To learn more about the Fund,  please click here.

SL Advisors is also the advisor to an ETF (USAIETF.com).

Plain Talk, Fuzzy Math

Plains All American (PAA) held their investor day last week. Continued growth in output from the Permian in West Texas is driving new pipeline construction, for which PAA is at the forefront. Limited pipeline capacity has hurt economics for some drillers that have resorted to trucks to move their crude, which is far more expensive.

PAA’s Supply and Logistics (S&L) business thrives on infrastructure constraints, since it allows them to exploit basis differentials using spare capacity on their pipeline network. From 2014-17 S&L EBITDA collapsed by 90%, as spare capacity came online. It has since rebounded to $450MM, around two thirds of its 2014 peak.

One analyst asked about the impact of new pipelines, both on the S&L business (where PAA expects to see EBITDA drop 50% next year) as well as on existing pipelines which face possible cannibalization of demand:

“You’re creating your own weather when you think of the S&L impact…there’s a lot of moving parts here…Loss of marketing, loss of basin flows, loss of potentially some spot barrels on Bridgetex”

Executives wouldn’t be drawn into discussing the impact in more detail, which was a pity because an investor day is supposed to offer an opportunity to dig more deeply into a company’s business. The response was:

“The guidance for this year fully reflects our views of how that impact is…we’ll give guidance later in the year for 2020… I don’t think we’re going to specifically work towards guidance during this meeting today, that’s not the intent.”

This interaction captures the conundrum facing investors. The Shale Revolution’s dramatic increase in oil and gas production isn’t yet profiting midstream infrastructure investors. One reason is fear that the industry will overbuild, pressuring pipeline tariffs and leading to projects that fail to cover their cost of capital.

PAA laudably tried to demonstrate financial discipline with two slides illustrating how they think about their cost of capital versus their return on invested capital. For any company, the spread between these two is the main source of profits.

Cost of Capital PAA

So it was disappointing to see errors and omissions. Distributable Cash Flow (DCF) as a cost of equity was based simply on the current DCF yield without adding anticipated long term growth, though investors are told to expect such growth of 10% this year and presumably further growth beyond.

Return on Invested Capital PAA

The problem in using current EBITDA as the basis for assessing projects is that it doesn’t reflect the long term return on assets with years of useful life and fluctuating tariffs. It omits corporate overhead, maintenance, cost for potential delays and cost overruns. Most investors calculate the net present value of cashflows from a proposed investment, discounted using a rate appropriate to the risk.

How PAA Should Calculate its Cost of Capital

PAA isn’t calculating their cost of equity properly. More correct would be to use the dividend yield plus long term expected growth rate. The growth rate is derived from the portion of retained earnings not paid out (i.e.  1 minus the payout ratio) times the return on equity, which PAA shows has historically been 19.5%.

Although they’re targeting 130-150% coverage of their distribution, it’s currently 2X. Raising the dividend such that it was 150% covered would give them a yield of 8.5% (versus 6.37% currently). 150% coverage  equals a 67% payout ratio. 1 minus the payout ratio, or 33%, times their 19.5% ROE, implies a 6.5% growth rate, which should be added to the projected 8.5% dividend yield.

So PAA’s own figures and assumptions suggest their cost of equity is really around 15%, not the 12.1% they presented. PAA’s Weighted Average Cost of Capital (WACC), using their desired 55/45 equity/debt split and with a 4.25% interest rate on their debt, is almost 10.2%, 1.6% higher than they presented.

Since they seek an investment return of 3-5% above their WACC, any project needs a return of 13-15%. Riskier projects need an even higher return than this. The Alpha Crude Connector acquisition failed to meet this hurdle.

This minimum return on new projects is further illustrated through their desired leverage of 3-3.5X Debt:EBITDA. Assuming they continue to finance their investments with 45% debt, anything new must have an EBITDA multiple (i.e. cost of investment divided by EBITDA) of no higher than 7X. 3.25 leverage (the midpoint of their 3-3.5 range) divided by 45% debt share of finance is 7.2, which equates to around 14% (1 divided by 7.2), the midpoint of the required return we calculated based on their WACC.

The 55/45 ratio between equity and debt could be unsustainable if EBITDA falls. For example, a manageable 4X Debt:EBITDA leverage ratio would become an unsustainable 8X if EBITDA later dropped by half. Building in the possibility of lower tariffs in the future means debt should be less than 45% of the capital, which raises the WACC since equity is more expensive.

It’s also why you want to own strategic assets that don’t face huge drop-offs in revenues after initial contracts expire.

The flaw in PAA’s math can be illustrated by showing that they’d be willing to raise capital at today’s cost to buy an identical enterprise to their own, with identical EBITDA. Using their own cost of capital and 2019 EBITDA, they’d value this twin at over $33BN. Adjusting for debt, the twin’s equity would be worth $24BN, compared with PAA’s current market cap of only $17BN. Their math allows that PAA could pay up to a 39% premium to buy a business identical to what they own before the acquisition would no longer be accretive.

This is why investors are usually unenthusiastic when management teams announce another growth project. PAA, like most of its peers, should be more willing to repurchase shares.

The stock’s poor performance over the past five years is due to poor capital allocation decisions, probably driven by faulty logic such as described here.

No sell-side analyst pointed this out, but the shareholders who have lived it understand the flaws in PAA’ internal investment process.

Meanwhile, PAA is a cheap stock, trading at just 8X cash flows that are growing, assuming management is more prudent with investors’ money than over the past five years. The industry’s fortunes will turn on correctly calculating the spread between cost of, versus the return on, invested capital.

We are invested in PAA, via Plains GP Holdings.

SL Advisors is the sub-advisor to the Catalyst MLP & Infrastructure Fund.  To learn more about the Fund,  please click here.

SL Advisors is also the advisor to an ETF (USAIETF.com).

Miscounting America’s Crude

Wednesday’s report on crude oil stocks from the Energy Information Administration (EIA) showed a sharp jump in storage of 1 million barrels per day (MMB/D). Given the already fragile mood around tariffs slowing GDP growth, crude oil prices predictably slumped.

Interestingly though, over the past year the “Adjustment”, or fudge factor which is used to make the numbers add up, has grown substantially.

In simple terms, the EIA counts production, exports, imports, change in storage and refinery usage. This should pick up every barrel of oil moving through the U.S. It must frustrate the EIA’s number crunchers that the figures never foot, so they use a balancing item which used to be called “Unaccounted for Crude Oil”, nowadays simply the Adjustment. Since June 2018, the Adjustment has almost tripled.

Over the past year, crude oil used by U.S. refineries has been stable. Because much of America’s increased production is light crude from the Permian ill-suited to domestic refineries, imports have also remained unchanged. Higher exports have absorbed most of the increase in output.

The Adjustment exists solely because one of the other figures is wrong. So we’re refining more, exporting more, importing less, storing less or producing more than reported. Of these five different items, some should be easier to measure than others. The refinery figure seems unlikely to be far wrong; refineries must know what they’re using and there are 135 refineries in the U.S. from which to gather information.

Similarly, imports must surely be correct since the government licenses imports, and counting exports would also seem reasonably straightforward – the number of points of exports (cross-border pipelines and crude-loading export facilities) are known and not that numerous.

However, in reviewing the EIA’s methodology for calculating exports, they rely heavily on data from the U.S. Customs Border Protection (CBP) as well as figures from Statistics Canada (since exports to Canada don’t require a U.S. export license). The EIA runs the data through estimation models that they believe improve its accuracy. In some cases they’re using monthly data, even though their report is weekly.

There are many types of petroleum product beyond crude oil, including finished motor gasoline, kerosene, distillate and residual fuel oil among others. And the granting of an export license need not coincide with the physical shipment of the product. So it’s a more complex task than you might suppose.

Storage would also seem straightforward. Storage terminals are hard to miss. So the 967 thousand barrels per day (MB/D) build in storage ought to be reliable. Since the prior week saw a 41 MB/D decrease in storage, crude traders inferred softening demand.

But storage has its own complexity, since crude oil sitting on a tanker awaiting unloading is, in effect, floating storage. A possibility suggested by one sell-side firm is that floating storage was drawn down sharply. This presumes that several million barrels of crude was in tankers bobbing within U.S. territorial waters, already counted as imported but not yet unloaded. If true, this would mean the apparent jump in onshore storage was offset by a drawdown in floating storage, making the report far less bearish.

While this could explain the sudden, one-time shift in the storage figure, the Adjustment was the same last week, which undercuts the logic behind this explanation.

This brings us back to production, currently estimated at 12.4 MMB/D. Of the line items in the EIA’s report, it seems to us that this one is most plausibly the source of the growing Adjustment. There are around a million wells in the U.S. producing crude oil, from some decades old dribbling out a few barrels a day to new Permian wells producing 10 MB/D or more. We think it’s likely that the EIA is somehow undercounting crude oil output.

Flaring of associated natural gas in the Permian recently hit 661 million cubic feet per day (MMCF/D), up sharply from the previous high late last year of 450 MMCF/D. This reflects growing crude oil production. The continued shortage of take away infrastructure in the region to handle the natural gas that is extracted with the crude oil is why there’s more flaring.

Nobody really knows why the EIA’s weekly report includes an error term that is growing embarrassingly large. Robert Merriam, director of the office of petroleum and biofuels statistics at the EIA, admitted, “There’s something more systematic going on that our surveys aren’t capturing. We have some theories on what that may be and we’re trying to look into it.”

Undercounting crude oil production seems the most likely explanation. If so, this would reinforce a couple of important themes:

1) The U.S. continues to gain market share in world energy markets

2) Growing volumes even with moderate pricing defy those who argue that much of our shale activity is unprofitable

Oil and gas production continue to surprise to the upside, which can only be good for midstream energy infrastructure.

SL Advisors is the sub-advisor to the Catalyst MLP & Infrastructure Fund.  To learn more about the Fund,  please click here.

SL Advisors is also the advisor to an ETF (USAIETF.com).

Pipelines Moving Up and Left: More Return With Less Risk

The Capital Asset Pricing Model (CAPM) is a widely accepted theoretical framework for valuing securities. An important feature is the Efficient Frontier. This reflects the concept that, although there’s an almost infinite number of portfolios that an investor can hold (think of all the individual stocks and bonds out there), a small number of these portfolios offer a combination of return and risk that’s better than most.

Efficient Frontier

For example, if two portfolios had the same risk, the one with the higher return would be preferable. We can always figure out with hindsight what was the efficient portfolio — identifying the right one going forward is more difficult.

CAPM is a useful theoretical framework but has its shortcomings. One of the biggest is the idea that more risky investments deliver a higher return. It seems intuitively self-evident, but there’s plenty of research to show it’s not true. Beta, a measure of how risky a stock is compared to the market (which has a Beta of 1.0), suggests that high beta stocks (Beta > 1.0) should deliver higher returns than the market. Otherwise, investors wouldn’t own high beta stocks because they wouldn’t be getting sufficiently compensated for the increased risk.

The real world often fails to conform to neat algebraic solutions, and it turns out that low beta stocks do better. They don’t move as much and offer less excitement. Low Beta stocks receive less coverage on CNBC, since traders want movement. But they are Aesop’s tortoise, reaching the finish line ahead of their more energetic competition.

This weakness in CAPM is called the Low Beta Anomaly, and for those interested in learning more you can read Why the Tortoise Beats the Hare.

Returning to the Efficient Frontier, although we can’t be certain what investments provide the most CAPM efficiency, we can make informed assumptions about whether they’re becoming more or less attractive within this framework. Investors complain about heightened volatility in midstream, and likely assume more of the same in assessing the sector. For many, Energy infrastructure sits well within the Efficient Frontier boundary, making it unattractive.

Investor Perspective of Pipeline Sector

But Energy Infrastructure, as we wrote last week (see Pipeline Stocks Get That Warm Feeling Again), is becoming less volatile, especially when compared with broad energy as represented by the S&P Energy ETF (XLE). On the Efficient Frontier chart, this is moving it to the left, meaning it’s becoming less risky.

Returns are also improving, as defined by Free Cash Flow (FCF) generation. We wrote about this a few weeks ago (see The Coming Pipeline Cash Gusher). The members of the broad-based American Energy Independence Index generated just $1BN in FCF last year, which is an inconsequential return on around $540BN in market cap. However, a combination of lower spending on new projects (lower growth capex) plus improving cash flow from existing assets (higher Distributable Cash Flow, DCF) is set to boost sector FCF significantly over the next three years. By 2021 the $45BN in FCF we estimate would produce a FCF yield of over 8%, higher than the S&P500.

Pipeline Sector Free Cash Flow

Making volatility forecasts is an imprecise task, and most investors will be satisfied with using historical data. This shows decreasing volatility, or risk. But it’s certainly possible to make return forecasts and they don’t need to have any relationship with recent history. Rising FCF should persuade investors that their return assumption for the sector can be revised up.

In the context of CAPM, higher return with less risk mean that the sector is shifting up and to the left, making it more attractive. The Efficient Frontier is a theoretical concept, and investments selected from along that line can all be judged efficient, with the different combination of return and risk reflecting investor preference.

Improving Return and Risk

As this virtuous combination of rising return with falling volatility becomes apparent, we think some investors will conclude that midstream energy infrastructure lies beyond the Efficient Frontier. This should attract inflows from investors who use this type of framework to assess opportunities.

When CAPM provides a buy signal, the much-sought generalist investor will have finally turned to pipelines. Over the next couple of years, the sector should benefit from this development.

SL Advisors is the sub-advisor to the Catalyst MLP & Infrastructure Fund.  To learn more about the Fund,  please click here.

SL Advisors is also the advisor to an ETF (USAIETF.com).

Pipeline Stocks Get That Warm Feeling Again

A common concern of both existing and potential investors in energy infrastructure is the relatively high volatility of recent years. Many recall the “toll-model” of pipelines that was the basis of their appeal prior to 2014. As we have often written, the Shale Revolution broke the MLP model, as companies with very high payout ratios and hitherto minimal growth projects set about adding infrastructure. Oil in North Dakota, natural gas in Pennsylvania and increasing volumes of crude in west Texas required new investments (see It’s the Distributions, Stupid). The income-seeking investors originally attracted by high yields wound up in growth businesses that prioritized reducing leverage and funding projects over maintaining distributions.

Our theory is that this one-time alienation of the core investor base was highly disruptive and led to a period of heightened volatility. The shift in MLP business model from income generating to growth coincided with a sharp downturn in the energy sector. Investors worried about the profitability of upstream exploration and production companies showed similar concern over midstream. Even though EBITDA grew and leverage fell for pipeline stocks during this period, the sector moved with the energy sector.

There are signs that this period of heightened volatility is coming to a close. When energy markets bottomed in early 2016, the average daily percentage move of the Alerian MLP index reached almost 2.0X that of the S&P Energy Sector ETF (XLE). In late 2017 the ratio was briefly even higher. Since then, this relationship has improved dramatically in favor of these toll-like business models, falling by more than half and approaching the range that prevailed 7+ years ago.

This shift is even more dramatic than it seems, because the Alerian MLP index has been steadily losing components, rendering it less diversified and therefore more prone to sharp moves than it would otherwise be. Investors continue to exit mutual funds and ETFs tied to MLPs, as shown by the steady drop in shares outstanding for the Alerian MLP ETF.

Pipelines Beating SP500

Nonetheless, relative performance for the sector more broadly defined to include corporations has held up very well. The American Energy Independence Index (80% corporations and 20% MLPs, more reflective of the sector’s market cap of 2/3rds corporations) has retained its solid lead over the S&P500 this year, and is substantially ahead of XLE, especially following last week’s market weakness.

Midstream beating XLE

A plausible explanation is that, although retail investors are shunning MLP-only funds, institutional buyers are beginning to commit capital to pipeline corporations. Converting from MLPs to corporations was driven by a desire for a broader, more stable investor base. Although there are fewer MLPs remaining, they include conservatively run companies such as Enterprise Products Partners (EPD) and Magellan Midstream (MMP). There are some good MLPs to own.  However, some investors are starting to conclude that MLPs are too small a subset to command a sector allocation, and they’re more appropriate within a diversified portfolio that includes corporations.

Retail Investors selling MLPs

The relative volatility of midstream infrastructure is reverting back to the lower levels that prevailed before the Shale Revolution triggered the need for large infrastructure investments. Moreover, free cash flow is set to jump over the next three years (see The Coming Pipeline Cash Gusher). This will continue to attract generalist investors interested in attractively valued stocks with declining volatility.

The pipeline sector is showing good momentum to continue its outperformance, driven by institutional buyers gradually replacing the retail holders of narrow, MLP-only funds.

We are invested in EPD and MMP. We are short AMLP.

SL Advisors is the sub-advisor to the Catalyst MLP & Infrastructure Fund.  To learn more about the Fund,  please click here.

SL Advisors is also the advisor to an ETF (USAIETF.com).

Better Odds With Pipelines

The mood at the 2019 Midstream Energy Infrastructure Conference was noticeably more positive than in the past couple of years. Perhaps relocating from Orlando to Las Vegas helped. Hope for positive financial outcomes is in the local DNA, and pipeline investors could smugly remind themselves that the best odds were not in the casino. Attendance seemed to be higher than in the recent past, and demand for one-on-one meetings with management teams (the point of attending for many, including ourselves) was reportedly up sharply.

Investors keep pounding away on planned growth capex, and companies are generally responding by guiding to less spending this year and next while still emphasizing their slate of attractive opportunities. We checked our assumptions underlying The Coming Pipeline Cash Gusher in several meetings and still see a substantial jump in industry free cash flow over the next three years.


Henry & Simon MEIC


New pipelines are becoming harder to build. New York recently blocked a natural gas pipeline planned by Williams Companies (WMB) because of environmental concerns, although WMB plans to reapply. Canada is becoming a more difficult and expensive place in which to build (other than in oil-rich Alberta). Enbridge (ENB) went as far as to say they wouldn’t attempt a new, greenfield crude oil pipeline in Canada. They regard the permitting process as capricious, hijacked by a small minority of vocal environmental activists that don’t reflect the public interest.

Impeding new construction simply increases the value of the existing asset base. It also means that today’s dominant firms will maintain their market positions in the future; this is not an industry where a disruptive start-up has realistic prospects.

It also creates an unusual alignment of interests between anti-fossil fuel, environmental activists and investors who are clamoring for a greater return of cash to owners. Both are opposed to new spending, albeit for different reasons.

Tellurian (TELL) is developing a Liquified Natural Gas (LNG) export complex. Their unusual financing model involves raising equity capital from customers. In this way they share some of the project’s upside and create key long term partnerships. They see growing Permian crude production leading to a huge jump in associated natural gas output, creating the need for an additional 20 Billion Cubic Feet per day (BCF/D) of LNG export capacity.

Incidentally, in a panel on LNG, Andy Orekar of Gaslog Partners said that if all the world’s shipping converted to LNG (because of the impending IMO 2020 standards on maritime emissions) it would consume more than all of the current trade in LNG. Currently, gas-powered ships are limited to LNG tankers that consume a small portion of their cargo for power. It’s a theoretical point since the industry is installing sulfur scrubbers and switching to cleaner crude oil-based fuels, but an interesting one nonetheless.

Today the U.S. exports around 4 BCF/D. Because natural gas is an inevitable byproduct of crude production in the Permian, TELL expects the economics of oil to drive more gas output which will need to be sent somewhere. They believe the Permian may produce as much as 30BCF/D, creating a need for almost all proposed LNG projects. Increased domestic consumption and pipeline exports to Mexico will only soak up so much, with seaborne LNG exports being critical to avoid constraints on crude production. Flaring unwanted natural gas is limited, and the larger companies that are now dominating Permian activity are especially likely to avoid the negative publicity associated with such obvious waste.

Private equity has developed into an alternative source of financing for midstream infrastructure since public market valuations essentially render equity financing prohibitive. This highlights the contrast between how public and private markets view the sector. Although private funds can compete effectively for projects, it’s also made exits harder, leading to longer holding periods that can reduce returns. The traditional arbitrage, in which public buyers acquire assets at higher multiples than paid by private equity, is currently being reversed. This reflects the continued public market wariness of midstream energy infrastructure, and highlights currently attractive valuations.

Most firms now have a set of policies covering ESG (Environmental, Social and Governance). This is regarded by some as a requirement for drawing in generalist investor interest. One company noted that European investors were more likely to use ESG as a screening metric, and reported that they had seen a notable pick up in interest from non-traditional investors in response to their adopting ESG policies. Mentioning Energy Transfer (ET) in the context of ESG invariably draws a chuckle (see Why Energy Transfer Can’t Get Respect)

A meeting with Enterprise Products Partners (EPD) produced some useful insights. They regard U.S. crude oil export infrastructure as still catching up with volumes. Building a facility to accommodate Very Large Crude Carriers (VLCC) is an important objective for them. The application to build this terminal was 13,000 pages and weighed 100 lbs.

EPD also sees very strong Chinese demand for U.S. exports of ethane and propane, with the current trade dispute not regarded as a long-term problem.

The “War on Plastics” led them to point out the slide shown below, which highlights how much of global plastics pollution can be traced back to ineffective disposal among some Asian countries.

Poor Plastics Disposal

Overall, the news was good and growing free cash flows are beginning to draw interest from a wider pool of investors. We left with reinforced conviction that valuations are excessively pessimistic. Strong returns lie ahead.

We are invested in ENB, EPD, ET, TELL and WMB.

SL Advisors is the sub-advisor to the Catalyst MLP & Infrastructure Fund.  To learn more about the Fund,  please click here.

SL Advisors is also the advisor to an ETF (USAIETF.com).

Why Energy Transfer Can’t Get Respect

If Energy Transfer (ET) was a private company contemplating an IPO, the 15% Distributable Cash Flow (DCF) yield indicated by their underwriters would draw laughter. The bankers would be ushered out of the conference room.

Yet that is the lowly valuation investors assign to perhaps the least loved pipeline company in a sector that investors find lukewarm at best. ET is priced far below where they’d take the company public, if it wasn’t already a listed company. CEO Kelcy Warren and his team continue to execute and beat expectations on earnings. Last August Kelcy joked that, “A monkey could make money in this business right now.” (see Running Pipelines is Easy). Inviting critics to find fault, they nonetheless still deliver good results. Unlike most MLPs, ET (legacy Energy Transfer Equity) has never cut its distribution.

The market prefers style over substance, for on the soft issues of PR and Investor Relations (IR), ET’s record is sharply at odds with their financial performance. From their ill-fated pursuit of Williams Companies (WMB), the dubious dilution of shareholders with management-only convertible preferreds (see Will Energy Transfer Act with Integrity?) and the optically poor dispute over the Dakota Access Pipeline, this is a company that cares little about its image. Pennsylvania’s huge natural gas boom has been helped by a generally pro-energy regulatory regime, but ET has even managed to make enemies there.

ET’s PR staff must get combat pay.

Warren Buffett recently explained how Berkshire’s (BRK) $10BN investment in Occidental (OXY) was negotiated with no contingencies (save that they acquire Anadarko). Buffett needs to trust his investment partners. On this basis, ET is an implausible candidate for a BRK investment.

On the 1Q19 earnings call, Kelcy commented on how he is listening to the market. He’s been, “…trying to understand what the market would like to see us to do. What causes our unit price to perform better, in other words.”

Our advice would be start behaving like the kind of company that would interest Buffett.

ET’s 1Q19 earnings included EBITDA of $2.8BN and distribution coverage was ample at 2.07X. This exceeded expectations, although the 8% yield suggests some fear a cut. They guided to $10.7BN in 2019 adjusted EBITDA. ET’s stock had weakened over the prior month, so expectations weren’t high. Nonetheless, on the day following earnings ET slumped 1.3%, twice the drop in the broad-based American Energy Independence Index.

Kelcy Warren might compare ET with another big pipeline company, Plains All American (PAGP). If ET has delivered consistently good operating results distorted by a bad corporate image, PAGP has done the opposite. Their distribution relied unwisely on a volatile business segment (Supply and Logistics, S&L) whose arbitrage margins virtually disappeared from 2013 to 2017. The narrative accompanying results changed from “it’s skill not luck” to “forces out of our control”. The 2016 sweetheart “One and Done” preferred deal to shore up finances was anything but.

DCF Yield Growth ET vs PAGP

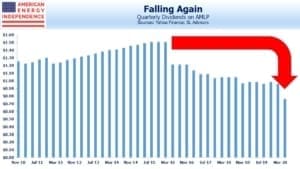
PAGP’s 2017 acquisition of the Alpha Crude Connector was ill-advised, and along with other growth projects exposed too-high leverage when margins fell. As a result, investors in PAGP subsequently suffered two distribution cuts.  Back in 2010 when the shale oil boom was in its infancy, PAA yield seeking investors received $3.75/unit in distributions.  In 2018 they received just $1.20 per unit.  It’s why income-seeking investors often feel so betrayed by MLPs. Nonetheless, the market has not punished PAGP’s stock as much as ET’s, although it’s also cheap. Former CEO Greg Armstrong’s folksy style created sufficient goodwill among investors that PAGP has a distribution yield a third less than ET’s. Their DCF and free cash flow are growing, but not as fast as at ET.

PAGP’s 1Q19 results were also good, buoyed by their resurgent S&L segment. Their 10% DCF yield reflects some concern that past mistakes will be repeated, and arbitrage margins are hard to forecast because they rely on shortages of pipeline capacity which can be fleeting. But their IR people at least have a more positive corporate image against which to tell their story.

As if to punctuate attractive valuations, on Friday Buckeye (BPL) was acquired at a 32% premium to its recent average price. BPL’s foray into international storage terminals led to chronic underperformance in recent years that even the buyout hasn’t rectified. They have mismanaged themselves into a takeover, at pricing substantially higher than ET’s.

Both ET and PAGP are cheap. They each possess skills that would benefit the other. ET’s rebarbative management style contrasts with their efficient execution and strategic foresight, an area where PAGP needs to regain credibility after mis-steps in recent years. ET walks the walk, and PAGP talks the talk.

If each company can improve its weaknesses, they’ll continue to draw investors to an extremely cheap sector offering substantial growth.

We are invested in BRK, ET, PAGP, and WMB.

SL Advisors is the sub-advisor to the Catalyst MLP & Infrastructure Fund.  To learn more about the Fund,  please click here.

SL Advisors is also the advisor to an ETF (USAIETF.com).

Buffett Finds Value in Shale

Warren Buffett likes the Permian Basin. This was clear from Berkshire’s (BRK) proposed $10BN preferred investment in Occidental (OXY) should they buy Anadarko (APC). Berkshire’s annual shareholder meeting was followed as usual with a Becky Quick interview on CNBC.

Buffet OXY Deal

The 8% dividend on the preferred OXY will issue to finance their acquisition could be inducement enough for BRK to commit $10BN. When Becky commented on this Buffett responded “It isn’t great to have an 8% preferred if there isn’t any oil there.   It’s a bet on oil prices over the long term more than anything else and it’s also a bet on the fact that the Permian basin is what’s it’s cracked up to be. … You have to have a view on oil over time and Charlie and I have got some views on that.”

This led Becky to ask why BRK didn’t use some of its cash hoard to buy Anardarko for $35BN, to which Buffett replied “Well, that might have happened if Anadarko had come to us.”  Buffett was quick to clarify that he wouldn’t jump in to a bidding war with someone who has come to them for financing. Buffett wants more supplicants for similar deals. But it does show that they see value in the Permian Basin, OXY and APC.

The competition between Chevron (CVX) and OXY to buy APC provides further confirmation of a bullish production outlook among those with the best information. CVX and OXY were the two biggest producers in the Permian last year, each pumping over 300 thousand barrels per day (MB/D). APC did 100 MB/D. They know the region. Rystad Energy believes that a CVX/APC combination would reach almost 1.4 Million Barrels per Day (MMB/D) in output by 2025. A match-up of OXY/APC would get to 0.9 MMB/D. Permian volumes are growing fast, and the influx of additional capital makes this even more likely. Midstream energy infrastructure is a sure winner.

As always, Buffett had some wonderful folksy quips. In discussing his 60-year partnership with Charlie Munger, he noted that they’d often disagreed but never had an argument. Munger sometimes concludes such debates with, “You’ll agree with me soon, because you’re smart and I’m right.”

Try using that at home with your significant other. Let us know how it goes – we’ll publish any credible stories.

Buffett and Munger aren’t overly concerned about the latest ratcheting up of trade tensions. They believe both sides will benefit from concluding a deal. We agree that trade tensions are unlikely to be a factor entering 2020 when Trump is running for re-election (see The Trump Put).  One easy way to reduce the trade deficit is for China to increase it’s purchases of raw materials from the U.S. This could include huge amounts of LNG, natural gas liquids such as propane, and light crude oil that they desperately want and need.

If the dispute is drawn out, planned Chinese purchases of U.S. Liquified Natural Gas (LNG) are at risk. But LNG is fungible, and U.S. exports could displace trade to other Asian countries whose shipments would in turn head to China. Cheniere Energy (ticker: LNG) and Chinese energy firm Sinopec are planning a 20 year LNG deal once the trade negotiations are concluded.

While a full-blown trade war that severely damages global GDP growth can have a meaningful impact on oil demand and oil prices, a resolution should boost demand and clear the way for Chinese buyers to sign long-term contracts from U.S oil and gas exporters.

Moreover, the U.S. just dispatched aircraft carrier Abraham Lincoln to the Persian Gulf so as to, “send a clear and unmistakable message to the Iranian regime…” The Shale Revolution has improved America’s ability to press our interests since we are so much less dependent on Middle East oil. Trump is not one to shy away from a fight. We won’t forecast how events with Iran will play out – but domestic energy investments are one of the safer places to be if there is conflict with Iran.

With historically low valuations for the energy sector, record oil & gas production, and solid growth prospects, the weekend’s news is showing energy to be one of the most overlooked areas in the market.

We are long BRK.

SL Advisors is the sub-advisor to the Catalyst MLP & Infrastructure Fund.  To learn more about the Fund,  please click here.

SL Advisors is also the advisor to an ETF (USAIETF.com).

image_pdfimage_print