Crude’s Drop Makes Higher Prices Likely

Crude oil just set a record of sorts, by falling for eleven consecutive days (as of this morning). Fears that sanctions on Iran would cause a supply shortage, leading to a price spike, now seem unfounded. Not long ago, many were surprised at the high degree of compliance. France’s energy giant Total’s CEO said it was, “…impossible for big energy firms to work in Iran.”

The big stick America wields on this issue is access to the U.S. financial system. If a company is deemed to be trading with Iran, it can find itself unable to conduct financial transactions in US$. This is a surprisingly powerful tool, since a substantial amount of trade is conducted in our currency. Total concluded that being unable to transact in US$ would be too disruptive to contemplate.

In the summer, the U.S. appeared to be taking an uncompromising approach, and Iranian crude exports were forecast to fall from 2.5 Million Barrels per Day (MMB/D) to as little as 1 MMB/D. Crude oil futures correspondingly rose. Pressure was put on Saudi Arabia to provide offsetting increased output, as the Administration fretted over high gasoline prices before the midterms.

More recently, waivers granted by the White House to eight importers of Iranian crude have calmed fears of a price spike. China and India, who are both continuing to buy Iranian crude as a result, imported over 1 MMB/D last year. As a result, the January ’19 Brent Crude month futures contract has slid from $86 in early October back to $68 where it was in the Spring. For now, it seems that the Iranian sanctions aren’t that significant.

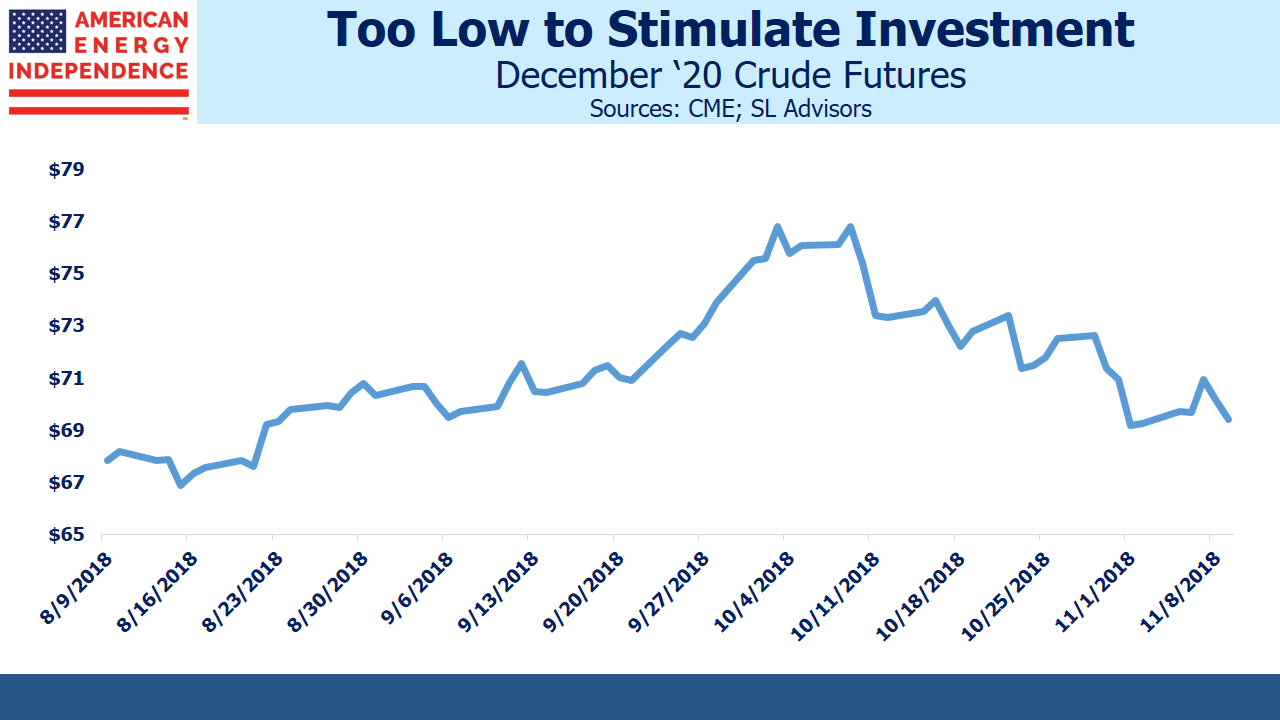
Crude Oil Futures Dec '20

Saudi Arabia probably expected the U.S. to be stricter in following through on sanctions, and was surprised by the waivers. They have just reduced December exports by 0.5 MMB/D. The Saudis surely expected to be selling oil at higher prices a month ago. Recent data shows that Saudi exports to the U.S. have been falling, and floating storage (i.e. crude on tankers in transit) is the lowest in four years. Some believe that Saudi Arabia is unable to sustain production above 10.6 MMB/D or so without damaging their oilfields.

Although the gyrations of the front month futures contract have commanded attention, crude prices farther out have moved much less. The December ’20 futures contract fell from $76 to $70. Fear of sanctions had caused backwardation (near contracts higher than farther out ones), and this has corrected.

Upstream Spending for Big Oil

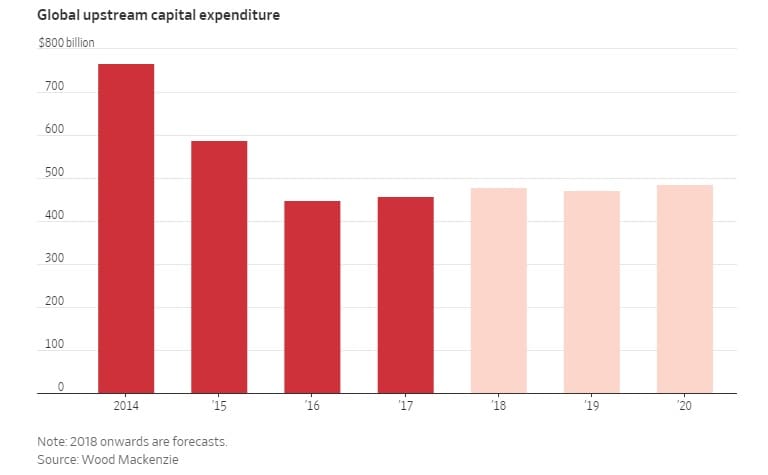
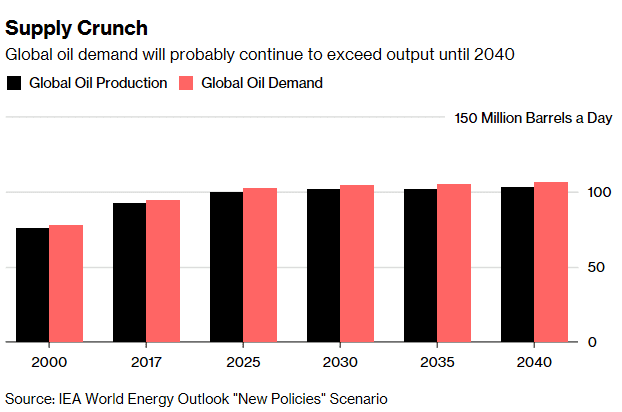
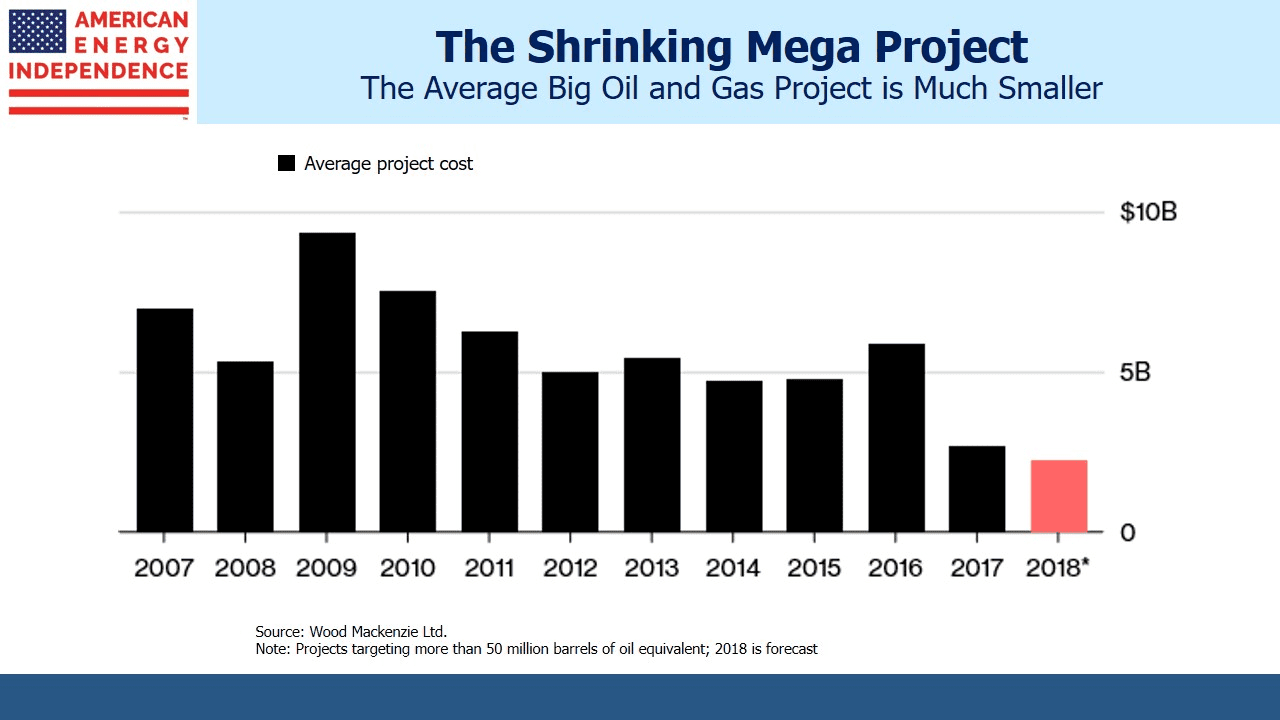
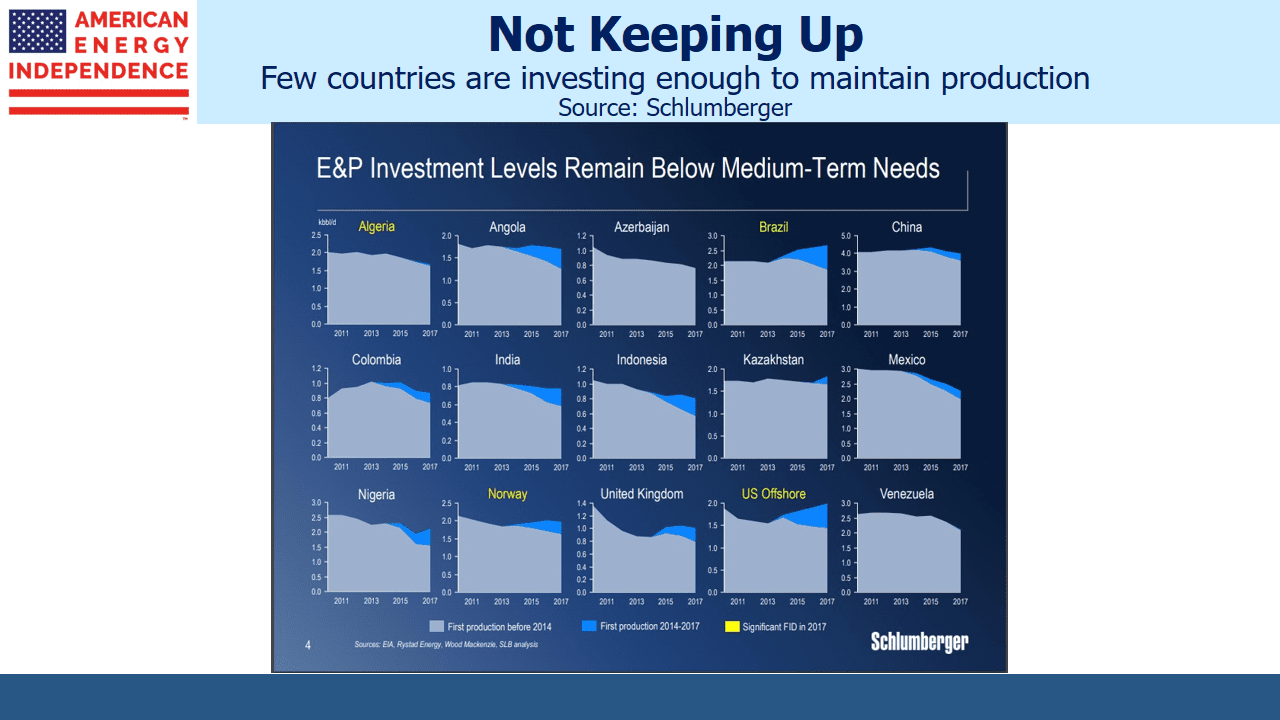
Investments in conventional oil production are driven by the price of crude expected to prevail over the life of the project. The front month gets the attention, but it doesn’t drive the decision. Because new oil projects take several years to reach production, many in the industry continue to worry that falling investment levels will eventually cause higher prices. The International Energy Agency (IEA) recently released their World Energy Outlook. They warn of a looming supply crunch, with the world seemingly too reliant on increasing U.S. production to meet demand growth. Investment spending collapsed during the 2015-16 industry downturn, and remains more than one third lower than it was in 2014. Discoveries of conventional hydrocarbon reserves are correspondingly down.

Crude oil along the futures curve is still at levels that have drawn repeated warnings of future supply shortfalls. Moreover, Saudi Arabia is finding that the U.S. administration ultimately wants low prices, with Trump recently tweeting, “Hopefully, Saudi Arabia and OPEC will not be cutting oil production. Oil prices should be much lower based on supply!” Expecting Americans to tolerate higher pump prices so as to pressure Iran is an unlikely strategy for any president to pursue. But Saudi Arabia needs higher prices to balance their budget. These conflicting goals will continue to impact oil prices.

Low investment means higher prices are likely over the intermediate term; perhaps sooner, based on the drop in Saudi exports.

What the Midterms Mean for Stocks

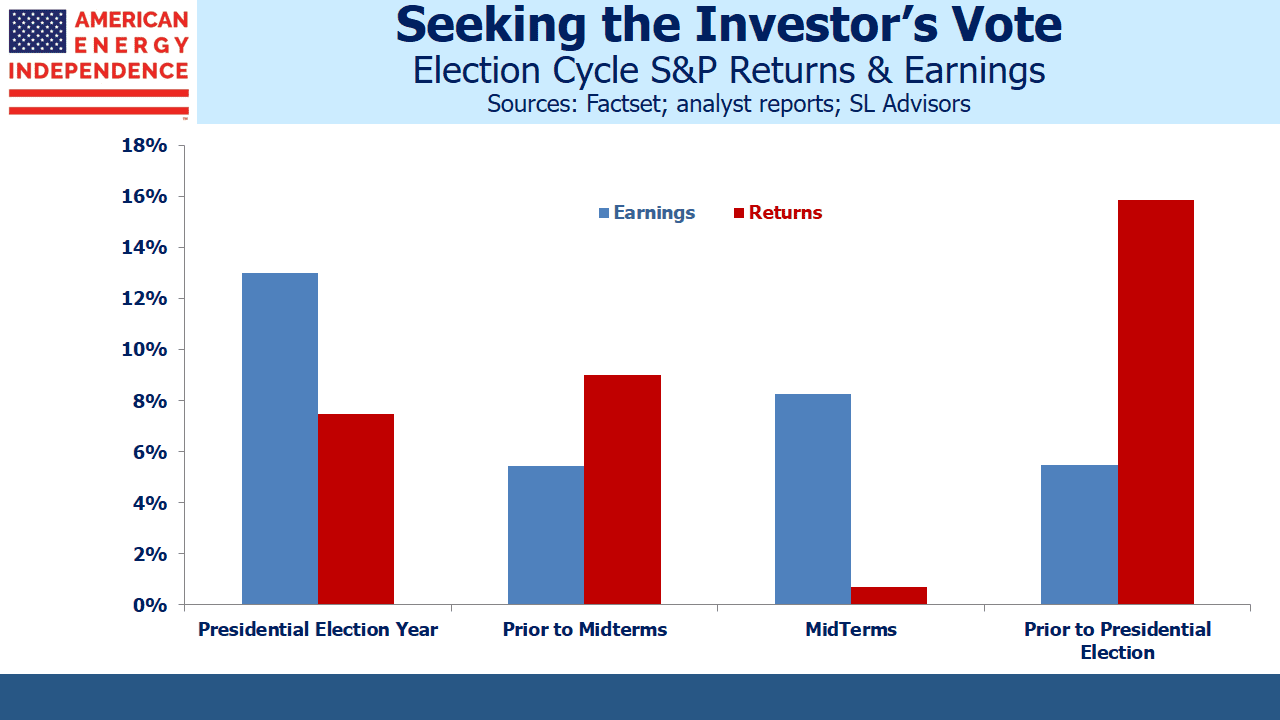
Equity returns are historically strongest in the year following the midterms. Conspiracy theorists will judge that politicians in office focus on market-friendly moves that aren’t limited to government spending in order to stay in power. Whatever the reason, the effect is quite remarkable. Since 1960, the S&P500 has risen by 15.9% on average in the third year of a Presidential cycle, almost twice the 8% average across all years.

Election Cycle S&P Returns and Earnings

When equity returns in the year following midterms have been poor, the White House has often changed hands. In 2015 stocks were flat and Trump’s victory followed. Eight years earlier, modest losses in 2007 provided Obama with his opening, and the 2008 financial crisis confirmed the pattern.

Many people feel that a divided government is preferable since it requires both parties to compromise in order to achieve anything. With the House of Representatives shifting to Democrat control, legislation will require support from both parties. However, the numbers don’t support this, with such returns in the year following midterms 1% lower if one of the two houses of Congress is controlled by the party not in the White House.

So history suggests 2019 should be a good year for stocks.

But much about the Trump presidency is different. Looking at S&P500 earnings by year presents a different picture. Earnings growth in a midterm year is 8.3%, approximately the average. Earnings tend to be strongest in Presidential election years. That’s partly what drives good returns following midterms, because investors look ahead to stronger profits the following year.

S&P Returns and Earnings under Trump

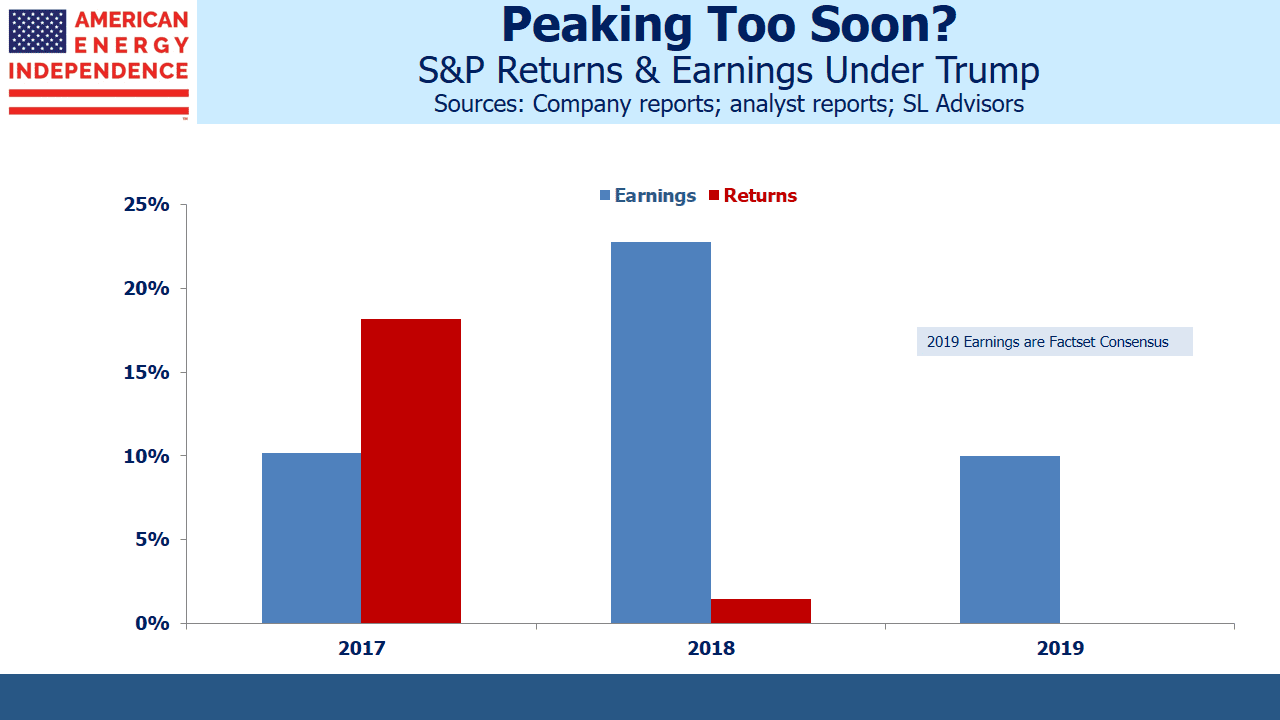
2018 S&P earnings are coming in at +22%, fueled by the cut in corporate taxes. That’s likely to be the strongest profits year of the four year cycle, and it’s come two years ahead of what typically happens.

So it’s possible the election cycle effect may have already peaked; last year’s 18% rise in the S&P500 was looking ahead to this year’s jump in earnings. The new administration completed tax reform following its first full year in office.

Factset is forecasting 10% earnings growth for 2019 – still higher than the 50+ year average albeit down sharply from this year.

In addition to the votes for elective office, many states included ballot questions for voters to consider.

Colorado included a proposal (Proposition 112) that would mandate a 2,500 foot setback for oil and gas development (including gathering & processing plants and pipelines) from “vulnerable” areas (residential neighborhoods, schools, parks, sports fields, general public open space, lakes, rivers, creeks, intermittent streams or any vulnerable area). Analysis showed that it would essentially ban oil & gas development on non-federal lands. It was a keenly contested issue, with one side claiming that energy extraction is endangering air quality while the other noted the jobs at risk from such a move.

Voters rejected it 57 to 43, which is a relief for Colorado’s oil and gas industry. Strikingly, Weld County, home to most of Colorado’s drilling, voted against 112 by a resounding 75/25. If the people closest to it are so strongly in favor of its continuation, it’s not clear why a statewide ballot was the right approach.

Proposition 112 was in any case likely unconstitutional, since leaseholders losing their property (i.e. their foregone right to drill for oil and gas in affected areas) would have sued the government for compensation. It illustrates why direct democracy is such a clumsy instrument, since “yes/no” public questions aren’t easily translated into coherent legislation. Politicians in the state had previously failed to act, which created enough public support to get the question on the ballot.

Even though Proposition 112 lost, it reflects the ambivalence of many regions over the development of America’s hydrocarbon reserves.  The energy sector spent money on commercials highlighting the threat to the local economy, given 112’s stifling provisions. Colorado’s legislature is now likely to take up the issue and pass legislation intended to address the concerns of the proposals supporters. It means existing energy infrastructure already in service has a little more value, given increasing challenges to development.

New York Times Forecasts the 2014-16 Energy Sector Collapse

One official says the shale industry may be “set up for failure.” “It is quite likely that many of these companies will go bankrupt,” a senior adviser to the Energy Information Administration administrator predicts.

This is from the New York Times. However, it wasn’t part of The Next Financial Crisis Lurks Underground, Bethany McLean’s recent article promoting her upcoming book. In 2011, the NY Times ran a series of articles by Ian Urbina that was critical of many aspects of the Shale Revolution, including the shaky finances underlying its companies. In the ensuing seven years, U.S. crude oil production has doubled and we’ve moved from planning imports of Liquified Natural Gas (LNG) to exporting it. Behind the Veneer, Doubt on Future of Natural Gas, Urbina’s June 2011 article predicting failure, was spectacularly wrong.

Hydraulic fracturing (‘fracking”) is how shale extraction of oil and gas has revolutionized America’s energy security. It has its opponents, whose worries include water contamination and earthquakes. We are environmentalists too – it is everyone’s environment. We like the reduced CO2 emissions made possible by natural gas substituting for coal-burning power plants (see Guess Who’s Most Effective at Combating Global Warming). Robust regulation is in everyone’s interests, so that the Shale Revolution’s benefits can continue to outweigh its costs. The NY Times has a long history of criticizing fracking.

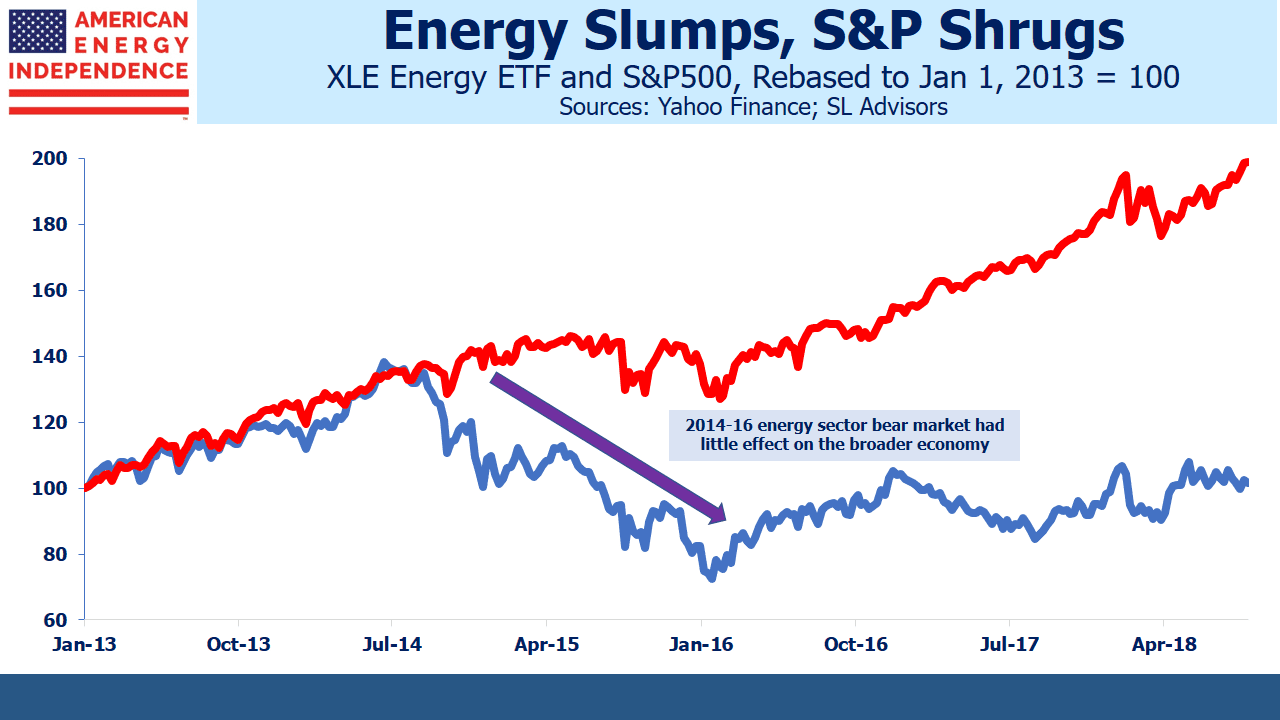
Ms. McLean’s essay was appropriately in the Op-Ed section, which acknowledges that it’s not intended as a news article. Her previous book, The Smartest Guys in the Room, recounted the collapse of Enron and was published six years after Skilling and Co’s demise. Similarly, Ms. McLean is forecasting a crisis in the energy sector after it’s already occurred. From June 2014 to January 2016, the Energy SPDR ETF (XLE) dropped 44%. An over-leveraged industry was hit by falling crude oil, which plummeted from $110 per barrel to $26. Investors complained that cash was being excessively reinvested in new wells, leaving too little available to be returned to investors via dividends or share buybacks.

Moreover, the energy sector endured its collapse pretty much alone. The rest of the U.S. economy shrugged. There was no recession, and the broader stock market averages meandered mostly sideways. During this period, Alerian’s MLP Index fell by 58.2%, more than during the 2008 financial crisis. It’s hard to imagine a more adverse scenario for America’s energy sector, and it suffered in isolation with no collateral damage. Bethany McLean may have missed all this; she might just as well breathlessly announce that the Philadelphia Eagles are about to win their first Super Bowl (note to non-U.S. readers – the Eagles did this in February).

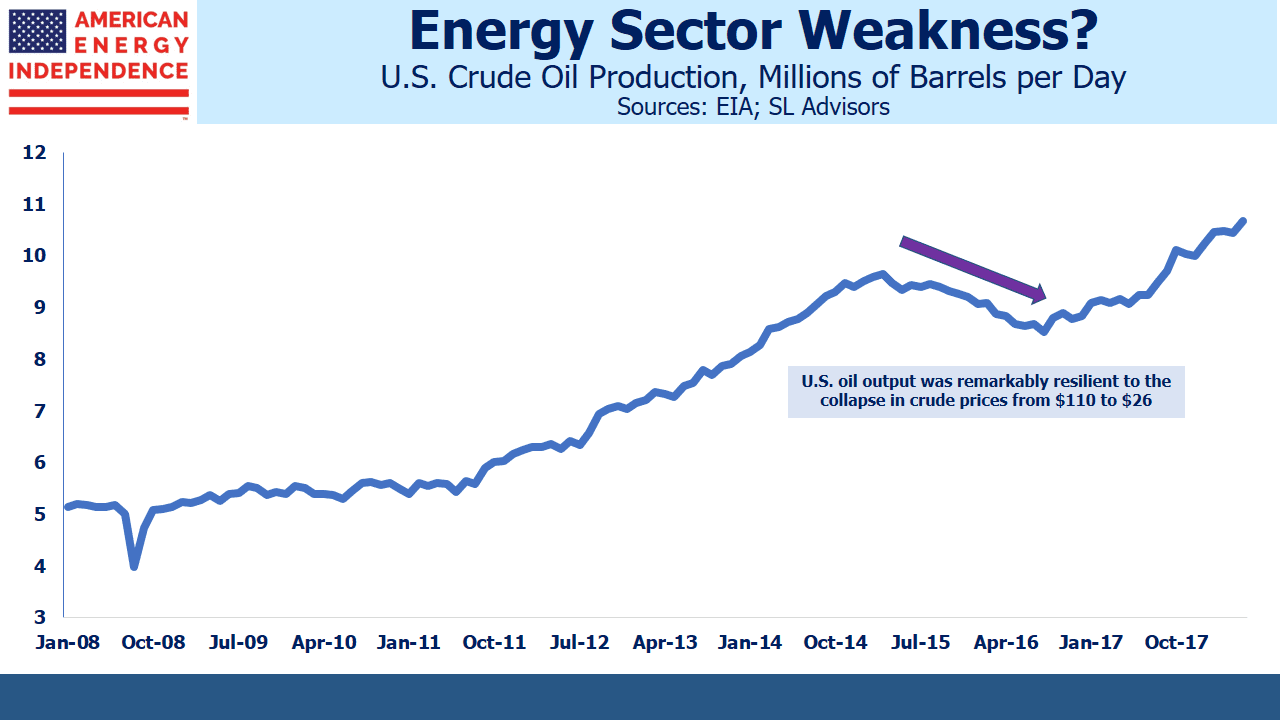
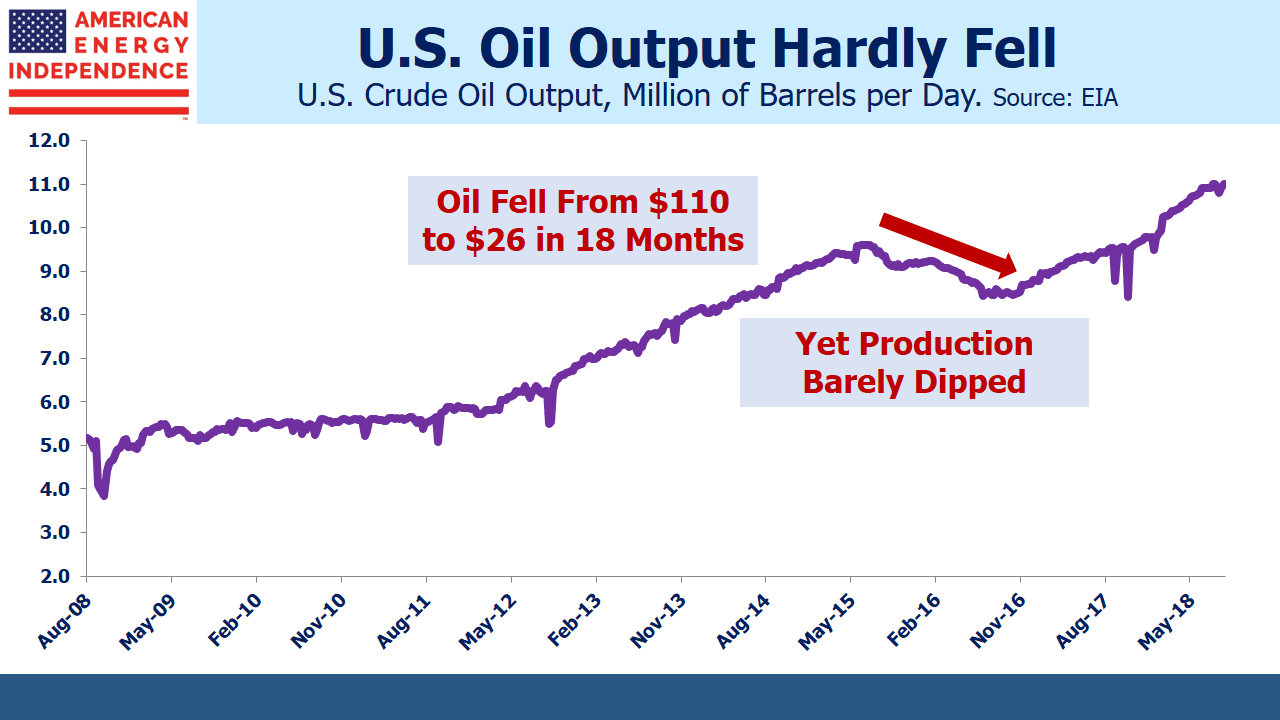
Since then, leverage has been falling, profitability rising and investors have been receiving more cash (see U.S. Oil Producers Continue To Chart Path to Long-Term Growth). Ms. McLean pays this little heed. She notes that, “By mid-2016 American oil production had declined by nearly a million barrels a day” although this relatively modest drop testifies to the resilience of the business, not its frailty. To assert that, “…the Federal Reserve is responsible for the fracking boom…” because of low interest rates sounds as if the Fed’s bond buying program included the debt issued by energy companies. Fed policies have increased risk appetites for equity of all kinds, increasing the competition for capital from non-energy sectors.

The energy sector is slowly recovering from its 2016 low, and the first question of potential investors is about a repeat of $26 oil. Free cash flow yields on the American Energy Independence Index are 9.5%, almost twice the S&P500 (see Reliable Yields Are the Best). This doesn’t look like a bubble.

The fast decline rate of shale wells that Ms. McLean criticizes are in fact a substantial risk mitigant. It’s how shale drillers earn back their invested capital more quickly, and is why the world’s biggest oil companies are substantially investing in North America (see The Short Cycle Advantage of Shale).

Because The Next Financial Crisis wasn’t published in 2015, it’s of little actionable use. However, the upcoming book from which it’s drawn (Saudi America; The Truth About Fracking and How It’s Changing the World) may well be interesting. It’ll probably be more useful as history than as a forecast.

Could Oil “Super-Spike” Above $150?

In July, Pierre Andurand’s hedge fund, Andurand Capital, lost 15% on bullish crude oil bets. Oil was weak in July, but is up 21% in 2018. Notwithstanding this correct outlook, his fund is -5% for the year. Few things are more frustrating for a manager or his clients than losing money on a profitable call.

Putting aside the challenges of hedge funds, which we have amply covered in years past (see The Hedge Fund Mirage; The Illusion of Big Money and Why It’s Too Good To Be True), a bullish outlook on crude enjoys solid fundamental support. Andurand once ran a hedge fund that profited mightily during the 2008 financial crisis, only to fold following large losses in 2011. More recently though, his calls on oil have been better than most (see Fund Chief Survives Oil’s Swings), including correctly forecasting the 2014-15 collapse. Few of his peers successfully navigated this period. Reportedly, Andurand sees a multi-year bull market that could eventually reach $300 a barrel. Bernstein Research, whose deep investment analysis is widely respected, has warned of a “super-spike” above $150 a barrel.

Both supply and demand for crude oil are relatively inelastic over periods of a few quarters or so. Global transportation relies heavily on refined petroleum products. Higher prices discourage some trips, but for the most part miles driven and flown don’t dip much with higher prices. Bringing on new supply typically takes several years. So over the short run, small shifts in demand or supply disproportionately move prices.

Global crude oil demand rose by 1.7MMB/D (Million Barrels per Day) last year and in 2016, up from the ten year average of 1.1MMB/D. Demand growth is driven by developing countries, especially China and India. But far more important to a balanced market is depletion of existing oilfields, something that receives little attention. Output from most plays peaks early in their operational life, when underground pressure is most effective at pushing oil to the surface. Thereafter, production steadily declines. Estimates vary, but most analysts agree that 3-5MMB/D is the global drop in annual production from existing plays, absent any new recovery-enhancing investments.

This year the Energy Information Administration (EIA) estimates that the world will consume 100 MMB/D, a record. In order to offset depletion plus demand growth, new supply of around 5-7MMB/D is required.

Following the oil price crash 2014-15, energy companies adopted greater financial discipline and planned for lower oil prices in the future. The combination of higher required returns and lower assumed prices has had a chilling effect on investment. The U.S. Shale Revolution is at least partly responsible. U.S. output barely dipped during the 2014-15 collapse.  Although low prices weren’t sustained for long, the episode caused subsequent projects to be evaluated against the possibility of a repeat. For example, in April BP’s chairman said they were, “still working with the assumption that this is going to be a world with an abundance of oil.”

Major oil projects have always had risk to input costs and demand over the ensuing decade or longer. But today, those risks are even harder to quantify. It’s generally believed that oil demand will peak within a generation, yet growth in recent years has been as high as ever. Although Electric Vehicles (EVs) have many enthusiasts, sales growth of gasoline-chugging cars easily outpaces EVs in China, which is why crude demand keeps growing.

Improved financial discipline, wariness of a second Shale-induced price collapse and uncertainty around EV growth are three significant factors impeding investments in new supply. Taken together, these three factors have created greater risk aversion than the industry has shown in the past.

Consequently, capital invested in conventional projects remains low and projects are more modest. Companies are favoring “short-cycle”, whose smaller up-front investment consequently gets repaid more quickly with greater IRR certainty.

However, there just aren’t enough short-cycle projects available, which is causing concern within the industry. Schlumberger CEO Paal Kibsgaard warned that, “It is, therefore, becoming increasingly likely that the industry will face growing supply challenges over the coming year and a significant increase in global exploration and production investment will be required to minimize the impending deficit.” Bernstein Research concurred, “Investors currently calling on exploration and production companies to return more cash to shareholders at the expense of funding future production may also come to regret their strategy.”

There are many examples of countries underinvesting in maintaining existing levels of production.

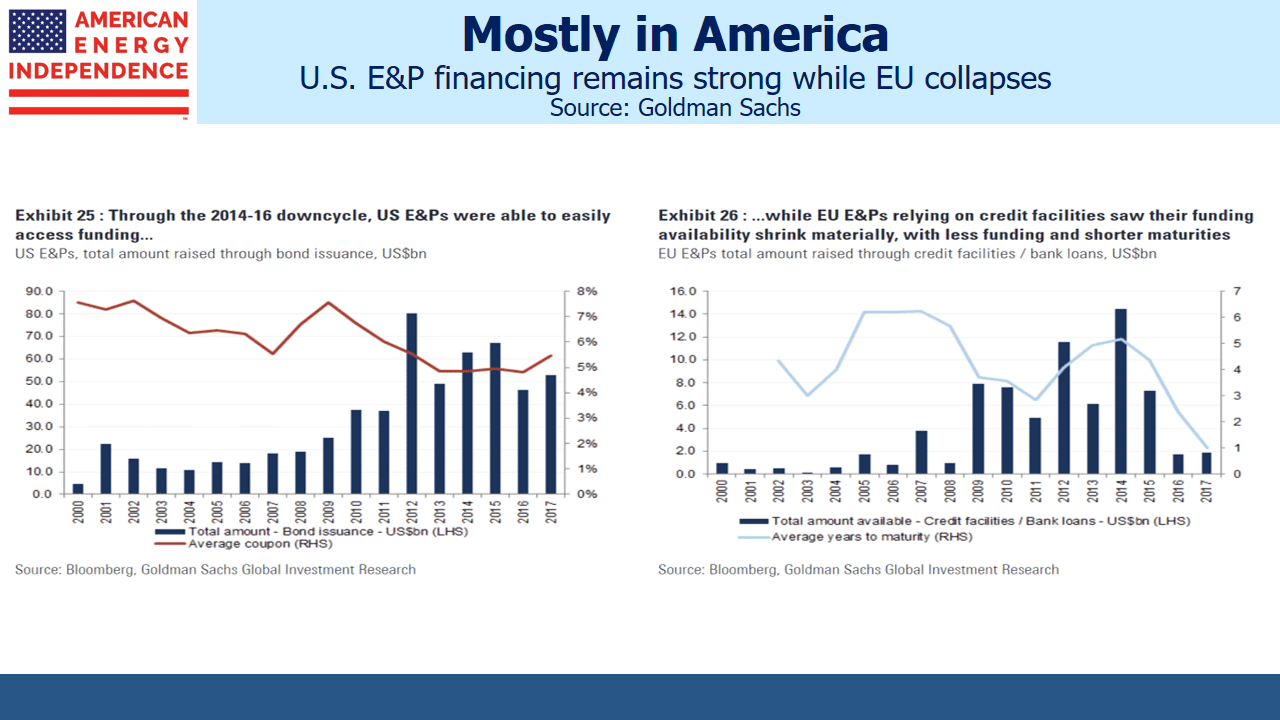
Because less risky, short-cycle projects are mostly shale plays in the U.S., a stark difference in financing has opened up between America and Europe. EU bank financing for Exploration and Production, always far smaller than in the U.S., has collapsed in recent years.

Although Saudi Arabia is believed capable of producing as much as 12.5 MMB/D for a few months, many observers feel this is unsustainable. U.S. shale is one of the few areas of growth. Permian output in west Texas is expected to average 3.3 MMB/D this year and 3.9MMB/D in 2019. Yet, infrastructure constraints recently caused the EIA to trim its outlook for U.S. 2019 production from 11.8MMB/D to 11.7 MMB/D, up 1 MMB/D versus this year. Concern that U.S. production could lead to another price drop is limiting new global investment – yet, the most optimistic forecasts of U.S. output show that significant additional new supply beyond US shale is going to be needed.

A determination to avoid past mistakes of unprofitable oversupply is likely to lead to the opposite; an undersupplied oil market. The question is, how high must crude go to satisfy the new profitability goals and other concerns of the integrated oil companies. Many fear that $100 a barrel will be insufficient – and the market is poorly positioned for any supply disruptions, perhaps caused by Iran or some other geopolitical shock. Another Shale-induced price collapse, falling demand due to EVs and new-found financial discipline represent long-term concerns inhibiting the search for new discoveries.

Oil needs to be high enough to compensate for all three risks. Since today’s prices aren’t high enough to stimulate enough new investment, oil should move higher. This will encourage conventional investment, but will also test the limits of the U.S Shale Revolution in growing output.  To bet on increasing oil and gas volumes in the U.S., invest in the network of infrastructure that moves these supplies to market.

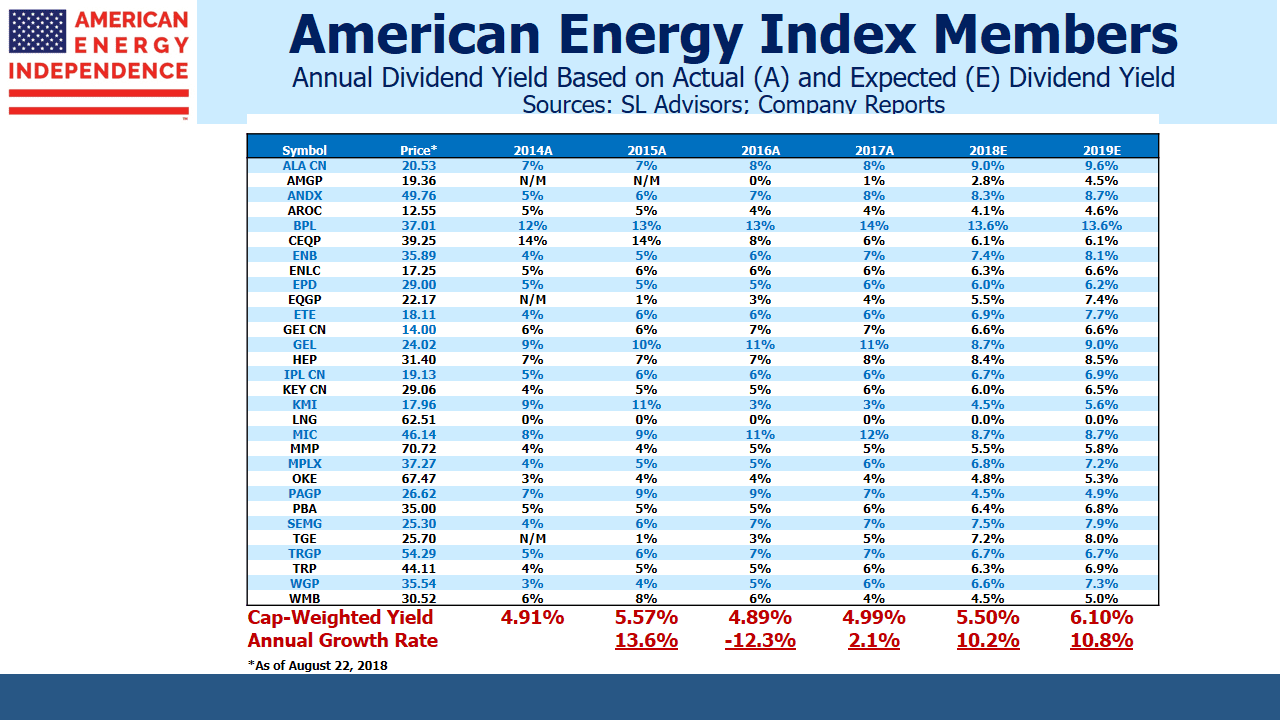
The components of the American Energy Independence Index are growing dividends at 10% per annum.

Guess Who’s Most Effective at Combating Global Warming

When it comes to limiting CO2 emissions, the results are not always what you’d expect.

Debates about climate change often draw zealots on both sides. The common accusatory opener, “Do you believe in global warming?” betrays the binary, almost religious argument between those who think we’re wrecking the planet and those who don’t. Pragmatism is rare on either side.

The science of climate change is complex, and we won’t attempt to assess man’s contribution to global warming. For a thought-provoking view of the issue, read Alex Epstein’s “The Moral Case for Fossil Fuels”. In one section, Epstein comments on U.S. Secretary of State John Kerry’s 2014 plea for Indonesia to cut carbon emissions to fight global warming. From 2006-16 Indonesia’s CO2 emissions grew by 3.1% annually, the Asian average. It’s no coincidence that in 2016 Indonesian life expectancy reached 69, up by 17 years over the previous half century.

As in much of the developing world, Indonesians are living longer. This is because increased energy use supports cleaner water and food, improved hygiene and better medical care, staples of developed country life. Because fossil-free energy is not yet price-competitive, its adoption implies using less energy. This in turn means shorter life expectancy for Indonesians and citizens of other developing countries. If the science around man-made climate change was unequivocal, it would imply acceptance of briefer lives today so that subsequent generations may live longer. But the science isn’t clear, and a warmer planet may be manageable. Moreover, climate prediction models have consistently overestimated actual warming. Epstein’s book offers a rare, stimulating perspective and seizes the moral high ground assumed by the anti-fossil fuel crowd. He defines improving human life as the standard against which to test climate change policies. By this measure, greater energy use has been a success.

The BP Statistical Review of World Energy 2018 reports on emissions of carbon dioxide, a greenhouse gas. It has some surprising facts.

Global CO2 emissions continue to rise, reaching 33.4 Billion tons last year. Yet, many will be startled to learn that America easily leads the world in reducing CO2 output. Our reduction of 794 million tons over the past decade is a 1.4% annual rate of decrease. The Shale Revolution has certainly helped, although U.S. CO2 emissions peaked in 2005, long before Shale started to have its positive impact. Improved energy efficiency is one reason. More recently, cheap natural gas, combined with regulatory constraints on coal-burning utilities, have favorably altered the mix of hydrocarbons burned to produce electricity. Regrettably, the Trump Administration’s weakening of Obama-era coal constraints will moderate this positive trend.

Another surprise is that the UK managed the second biggest ten-year drop in CO2 emissions, at 170 million tons. This represents a 3.5% annual reduction rate, easily the best for any big country. Lower coal use is similarly the cause here, caused by exhaustion of commercially accessible coal reserves.

The 2015 Paris climate accord represents the world’s desire to combat climate change through reduced greenhouse gas emissions. The U.S. withdrew from it last year. The Climate Action Network, an EU-sponsored NGO, finds that only five EU members are even halfway on track to meeting their obligations under the Paris accord. Some of the most vocal Paris supporters have been the biggest laggards.

For example, Germany has famously managed to be a leader in renewables while failing to lead in emission reductions. Heavy dependence on solar and wind requires baseload electricity generation for when it’s not sunny or windy. In Germany, that’s primarily coal (see It’s Not Easy Being Green). As an unfortunate consequence, Germany plans to increase its reliance on Russian natural gas via the Nord Stream 2 project.

Spain, Italy and Greece have all managed very credible 2-3% annual reductions in CO2 emissions. However, this is due to chronically weak economies: over the past decade, Spain has managed only one quarter of GDP growth above 1% and Italy none, while Greece has been in economic purgatory. By constraining growth in southern Europe, the Euro has been environmentalists’ most effective tool.

China produces 28% of the world’s CO2 emissions, spewing out 9.2 Billion tons which is 50% more than second placed America. This is almost four times India’s emissions level, even though they have similar sized populations. However, India is catching up, with a CO2 growth rate twice China’s.

Over the past decade, China’s increased CO2 output of 2.02 Billion tons was 60% of the global increase. Clearly, lowering CO2 won’t happen without China’s help. That will require reconciling conflicting objectives: developing countries are striving to achieve developed country living standards and longevity, which requires more energy use. Developed country advocates of reduced emissions are, in effect, seeking to slow this progress.

Thoughtful advocacy of renewables recognizes the symbiosis with natural gas in providing reliable electricity generation. The purity of thought required of renewables advocates has them rejecting even those fossil fuels that can help achieve lower overall emissions. Few would enjoy a world in which the Sierra Club had achieved all its goals.

Fossil fuels aren’t equally bad. Electricity generated by burning natural gas results in around half the CO2 output as does coal, and far less damaging particulates. Some may be surprised to learn that investing in fossil fuel infrastructure can be consistent with desiring a cleaner planet. But that’s where your blogging team sits, occupying the lonely, pragmatic middle ground and advocating natural gas as an environmental solution.

Natural gas is going to be a vital part of our energy mix for decades to come. Although movements in crude oil prices drive sentiment around U.S. energy infrastructure stocks, we have over 300,000 miles of gas transmission pipeline compared with 79,000 moving crude oil. The American Energy Independence Index provides broad exposure to the U.S. energy infrastructure network. It has a long, bright future ahead of it. We expect 10% annual dividend growth this year and next on its constituents.

Facebook’s Arrogant Culture

Facebook’s (FB) business model should be well understood as extracting value from the enormous amount of data users provide about themselves. Relationships and “Likes” disclose much about an individual’s affinities. Moreover, when a FB user clicks on an ad or even just hovers her cursor over it, FB knows. This knowledge is exceptionally valuable to advertisers, since a great deal of advertising has historically relied on reaching a group you think could be interested without knowing who reacted. The oft-quoted saying that companies know half their advertising budget is wasted, just not which half, shows there’s plenty of room for improvement.

It’s a powerful proposition, and relies on users sharing all kinds of personal details in exchange for freely sharing holiday photos, or which restaurant they’re currently at “enjoying adult beverages.” But as the latest furor over Cambridge Analytica shows, FB doesn’t protect all this data as well as they might, or at least not as well as regulators might like. In some ways it betrays an arrogant culture – since users provide the data about themselves for free, they must not value it very highly. Nonetheless, FB is now Villain #1. Congressional hearings will surely follow, and perhaps even some constraints on the commercialization of free user data into a lucrative advertising platform.

We had our own experience of FB’s culture as a small advertiser. Last year we launched the American Energy Independence Index, along with an ETF that seeks to track its performance. We were intrigued at what we heard about FB’s precise marketing, which appeared to provide us with the opportunity for targeted ads at FB users whose profile suggested they’d be interested. You’d only pay for users who clicked on the ad. Furthermore, FB’s software would refine our targeted audience based on analyzing the results. So we tried it out.

Advertising of securities including ETFs is highly regulated. Such ads on FB are rare, so we knew we were on relatively new territory. But there is clear evidence that investing is moving farther online, with robo-advisers now offering algorithm-based advice to the next generation of investors. Any ad had to be fully compliant with all the applicable regulations, and unfortunately FB doesn’t allow you to design a mock-up of your ad for internal review. So the FB page was briefly posted and taken down a couple of times as we ensured it was compliant. Product endorsements are also forbidden, so out of an abundance of caution we sought no FB “friends”, to avoid any unwanted “Likes”.

The result was, we looked nothing like a typical FB user. No friends, no interaction with other users, and a page that had been posted for a couple of seconds at a time.

FB is on the lookout for Russians. Or more accurately, internet trolls and other “bots” with nefarious objectives such as influencing our election. Naturally, FB has designed software to screen for suspicious activity, and we met the algorithm’s criteria. Our account was suspended. But the ad, which was compliant with the regulations even if FB was suspicious of the user, continued.

Our corporate credit card was duly billed for activity even while our account was suspended.

And here’s the point. You cannot contact Facebook. There is no number for a customer to call if there’s a problem. Nowhere at all. There’s nobody to e-mail. You can submit an enquiry on a website, and you’ll receive an automated response. We do investment research, which is largely online, so we are not exactly neophytes at finding information on the web. And it became abundantly clear that FB’s advertising business model is designed to avoid the expense of human interaction. I even reached out to someone who works in their Advertising department. We’d played golf last Summer and he’d left me impressed with how their deep knowledge of users could benefit their advertising customers.  Surely, a golf acquaintance could help. He responded with a URL that led to another automated response.

This is why FB is an arrogant company. They don’t believe it’s necessary to provide humans to talk to their customers. This is the same culture that lost control of data provided to Cambridge Analytica. They really don’t care. Perhaps that’s why Procter and Gamble concluded that much digital advertising was a waste.

Finally, we cancelled our corporate credit card claiming unauthorized use. The ads stopped. FB never asked why.

The Shale Revolution, which is leading us to American Energy Independence, is increasingly a technology-reliant business with engineers seated in front of computer terminals remotely guiding a drill bit to within inches of its target. Happily, the energy business still finds value in humans to run things.

We are not invested, and have never been invested, in FB

ETFs and Behavioral Finance

There are over three million stock indices in the world, more than 70 times as many as actual stocks. Before learning this startling fact in the FT the other day, I might have guessed wildly at 1% of this figure, thinking it way too high.

Although the growth in Exchange Traded Funds (ETFs) is not solely responsible for this index explosion, it’s certainly helped. The move away from active management has spurred the creation of indices into which passive funds can invest. At SL Advisors we recently made our own modest contribution to this thee million number by launching the investable American Energy Independence Index, in partnership with S&P Dow Jones Indices. Launching an index involves substantial work, but unlike an IPO there’s no 6% underwriting fee. Starting an index is cheaper than floating a stock.

The Shale Revolution has transformed America’s term of trade in energy, and created substantial opportunities for the infrastructure businesses who will help us towards Energy Independence. We identified a gap in the marketplace, since none of the available investment products offer exposure to this theme. A new index and associated ETF soon followed.

So it was that your blogger was at the Inside ETFs conference in Hollywood, FL last week. It’s an enormous event with (so we were told) a record 2,300 attendees. It’s a tangible measure of the growth in ETFs, marked by the S&P500 ETF (SPY) conveniently breaching the $300BN market capitalization threshold. The global ETF industry is over $4TN.

Non-investment luminaries such as Serena Williams and General Stan McChrystal added star power to the long list of finance experts giving presentations all day. We didn’t see any of them, because Inside ETFs is an enormous networking event. It’s become the can’t miss date of the year for everybody in the industry. Meetings with business partners and clients took up much of our planned schedule before arriving, and unexpected encounters filled the rest. You really can sit in the convention center lobby and enjoy serial, chance meetings with familiar faces.

The chatter is of success; of funds that generated strong early returns and have grown quickly. Of hot areas (Smart Beta), and underserved sector (European fixed income, believe it or not). It is Behavioral Finance in action. Positive results generate confidence, attracting more assets and more confidence. The winners keep winning. There’s no care for the unloved ETF. Efficient markets proponents hold that there ought to be no serial correlation in returns – in other words, no momentum. Prices reflect all available information, so short term moves are random. In the real world, rising prices attract more buyers, and falling prices draw more selling. This is why markets exhibit momentum, because like-minded people congregate to create a positive feedback loop.

Energy infrastructure endured the inverse of this for much of last year, as the growing divergence against almost all other sectors became self-reinforcing. Until late November, when the last frustrated tax-loss sellers exited stage left, signaling the beginning of a new trend.

In other news, U.S. crude output is set to reach an all-time record in 2018. You’d think it’d be hard to turn this into bad news, unless you’re a Russian oil producer/ But apparently there is a Dark Side of America’s Rise to Oil Superpower, according to Bloomberg BusinessWeek. Problems include the high quality of shale oil, which is lighter than the heavy crudes it’s displacing from countries such as Venezuela. This means it needs less refining. Although refineries may find certain expensively built processes no longer needed, ultimately producing refined products from it is cheaper. This is bad? Sounds like fake news; maybe the Russians planted the story.

The investable American Energy Independence Index (AEITR) finished the week +2.0%. Since the November 29th low in the sector, the AEITR has rebounded 15.0%.


The Folly of Leveraged ETFs

Recent weakness in crude oil has spilled over into Master Limited Partnerships (MLPs). Some connection between the two is understandable, because part of the bull case for MLPs lies in growing shale output increasing demand for energy infrastructure. Lower oil prices dampen the enthusiasm for the idea that Exploration and Production (E&P) companies will be competing for sometimes scarce pipeline resources. For our part, we think the short-cycle nature of shale offers a substantial advantage for producers (see What Matters More, Price or Volumes?). MLP investors often feel they must have a view on crude oil before investing; because U.S. volumes are likely to rise in almost any price scenario, we think it’s less important other than over the short term perhaps. Shifting your MLP exposure around in response to oil prices is not a good long term strategy. If you have a view on oil, invest in oil.

Profiting from owning crude oil is harder than you might think. Many ignore storage costs. While these aren’t directly reflected in spot prices, they are most assuredly part of the return from owning securities linked to the price of oil. The costly “rolldown”, by which the expiring near futures contract has to be regularly rolled into the next, higher priced one simply reflects the cost of storage. The approximately $1.20 per barrel price difference between May and August crude futures is largely due to the cost of storage for three months. Think of it as the time value of money applied to crude oil.

Exchange traded products linked to oil have a checkered past, which some think shows the need for a better solution aimed at those who would like to profit from their view of oil prices. ProShares, a purveyor of leveraged ETFs, has come up with a doozy.

Oil has been pretty volatile over the last few years. From its peak in 2014 its spot price dropped by 75% through February 2016, before doubling over the next year. If your version of excitement is a commodity price that gyrates wildly, you need look no further than oil futures.

But some find this tame. Downhill skiing may appear sedentary to those who insist a true mountain experience must be preceded by a helicopter ride to find real deep powder. But the kite skier needs a three-dimensional snow experience; if it’s not dangerous it’s not worth the trouble.

The kite skier is the type of buyer attracted to the ProShares UltraPro 3x Long  Crude Oil ETF, designed for those wanting to profit from rising crude oil (Ticker: OILU). And because excitement need not be limited to a rising market, they also have a bear market version (Ticker: OILD).

These two investments share a couple of traits with kite-skiing, in that they’re dangerous and not everyone involved will have a good time. OILU is designed to move each day by three times the percentage move in the Bloomberg WTI Crude Oil Sub-index. In order to maintain this 3X exposure to daily moves, OILU will need to rebalance its holdings every day. Without going into the messy details, this introduces the insidious nature of the use of leverage, in that rebalancing will always necessitate trading in the direction of the market. Following a rise in crude, they’ll need to buy more oil futures to bring their exposure back up to 3X. When it falls, they’ll need to sell oil to bring their exposure down to 3X.

As you can appreciate, if oil goes up and down but doesn’t make much overall progress, the buy high/sell low rhythm of re-hedging will relentlessly eat away at the holder’s value.

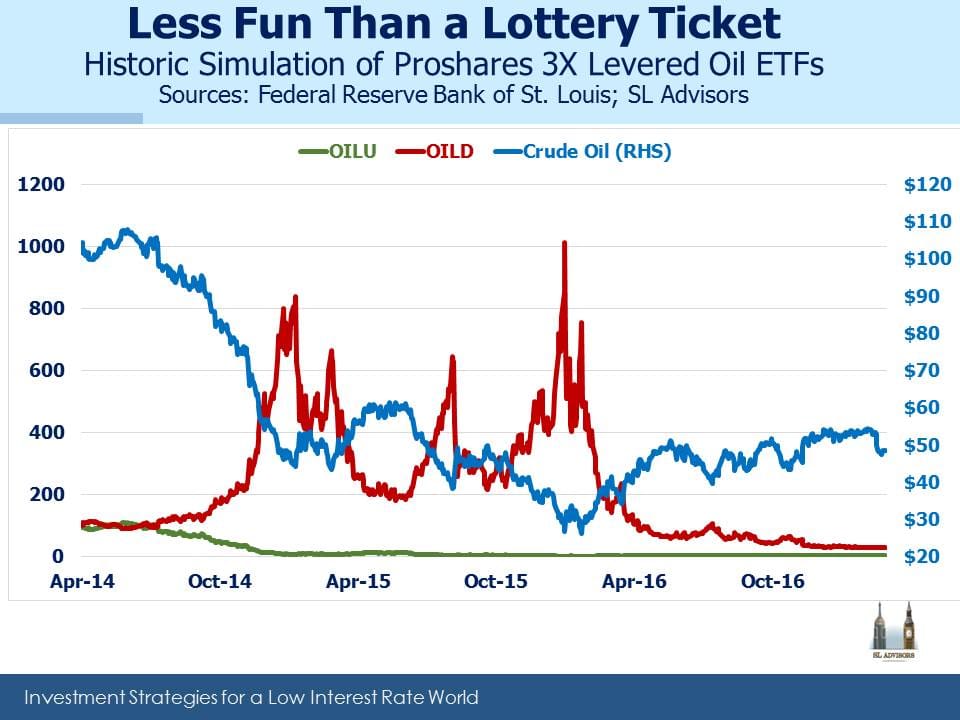
The last couple of years were interesting to say the least for oil traders. It’s possible to simulate how OILU and OILD would have performed for their holders over this period. The simulation omits fees and transactions costs, so the real results would have been a bit worse.

It might not surprise to learn that OILU lost money when oil went down. It is after all designed to make money if oil rises, so if your forecast is wrong OILU will not be your friend. Crude peaked in April 2014, and OILU would have lost 90% of its value by Christmas. Its chart looks rather like a kite skier suffering cardiac arrest. Although it’s hard to see, I can report that OILU did double in price when oil began to rally, albeit after falling 95%.

More surprising is that the bear market version, OILD, ultimately fared little better. Although crude oil is roughly half its value from three years ago, the OILD holder who made this correct forecast nonetheless saw his investment lose 70% of its value.

The point here is that 3X levered ETFs are not for those who develop an emotional attachment to their securities. The longer your holding period, the greater the certainty that you will lose money. Therefore, the optimal holding period is correspondingly as short as possible – or, if you’re not a kite skier, no holding period at all. Leverage means you care not just about the accuracy of your forecast but also about how quickly it happens. Predicting the near term path of prices as well as their ultimate resolution is how the over-confident are separated from their money. Leveraged ETFs are designed with the expectation that rebalancing will inexorably drive their value to zero.

The seductive and eye-catching part of the chart is of course the eightfold and eventually tenfold increase in the price of OILD. It was most definitely possible to make a lot of money from OILD. It required the possession of both oil price insight and exquisite timing, but for those blessed with both a healthy gain was to be had.

The problem is that, since few could have had such luck, over the three year simulation the typical holder lost money. Because ETFs don’t have a fixed share count some might quibble with this assertion; buying might have been substantial at low prices and inconsequential at high ones. It is unknowable of course, but in securities markets activity inevitably rises with prices. There would have most likely been many more buyers of these levered ETFs when they’d risen, further increasing the ranks of ultimate losers.

So you have a product that will be profitable for some but unprofitable for many and certainly for most. Should it even exist? How should we regard the supplier of something of whom the customers will for the most part suffer financially from their purchase? Is ProShares part of the efficient channeling of savings towards productive capital formation, the reason public capital markets exist? Or are they the casino owner, profiting from customers who on average will be richer by not entering?

And what’s wrong with that? Lottery ticket buyers, even the least financially sophisticated, pretty much understand that the odds are against them. In willful defiance of classical economic theory, lotteries nonetheless thrive even though the customers are selecting negative expected outcomes. They do this because the hope of winning, the dreaming of how that payoff would transform life, itself comes with positive utility. No ticket, no dream. Hope has value.

Is it therefore also true that users of ProShares products similarly comprehend the adverse odds they face and nonetheless derive utility from the hope of profit? Or is it more likely that they don’t perform the analysis above, and attribute any financial outcome to their expressed opinion rather than poor choice of product? In this case, the buyers of ProShares 3X products are less financially sophisticated than the lottery buyers they might regard with disdain. When waiting in 7-11 to buy milk while a customer ahead purchases a lottery ticket, the ProShares buyer should seek his financial advice. He might learn something. Lottery ticket buyers have more realistic expectations than ProShares buyers.

The ProShares prospectus details various dire outcomes that may result from a purchase. But of course nobody reads prospectuses, so they are legally compliant if not informative. However, shouldn’t there be a presumption that the typical holder of a ProShares product will profit if his underlying view is correct? What use is a supplier of financial products that largely destroy value? Demand certainly exists, as ProShares proudly notes on its website the $27BN in such ETFs they offer. But size of capital raised doesn’t prove intelligence by the investors, as the hedge fund industry routinely proves.

If some regard “ethical financier” as an oxymoron, it might be in part because of the values behind the offering of 3X leveraged ETFs. Just because something can be created doesn’t mean it should be.

A Few Thoughts on Long Term Energy Use

Every year Exxon Mobil publishes their outlook for global energy over the next 25 years. It’s an absorbing read for people who care about such things. Their projections may not all be right, but they have to think about such issues pretty carefully and make long term investment decision based in part on their views. In reading the latest edition: 2017 Outlook for Energy: A View to 2040, a few slides jumped out.

The U.S. Energy Information Agency (EIA) also just published their 2017 Annual Energy Outlook which includes projections out to 2040. Although these two reports are structured differently (Global versus U.S.; Exxon makes single case forecasts whereas EIA includes multiple scenarios) they are generally consistent. They agree on broad issues such as improving energy efficiency, more U.S. consumption of natural gas for electric power and industrial use, and gradually increasing crude oil production. The EIA forecasts the U.S. to be a net energy exporter within 5-10 years (depending on scenario), driven by sharply higher natural gas production displacing imports and leading to a net export position, and somewhat higher crude oil output reducing but not eliminating oil imports.

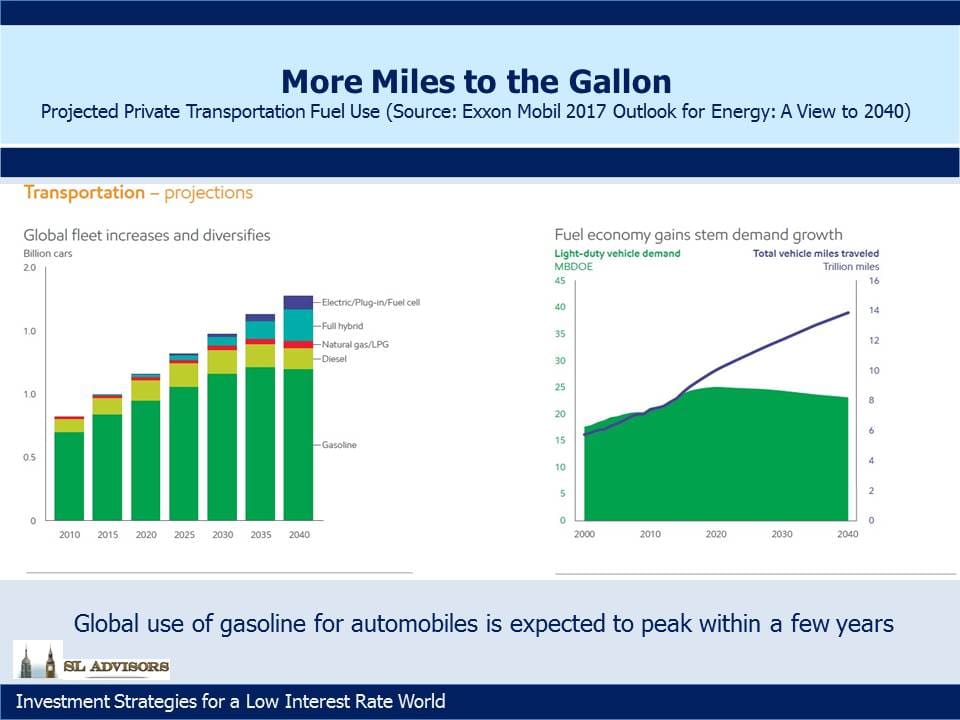
Although the world will drive more cars and many more miles thanks to demand in Asia, gasoline use for private automobiles is expected to peak within just a few years. Increasing use of electric and hybrid cars along with continued improvements in conventional engine fuel efficiency will more than offset more driving. China for example just announced plans to invest almost $400BN in renewable fuels by 2020. Although this is directed at reducing pollution from power generation, to the extent hybrid and electric cars gain market share in China they will use cleaner electricity. Based on today’s heavy reliance on coal for generating electricity, Chinese Tesla drivers have little to brag about. It’s also worth noting that the EIA in its Reference Case forecasts continued growth in U.S. exports of petroleum. This isn’t necessarily at odds with Exxon’s forecast of flat global gasoline use if U.S. refiners gain market share.

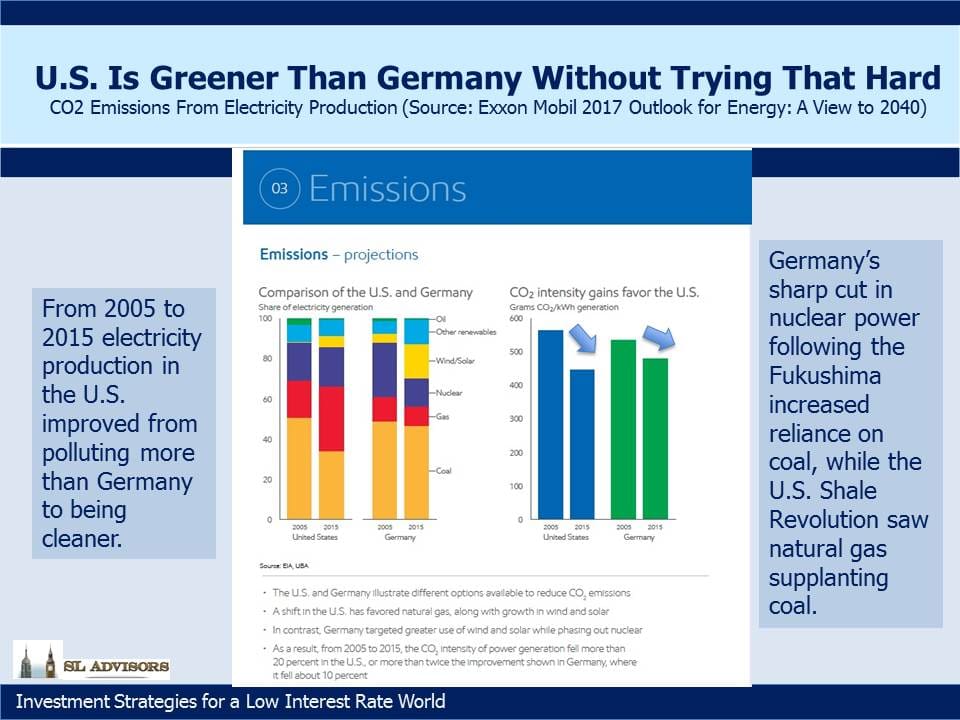
Germany has become a pioneer in the use of windpower, aided by many flat areas on which to build windmills as well as the very windy Baltic and North Seas. Germany sees itself as a leader in the use of renewable energy, a responsible global citizen limiting its contribution to global warming. And yet, few probably realize that the U.S. now generates electricity with less CO2 output than Germany. The improvement in the U.S. is due in large part to greater burning of natural gas instead of coal for electricity generation, a consequence of the Shale Revolution. Meanwhile, Germany’s green efforts have been harmed by its sharp reduction in nuclear power following the near meltdown of Japan’s Fukushima reactor in 2011. Renewables can only do so much, and as a result Germany’s use of coal has stayed higher than it might otherwise. Germans may not feel they need a lecture from Americans about saving the planet, but America can demonstrate better results.

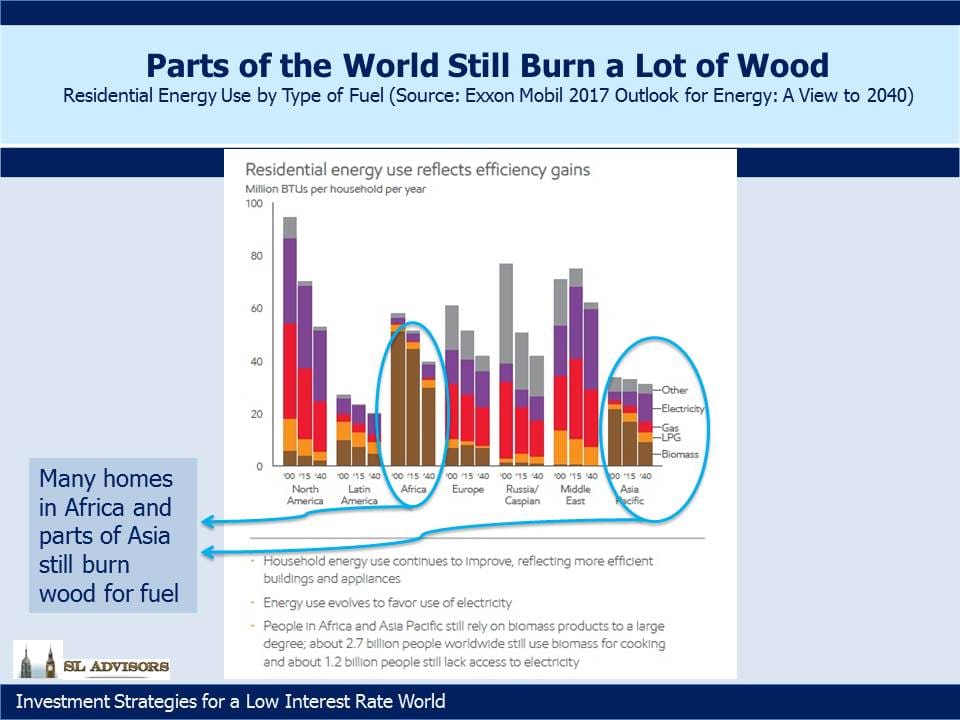
The third slide highlights the highly undeveloped use of energy in homes across Africa and parts of Asia. Biomass (wood, in different forms) may be renewable but it’s not especially clean burning for those in its immediate vicinity. A complete assessment of its environmental impact is complex and depends on how it’s harvested, the climate, what type of wood and the available alternatives. We just found it surprising to see how much of the world still relies on a relatively primitive source of energy.

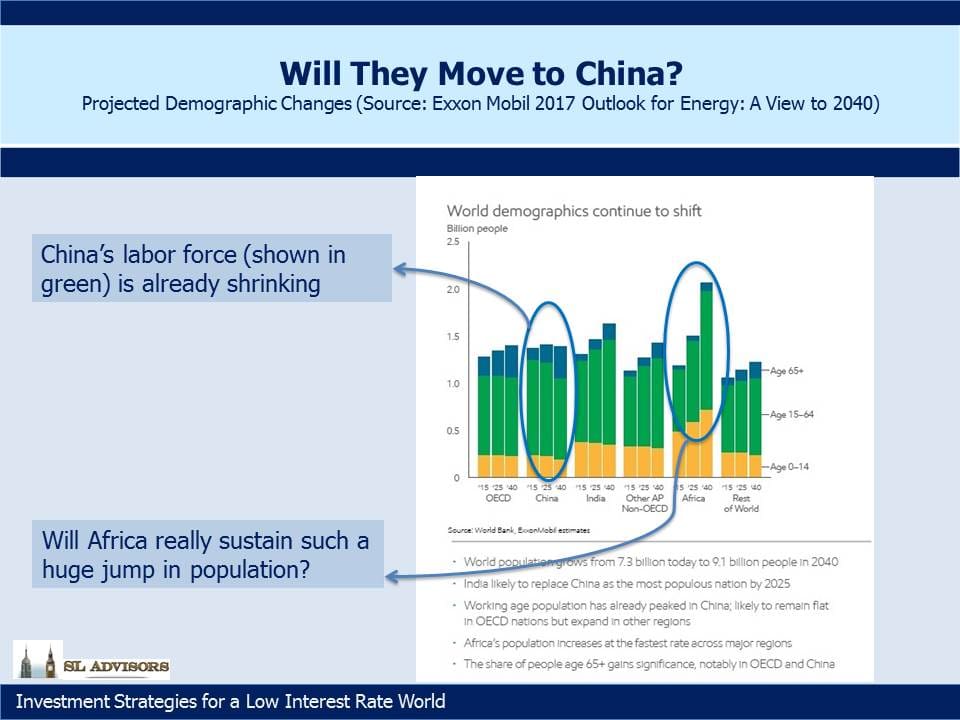
Finally, although demographics shift slowly, they’re still worth a look from time to time. China’s working age population is peaking around now. Since GDP growth comes from only three sources: (1) Labor force growth, (2) Productivity improvements and (3) Capital, Chinese GDP growth will need to come fully from the latter two now on. Developed economies are reckoned to be capable of 1-2% annual GDP growth before adding in the effect of labor force changes. Few are forecasting that China’s GDP growth will sink to this level, but it’s an interesting thought that ALL their growth will have to come from doing things better than before.

Meanwhile, Africa is forecast to add twice the population of North America in about a generation. Providing food, employment, housing and infrastructure for so many people is a challenge no region of the world has faced before.


The Bond Market Loses Its Friends

In 2013, my book Bonds Are Not Forever; The Crisis Facing Fixed Income Investors presented a populist framework for evaluating interest rates. The prospects for the bond market can only be evaluated by considering the U.S. fiscal situation, which is steadily deteriorating along with that of many states. I was dismayed to read the other day of an analysis that places New Jersey (where I live) dead last behind even Illinois in its funding of public sector pensions. We have, at almost every level of government and household, too much debt.

The solution has, since the 2008 Financial Crisis been low rates. If you owe a lot of money low rates are better than high ones. Financial repression in the form of returns that fail to beat inflation after taxes is a stealth means of transferring wealth from savers (lenders) to borrowers. Count the central banks of China and Japan with their >$1TN in U.S. treasury holdings among those on the wrong side of this trade, along with many other foreign governments and sovereign wealth funds.

Some have argued that low rates only help the wealthy (through driving up asset prices); they impede lending (because lending rates aren’t high enough to induce banks to take risk); they force savers to save more (thereby consuming less) than they otherwise would, because returns are so low; and they communicate central bank concern about future economic prospects. Low mortgage rates help homeowners and drive up home values which helps McMansion owners but not first-time buyers. Low rates may be good for the wealthy, and by lessening the burden of the government’s debt they may indirectly help everyone. But to someone with little or no savings, the tangible benefits are not obvious even if they are real (through higher employment, for example).

Nonetheless, we are likely at the early stages of watching this benign process swing into reverse. The conventional result of lower taxes combined with higher spending should be a wider deficit, rising inflation and therefore higher interest rates. The bond market is already beginning to price this in through higher yields, well before any discussions of next year’s budget (or even the appointment of a White House Budget Director).

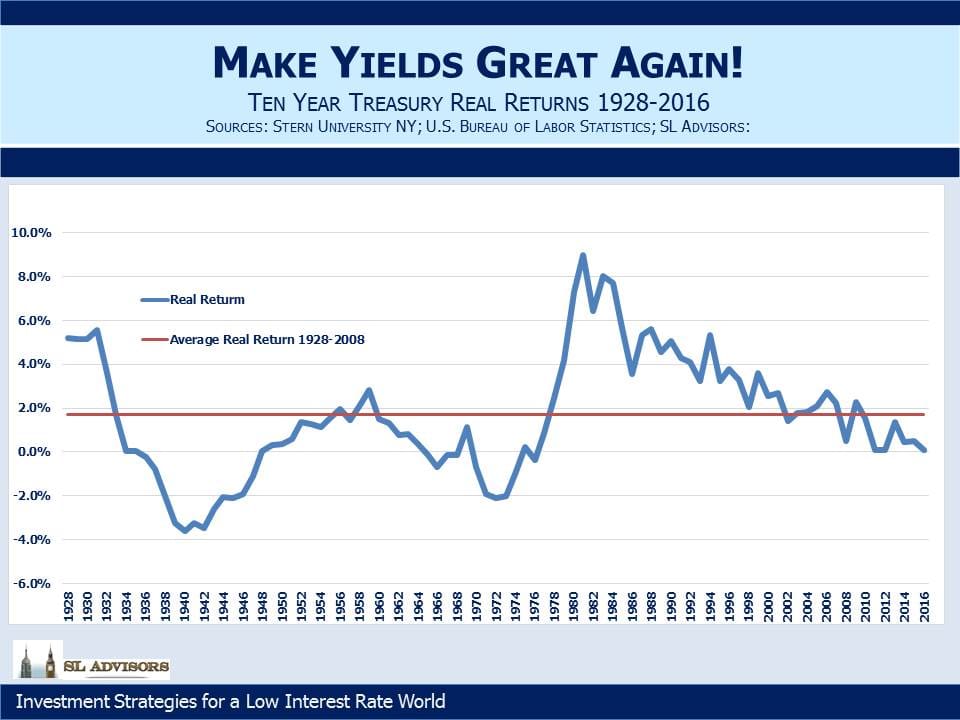
Part of the problem is that bonds don’t offer much value to begin with. They’ve represented an over-priced asset class for years, and it’ll take more than a 0.50% jump in yields to fix that. From 1928 until 2008 when the Federal Reserve’s Quantitative Easing program began distorting yields, the average annual return over inflation (that is, the real return) on ten year treasuries was 1.7%. This is calculated by comparing the average yield each year with the inflation rate that prevailed over the subsequent decade-long holding period of that security. So investing in a ten year treasury note today at 2% would, if the Fed hits its inflation target of 2% over the next ten years, deliver a 0% real return (worse after taxes).

Given the Federal Reserve’s 2% inflation target, even a 4% ten year treasury (roughly double its current yield) would appear to represent a no better than neutral valuation. The deficit was already set to begin rising again before even considering any Republican-enacted tax cuts and other stimulus (such as infrastructure spending). In fact, borrowing at today’s low rates to invest in projects that will improve productivity makes sense in many cases. But under such circumstances, with the possibility of inflation above 2%, perhaps a yield of 5% or even 6% is the threshold at which ten year treasuries (and by extension other long term U.S. corporate bonds at an appropriate spread higher) could justify an investment.

Holding out for such a yield is fanciful. Millions of investors demand far less, which is why we don’t bother with the bond market. Our valuation requirements render us wholly uncompetitive buyers.

Low rates may be the best policy for America, but it looks as if we’re about to try boosting growth through greater fiscal stimulus. The Federal Reserve will seek to normalize short term rates, perhaps faster than their current practice of annual 0.25% hikes. The twin friends of gridlock-induced fiscal discipline (sort of) and low rates are moving on, leaving fixed income investors to fend for themselves. Bonds are a very long way from representing an attractive investment.


image_pdfimage_print