Initial Reaction to the Election

As we all digest the election results, and amid much near term market uncertainty, a few thoughts:

Good businesses in America will for the most part still be good businesses. The shift in political direction will likely include less regulation and in some cases deregulation. Domestic energy infrastructure with its ability to exploit America’s shale resources and limit our dependence on crude oil exports is unlikely to be one of the economy’s losers. While the turmoil in equity markets raises concern of an economic slowdown, the operating performance of midstream Master Limited Partnerships (MLPs) was only modestly affected by last year’s collapse in crude oil prices. Energy consumption in the U.S. is remarkably stable from year to year, and fee-based contracts that limit commodity price risk are widely employed. We think in times of uncertainty, investments in domestic energy infrastructure are one of the more robust choices you can make.

With promises of tax cuts, infrastructure spending and a vow to replace Janet Yellen because of the Fed’s low rate policy, there’s little reason to be constructive on bonds.

Why Market Timing Can Be Seductive

We generally don’t keep CNBC on at our office. Its relentless focus on the short term, punctuated with incessant commercials, make it a needless distraction. That’s why they hire attractive presenters. However, when passing the office next door I did notice a headline saying we’d gone 33 consecutive days without a 1% move in the stock market.

I presume it’s a record of sorts – there has certainly been a dearth of market-moving news lately. It reminded me of that frequent advice to stay invested because a relatively small number of months provide a surprising amount of the total return. And it’s true; using S&P data back to 1900, totaling 1,400 months, had you by some terrible misfortune been out of the market for the ten best months your $1 invested in January 1900 would have only grown to $70, rather than $363 if you’d stayed in the whole time. Mind you, even if you “only” had the $70 at the end of 1,400 months, you’d still have achieved success by longevity and probably wouldn’t care about the money.

Obviously when investors temporarily exit the market, they’re trying to avoid the bad months not miss the good ones. And here’s the thing that’s perhaps not intuitive; if our investor, in missing the ten best months also managed to skip the ten worst ones, he’d be better off than if he did nothing with a terminal wealth of $493.

This places the folly of market timing in a somewhat different light. Under the circumstances, perhaps trying to avoid the bad months is a worthwhile objective since they are disproportionately more damaging. Surely, you’re just as likely to miss a bad month as a good one, or indeed equally likely to miss the worst month as the best?

Sadly, like most investment models that can be thrown together in thirty minutes on a spreadsheet, it’s not that simple. Our market-timing investor is unlikely to miss the best or the worst months, but will probably miss the typical months. Because more months are up than down, the typical monthly return is positive. Since January 1900 we’ve had 828 up months, 59% of the total. The likelihood is that by chance he’ll miss more up months than down ones, and his overall returns will be worse.

The Shrinking Pool of Cheap Assets

Stocks have in recent years been the destination of choice for bond refugees. The guiding strategy behind monetary policy since 2008 has been to drive investors into riskier assets so as to boost economic growth. Amid mounting evidence that this objective was being achieved, the Federal Reserve has contemplated the timing around ending this strategy by normalizing rates. In fact, the Federal Reserve has provided so many false warnings of an impending tightening of monetary policy that it’s barely worth paying attention. I have kept track of their evolving rate forecasts ever since they began providing greater precision back in January 2012. The chart of “blue dots” represents individual FOMC members’ expectations for the Fed Funds rate. Four and a half years ago they kicked off this greater openness with a forecast of a single tightening that year and a 0.75% rate by 2014. It’s fair to say that in early 2012 none of them expected the August 2016 funds rate to be where it is at 0.25%. Ever since they started with the blue dots, they’ve strained to adapt their updated forecasts to their persistent inaction.  It has been an amusing if not especially informative spectacle. You’d think it would be easier to get it right than the record suggests — they are, after all, merely trying to forecast their own actions. However, tactics regularly overwhelm strategy, as a moment of weakness in any sector of the economy is extrapolated into the possibility of a disappointing GDP number. If you look hard enough, there’s always softness somewhere. FOMC members possess many skills, but good forecasters they are not.

Not everyone has been surprised by the lethargic return to “normal” interest rates. Since it is the political season (i.e. shameless self-promotion is all around us), back in 2013 your blogger noted high levels of public debt and concluded that, “As a society we want low rates, and the Federal Reserve is pursuing a set of policies that are clearly in the public interest.” See Bonds Are Not Forever; The Crisis Facing Fixed Income Investors (Wiley, 2013).

Consequently, interest rates have remained lower for far longer than most investors expected. Every fixed rate mortgage has turned out to be more expensive than going with an adjustable one. Every non-defaulting corporate bond issued was, in hindsight, more costly than relying on floating rate debt. Eventually a borrower somewhere will lock in an all-time low in rates, but it hasn’t happened yet.

It’s not hard to find examples of strong performance in bonds, but even by recent standards I found the chart below from the Financial Times striking. The UK may have voted itself a recession via Brexit, but among the winners are holders of long-dated Sterling denominated corporate bonds whose prices in some cases have reached two times their par value at maturity.

Because of continued central bank monetary accommodation, the indices touching new highs are many and varied. Stocks, bonds, utilities and REITs are all at or very close to all- time best levels. As a result their yields are all commensurately paltry, as one might expect. By comparison, energy infrastructure, as represented by the Alerian MLP Index, offers both a substantially higher yield and a meaningful discount to its former high. With so many asset classes trading at hitherto unseen levels, it’s increasingly difficult to identify pockets of value. Momentum investors of course have plenty of choices, since so many sectors have strong upward momentum. MLPs have been no recent laggard on this score either, having leapt 60% from their low this past February. But it seems to us that if you like your investments to offer some kind of value cushion for when the momentum inevitably turns, MLPs should hold your attention. The yield spread between MLPs and REITs remains close to the widest levels it reached during the 2008 financial crisis. Switching from REITs or Utilities into MLPs looks like a portfolio upgrade.

More Thoughts on Brexit; AMLP Reaches a Milestone

The Brexit vote is now two weeks behind us and I still watch developments with jaw agape. Rarely in history has the consequence of a popular vote led so directly to a recession. The IMF has forecast that the UK economy will shrink by 1.5% through 2019 if they agree to a Norway-style EU access (i.e. similar EU budget obligations, lack of immigration controls and submission to EU regulations but with no ability to influence them, not exactly what Brexiteers voted for). Or, if EU access conforms to the World Trade Organization (WTO) tariff framework, the UK economy will shrink by 4.5%. Leading Brexit campaigners such as Boris Johnson and Nigel Farage have exited stage left now that their goals have been achieved. Brexit voters gamely advise that everything will be OK, while decision makers prepare for a recession. Fewer UK jobs will likely reduce immigration anyway, although this is hardly the best means of achieving that goal. And yet, in theory the entire non-UK EU population of almost 450 million people could have relocated to the UK, at which point the country would have resembled a Piccadilly line tube train at 5pm. Free movement of people, a core, inviolable principle of the EU, is absurd.

Nonetheless, Brexit was not a carefully considered response but a visceral reaction with far-reaching and poorly considered consequences. Churchill  once said, “The best argument against democracy is a five-minute conversation with the average voter.” Brexit leaders have led their followers to the cliff and then retired to the pub for a drink while they watch the leaderless deal with the aftermath.

One result is that bond yields globally have fallen to hitherto unimaginable levels. The Barclays Aggregate Index is +6% YTD, beating the S&P500. Regular readers will be familiar with our past illustration of the paltry returns available on bonds whereby we compare a barbell of stocks and cash with the ten year return on bonds. In our April newsletter we wrote about The MLP Risk Premium. With reasonable assumptions about MLP distribution growth rates and prevailing valuations in ten years, you could swap out your bond portfolio for as little as 10% in MLPs with the rest in cash while still achieving a bond-like return. MLP yields have fallen since we wrote that in April, but so have bond yields so the broad set of choices still favors almost anything over bonds but certainly still MLPs.

Federal Open Market Committee (FOMC) minutes released last week confirmed what we’ve long noted, that Janet Yellen will never miss an opportunity to avoid raising rates. Ignore their words and try considering this Fed’s actions as if they’d announced the solution to excessive debt was to keep rates low for a long time. The rhetoric doesn’t reflect such a strategy but their actions most assuredly do. Waiting for rates high enough to justify an investment requires substantial patience, during which time investors are steadily pursuing equity-type risk with its better return prospects.

Tallgrass Energy GP (TEGP) raised its quarterly distribution by 16.7% quarter-on-quarter and 84.2% year-on-year from its pro-forma 2Q15 level. Not every MLP or GP is raising its distribution by any means, but less than six months ago such would have been unthinkable. Meanwhile, the Alerian MLP ETF (AMLP) reached a milestone of sorts, in that the recent recovery in MLPs has finally moved AMLP to where it once again has unrealized gains on its portfolio. As we noted in March (see Are You in the Wrong MLP Fund?) this is the point from which AMLP investors will now earn only 65% of any subsequent upside since the U.S. Treasury will take 35% through corporate tax. Indeed, the tax drag has already had an effect, since AMLP’s YTD performance through June 30 is +10.7% versus the Alerian Infrastructure Index +13.1%. Those AMLP investors who are bullish on the sector (which presumably includes all of them) will, if right, contribute modestly to Federal finances at the expense of their own investment results and reputation for careful analysis. AMLP is the refuge of those who stop at Pg 1 of a prospectus rather than examining Pg 23, Federal Income Taxation of the Fund. This is part of the reason why a more thoughtfully designed, non-taxable, RIC-compliant MLP fund (which we run) has done very well.

We are invested in TEGP.

Hearts Outvote Heads in Brexit

Brexit Image It’s been 34 years since I left the UK and moved to the U.S., and 25 years since I became a U.S. citizen. I long ago lost the right to vote in UK elections, having by now spent two thirds of my life in the New World. But I shall never lose my pride at growing up English nor my intense interest in what’s happening there.
So I have followed the Brexit vote avidly. It has been described as a struggle between the head, which rationally questions how the UK’s economic prospects can be better with the uncertainty of leaving, and the heart, which laments the loss of sovereignty which EU membership demands. Had I voted, my head would have won and I would have checked the “Remain” box, but I have friends on both sides of this highly divisive issue and I can appreciate the frustrations of the majority. Meanwhile, the EU faces another existential crisis.

U.S. citizens are often aghast to learn of the rules agreed to by successive UK governments in order to be an EU member.  The British tabloid press routinely shouts about un-elected bureaucrats in Brussels imposing ridiculous standards of conformity, apparently to promote a more competitive EU-wide market, Many are untrue and some apocryphal, but bananas and cucumbers (to cite just one example) are subject to EU standards on size and curvature. One struggles to comprehend the mindset behind these or the motivation of those who toil to make such rules. I recently heard that EU horseshoes have certain size requirements, which causes at least one UK blacksmith to painstakingly heat and reshape the ones he buys before they’ll fit local horses. Although I couldn’t independently confirm this story, there have been enough similar instances to cause millions of Britons to roll their eyes.

But the major issue was immigration, and an enlarging EU burdened with permanently slow growth because of its catastrophic embrace of the Euro has seen increasing numbers of its citizens migrate north-west to the UK’s more vibrant economy and job market. EU membership requires free movement of EU citizens within EU borders, and an island nation that has repelled European invaders for many centuries was never going to sit comfortably with this. When I was growing up, a vacation in Italy was described as “going to Europe” or to “the Continent”. “Fog in English Channel — Continent Cut Off”  is thought to be a newspaper headline from my grandparents’ time. Whether it actually existed or not, the sentiments it represents did, and in some cases perhaps remain today.

If George Soros and other speculators had not demonstrated so spectacularly in 1992 that the British Pound could not stay linked to the Deutsche Mark, the UK might have subsequently joined the Euro, and by now be suffering similarly slow growth with the rest of the Eurozone. It would at least have deterred some immigration. But Britain has always been more ambivalent about the EU than its founding members. The welcoming of over one million refugees into Germany last year, while a huge and selfless act by Germans, rendered UK PM David Cameron’s promises to limit immigration both more vital and less credible.

When a country eschews tangible economic results such as GDP growth and job creation in favor of intangibles like a feeling of greater sovereignty, investors must acknowledge that the pursuit of corporate profits is not everyone’s priority. While it’s foolish to infer anything about the U.S. election, free trade isn’t as important to as many people as establishment politicians might hope. Populism is a force in other  countries including the U.S. The benefits of open markets are broad but not uniformly distributed, and the less economically fortunate are finding their voice.

The vote split sharply along regional lines, with London, Scotland and Northern Ireland voting to Remain while most of the rest of England chose Leave. Now a second Scottish independence referendum is likely and it may see the union of 1707 dissolved, while Northern Ireland may be reunited with the Irish Republic. A diminished Britain reduced to England and Wales may seek to deepen its economic ties with the U.S.; London to New York is 3,500 miles, 1,000 miles more than Los Angeles to Hawaii. Or the UK may have second thoughts about Brexit, since the economic pain is likely to occur far sooner than freedom from EU rules. A second EU member could also leave — the Netherlands may hold their own referendum. There are many possibilities and few certainties. Nobody can really be sure how events will unfold.

There was also a generational divide, with younger voters less bothered by immigration and enamored of their EU-wide mobility while older voters reflected nostalgia for the Greater, more ethnically Anglo-Saxon, Britain  of old. Because of the propensity of seniors to choose Brexit, a meaningful portion of the 3.8% margin of victory will have passed on before the UK finally negotiates its exit. Consider this quote from one young voter: “Freedom of movement was taken away by our parents, uncles, and grandparents in a parting blow to a generation that was already drowning in the debts of our predecessors.” U.S. baby-boomers are also leaving an unwelcome legacy of debts to cover their un-financed retirement healthcare (Medicare). Different generations are steadily finding theirs interests no longer aligned.

Brexit’s economic impact will affect the UK economy substantially with some forecasting an immediate recession because of the uncertainty. Any long term investment decision confronts acutely difficult assumptions. But if it’s bad for the UK it must be worse for the Eurozone. At least the UK knows where it’s going if not exactly how it’ll get there. Many other EU countries know neither, which is why Eurozone stock markets fell substantially more than the UK’s FTSE. Brexit is far from being just a UK problem. The Euro really didn’t need this.

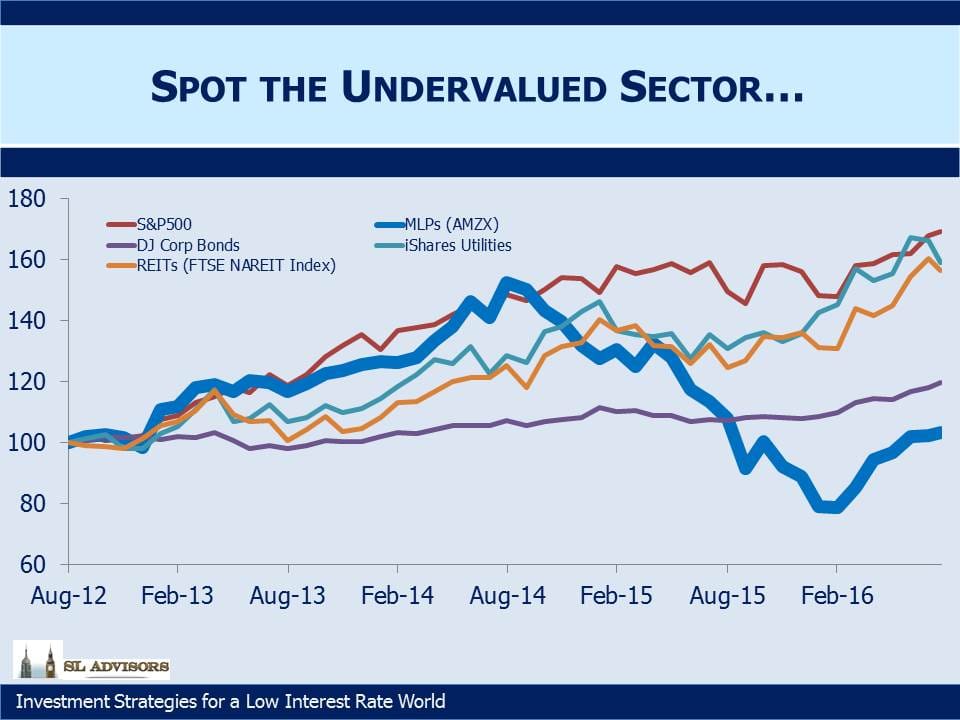
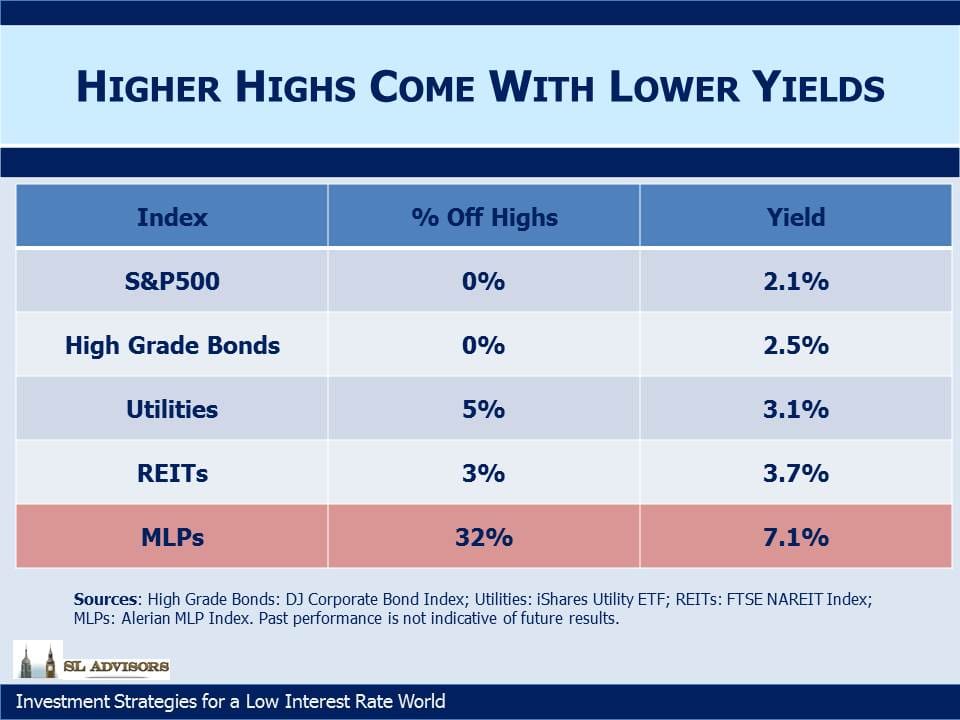
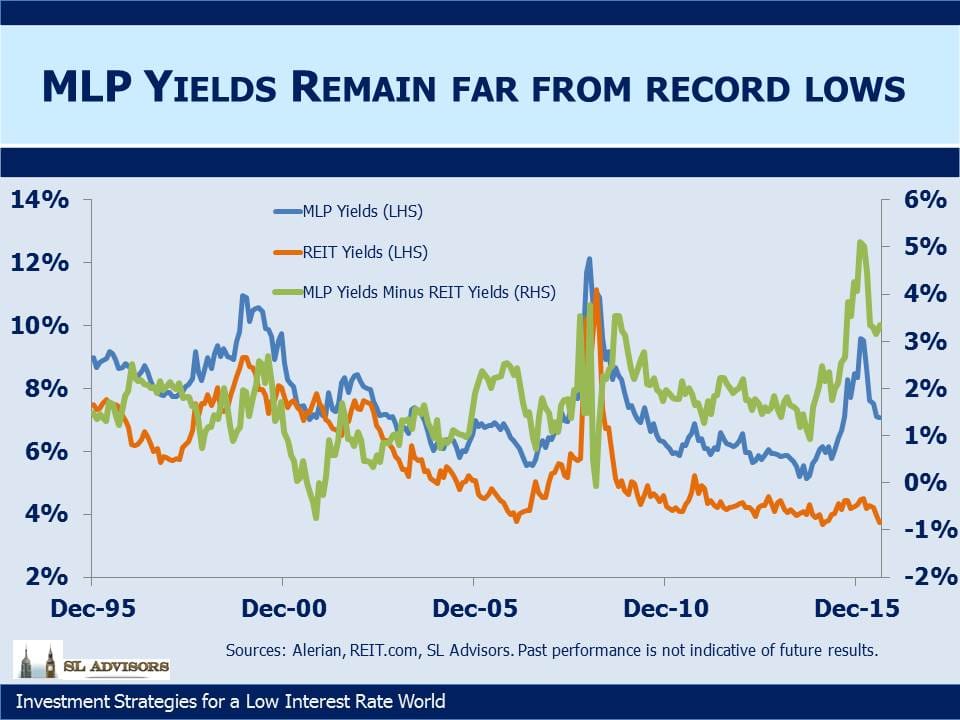
Nonetheless, life will go on. Consumers will buy what they need and energy will be produced and used. Low volatility stocks will remain that way, relative to the S&P 500 at any rate, and U.S. energy infrastructure is, thankfully, over here rather than over there. Not immune to the turmoil voters have unleashed, but only tangentially impacted.

UK voters have finally tired of an EU that delivers edicts and fiscal austerity. While I wouldn’t have voted to Leave, I am deeply proud of this small but highly consequential nation that has the self confidence to abandon the certainty of a dysfunctional club so as to take back control of its future, uncertain though it may be.

Equity Underwriting for Dummies; Kinder's Blunder

If a banker approaches the CEO of a Master Limited Partnership (MLP) with an offer to help, the CEO should run (not walk) in the other direction. The latest victim is the management of Columbia Pipeline Group Inc (CPGX). A month ago management had indicated that they’d be tapping the markets for equity via their MLP, Columbia Pipeline Partners (CPPL). This is how it’s meant to work, with CPGX as the General Partner (GP) directing the MLP it controls to raise capital and invest it, sending half the free cashflow up to CPGX via the Incentive Distribution Rights (IDRs). They currently have $8BN in projects, notwithstanding the market’s current skepticism about MLP growth prospects. To reuse the hedge fund analogy, CPGX is the hedge fund manager (i.e. earning a share of the profits and providing management) and CPPL is the hedge fund (i.e. doing as directed by the GP).

But a month later, no doubt advised by its self-serving equity underwriters Goldman Sachs and Credit Suisse, CPGX instead issued equity, thereby raising capital at the GP level rather than the MLP level. “Hedge fund manager dilutes itself by issuing equity” is not a headline as commonly viewed as “Investors pile into hedge fund”. In this case, CPGX acted as the former when they ought to know better.

Goldman and Credit Suisse did what they do well, which is to ensure that CPGX stock traded down until the moment of pricing, ensuring a profit for the underwriters and favored clients at the expense of existing CPGX investors. The offering was priced at $17.50 on December 1, an 8% discount to the prior day’s close and a level at which it had never previously traded. Due to strong demand the offering was upsized from 51M shares to 71.5 and the stock quickly traded up while the underwriters exercised their option to buy an additional 10.725 million shares (upsized from 7.65 million shares) on top of the 71 million originally sold. Clearly, the market was not surprised; the circumstantial evidence points strongly to the underwriters alerting clients to the offering in the preceding days and thereby softening the market. This is because only the underwriters had both the advance knowledge of the offering and the incentive to see the stock trade off in the days prior to pricing.  Perhaps the equity capital markets staff use hand signals to alert their colleagues on the other side of the Chinese wall about what’s coming, so as to avoid leaving any evidence of their communication. In any event, the result was a success for all involved, except regrettably for CPGX investors whose shares were valued as high as $22 just a month earlier. Make that another win for Wall Street bankers. My book Wall Street Potholes will soon need a Volume 2. You can never be too cynical.

CPGX Dec 4 2015 Revised


I reviewed several corporate finance blunders a few weeks ago in Investment Bankers Are Not Helping MLPs. Kinder Morgan (KMI) was part of that with their poorly handled offer of mandatory convertible securities. But on reflection, they may have committed the biggest blunder of all last year with their restructuring in August 2014. It looked clever at the time, and to our subsequent regret we liked it (see Valuing Kinder Morgan in Its new Structure). By acquiring their MLPs, Kinder Morgan Partners (KMP) and El Paso (EP), they were able to revalue their assets to current market prices and thereby create a higher tax-deductible depreciation charge that fueled a faster growth rate in their dividend. It was pretty slick.

But in hindsight, the reasons for the restructuring were a warning. At their size, they were unable to finance enough accretive projects to continue growing their dividend at its previous rate. The hedge fund analogy is useful here, because almost every hedge fund eventually gets too big. KMI, the GP of two MLPs and in effect the hedge fund manager, should have accepted that slower growth was inevitable and been satisfied with 1) a recurring 6.8% distribution yield growing modestly at KMP, effectively its hedge fund, or 2) consolidating and financing growth from retained earnings like all the other large C-corps. Instead, they adopted a structure yielding 5% with 10% projected growth fueled by the higher depreciation charge but reliant on equity markets to provide capital to finance part of their growth. Fifteen months and a more than 50% drop later, they now have a 12% yielding security with 6-10% 2016 growth and questions swirl about their ability to finance accretive projects given that their cost of equity has doubled. Moreover, it’s no longer an MLP, and the pool of potential investors, while large, looks beyond distributable cashflow and distribution yield and to other metrics such as Enterprise Value/EBITDA, against which it didn’t look quite so cheap at the time.

It’s no doubt a better investment today than it was in August 2014, and it remains a modest holding of ours although substantially less than in the past as we’ve switched into more attractive names. But the MLP-GP structure, with its close comparison to the hedge fund-hedge fund manager, is how Rich Kinder became a billionaire. Incentive distribution rights, the mechanism by which KMI earned roughly half the free cashflow from KMP and (more recently) EP, are similar to a hedge fund manager’s 20% incentive fee. Rich Kinder was smart enough to figure that out, but not smart enough to recognize when it’s time to stop accessing the secondary market for financing.  The largest MLP, Enterprise Products (EPD), funds its growth from internally generated cashflow rather than issuing equity  and has 1.3x coverage on its distribution. Perhaps that’s why EPD unitholders have fared better.

Size is the enemy of performance in hedge funds and, at times, in MLPs. Shame on Rich Kinder for not realizing it and instead letting the investment bankers talk him into the value destroying structure. He bet faster growth would drive down the yield on KMI, making it an acquisition currency of less leveraged businesses in a downturn, which would in turn reduce KMI’s leverage. The strategy has backfired. KMI no longer gets credit for the dividend, which leads to questions about its sustainability. While it’s covered by cashflow and they don’t need to issue new equity until 2H16 since doing the mandatory convertible, if KMI still yields >10% in late 2016 it’ll make more sense for them to cut the dividend and thereby reduce or eliminate their need for additional equity. KMI has made the mistake of many hedge fund managers and investors, thinking they can grow indefinitely. Although some commentators are worried about pressure on pipeline tariffs from stressed E&P companies, there’s a stronger case for tariff increases since the cost of equity for pipeline owners (i.e. MLPs) has risen.

Hedge fund managers don’t buy their hedge funds, and MLP GPs shouldn’t buy their MLPs. Management at Targa Resources (TRGP) should take note (see Targa Resources Needs an Activist).

We are invested in CPGX, EPD, KMI and TRGP.

Measuring Dividend Growth is Complicated

You’d think this would be a pretty simple issue. It’s certainly an important one. Equity investors derive their returns from dividends, dividend growth and capital gains. A simple estimate of long term returns on an equity security is to add the current dividend yield to expected dividend growth to arrive at the expected annual return. If the dividend yield remains constant then the security’s price will rise at the dividend growth rate, hence adding them together makes sense. It’s a shorthand, necessarily imprecise estimate; the dividend yield can fluctuate and the growth estimate can be wrong. Currently, the S&P 500 yields around 2% and dividend growth has averaged 5% for the past 50 years, so a 7% long term return estimate for U.S. public equities is defensible on this basis. Different assumptions will produce a different result.

But the devil is in the details, as you will see. Since much of what we do is in energy infrastructure, we look pretty closely at the Alerian Index as the benchmark for Master Limited Partnerships (MLPs). Growth in distributions (what MLPs call the dividends they pay) is a key component of total returns in this sector, so what have distributions done in 2015?

There’s more than one answer. You can derive a monthly dividend rate on the Alerian Index (AMZ) by multiplying its month end yield by its price. Using this methodology, adding up the last 12 months’ dividends and comparing with the prior 12 months gives a drop of -4.0%. If you estimate the last two months’ of 2015 to be at the same rate as October, you arrive at a full year 2015 figure of -6.0% versus 2014. Another estimate uses just the October 2015 payout rate compared with the prior October, and on this basis they’re down -9.5%. None of these figures are wrong, they’re just different measurements.

The chart shows distribution growth using the one year change in the monthly rate going back to 2007. Prior to the collapse in oil, growth was running at around 5% so the 15% deterioration in the AMZ growth rate is similar to the drop that occurred in 2008. This roughly matches the performance of the index, which by September 2015 had fallen 40.1% from its August 2014 high, roughly the same as its 41.1% drop from June 2007 to December 2008.

Alerian Monthly Distribution Growth Chat for Nov 22 2015 Blog

Veteran MLP investors may recall that AMZ enjoyed positive distribution growth through the financial crisis and be puzzled by the chart showing it was negative. In fact, full year 2009 distributions were 0.5% higher than full year 2008. The year-on-year change in the monthly distribution rate was -2.5% in July 2009. Incidentally, Alerian reports that 2009 growth was +3%. They measure this by taking trailing growth multiplied by the year-end weights of those securities in the AMZ. This doesn’t necessarily reflect the actual experience of investors in AMZ in 2009. Methodology counts for a lot.

The drop in distributions in 2015 has been driven by exploration and production names, many of whom have cut or eliminated their distributions. Upstream businesses are highly sensitive to oil and gas prices. Midstream MLPs have done rather better. The GPs of midstream MLPs have done better still. For example, in our Separately Managed Account strategy, actual cash distributions and dividends for 2015 are coming in at 15.7% higher than 2014. Part of this is driven by reinvestment of dividends, so reversing this feature to get to apples and apples results in 12% growth, 18% better than the equivalent for AMZ. The table below shows selected holdings of ours. We don’t expect growth at the same rate, but it illustrates the difference in operating performance of GPs compared with the AMZ.

Name Trailing 12 Month Distribution Growth
Energy Transfer Equity (ETE) 37%
EnLinc Midstream (ENLC) 11%
Kinder Morgan (KMI) 16%
Plains GP Holdings (PAGP) 21%
Targa Resources Corp (TRGP) 24%
Williams Companies (WMB) 14%


Certain information herein has been obtained from third party sources and, although believed to be reliable, has not been independently verified and its accuracy or completeness cannot be guaranteed. References to indexes and benchmarks are hypothetical illustrations of aggregate returns and do not reflect the performance of any actual investment. Investors cannot invest in an index. There can be no assurance that current investments will be profitable. Actual realized returns will depend on, among other factors, the value of assets and market conditions at the time of disposition, any related transaction costs, and the timing of the purchase. Nothing herein is or should be construed as investment, legal or tax advice, arecommendation of any kind, a solicitation of clients, or an offer to sell or a solicitation of an offer to invest in a fund or funds. An investment in a Fund may be offered only pursuant to the Fund’s prospectus.


Retail Therapy

Retail stocks have recently taken a pounding. Nordstrom (JWN) fell 15% on Friday following weak earnings. Macy’s (M) fell 14% a couple of days earlier following their earnings. All of a sudden retail is a tough business. Consumers aren’t buying quite as readily as they were. We’re not invested in the retail sector, so as I watched these stocks collapse I must confess to experiencing the kind of grim satisfaction that one feels when others experience a discomfort with which we’re already uncomfortably familiar. A friend reminded me it’s Schadenfreude. It’s not just energy infrastructure names that can cause sharp, sudden financial pain to their investors. Yeah!! Finally, it’s somebody else’s turn for a price shock! Readers who are invested in retail stocks will hopefully forgive this temporary insensitivity to their plight.

Although the S&P500 is flat for the year, there’s evidence to show that individual, retail investors have had a substantially worse time of it. Master Limited Partnerships (MLPs) are predominantly held by individuals whereas U.S. public equities are largely held by institutions. The 29% drop in the Alerian Index this year is substantially worse than the S&P500 and has been disproportionately endured by individuals.

Closed end funds is another area where individual investors dominate, because there’s insufficient liquidity to attract many institutions. The sector appeals because of the yields but also because of the opportunity to invest in funds at a discount to their net asset value. Many large funds are trading at double-digit percent discounts, reflecting the diminished appetite of new money to invest and close the gap. CEF Connect lists Pimco Dynamic Credit Income (PCI), DoubleLine Income Solutions (DSL) and Cohen and Steers Infrastructure (UTF), all fairly sizeable funds with a market cap of $1.6-2.6BN, with discounts of 13-17%. MLP funds in this sector usually trade at a premium, since investors value the 1099 for tax reporting (since direct holdings of MLPs generate K-1s) but even these funds are at a discount to NAV. Kayne Anderson (KYN), one of the largest such MLP funds at $2.2BN in market cap, is down 43% this year. Because they use leverage, like many of their peers, they will have undergone forced selling of positions in order to remain within their borrowing limits, causing a permanent loss of capital and illustrating some of the non-economic selling in the sector. KYN has a 10 year annual return of 5.25%, versus 9.4% for the Alerian Index. Leveraged exposure isn’t that smart.

Activist hedge fund managers are some of the smartest guys around. It’s interesting to watch their moves and copying them can be compelling. They’re often on TV and the stocks they own garner outsized media attention. You don’t have to try that hard either. For those unwilling to hunt through SEC filings there is a convenient mutual fund called the 13D Activist (DDDIX) which invests in stocks targeted by activists. It’s down 9.1 for the year. It owns Valeant (VRX), which has ruined the year for a few Masters of the Universe as well as retail investors.

So it seems as if individual investors are having a pretty tough year that is not reflected simply by looking at the S&P500. Asset classes that are most favored by individuals have had a tough year, and as we head towards the Holidays it’s a time for dumping what’s not working. Tax-loss selling or simply cutting loose investments that have not worked is depressing certain security prices by a surprising amount. It’s likely causing some of the liquidation we’re seeing  that often appears to be borne out of resignation rather than an assessment of new information.

My retired bond trader friend was well known for making money from bearish bets on bonds by selling first and buying later, although he always maintained that he was comfortable making money in either direction. He did this more regularly than most and enjoyed substantial professional success. However, while enduring a particularly tough period of shorting the market only to be forced to cover at a loss, he was lamenting to his wife how difficult it was to make money. Her breezy advice was to do what she did when she was fed up; go out and buy something. Of course, buy first and then sell was the answer.

Retail therapy is what’s needed by today’s retail investors, and the retail industry could certainly use it.


Bond Yields Reach Another Milestone

Recently, an important threshold was breached in terms of relative valuation between stocks and bonds. The yield on ten year U.S. treasuries drifted below the dividend yield on the S&P 500. It’s happened a couple of times in recent years but only because of a flight to quality and never for very long. This time looks different.

It’s worth examining  this relationship over a very long period of time. The chart below goes back to 1871 and reminds us that for decades stock dividends were regarded as risky and uncertain. Little attention was paid to the possibility of dividend growth, and investors clearly placed greater value on the security of coupon payments from bonds.

This spread began to reverse in the late 1950s and since then, during the careers of a substantial percentage of today’s investors, bond yields have remained the higher of the two. Dividend growth (defined as the trailing five year annualized growth rate) was more variable prior to the 1950s with several periods when it was negative, so it’s understandable that investors of the day regarded dividends as quite uncertain. However, since the S&P500 dividend yield dipped below treasury yields, dividend growth has never been negative. The five year annualized growth rate since 1960 is 5.8%. Assessing a long term return target for equities is inevitably a combination of art and science, but adding a 5% growth rate to today’s 2% dividend yield suggests 7% is a defensible assumed return.S&P Yield Minus 10 Yr Treasury Oct 23 2015

The trend of bond yields to decline towards dividend yields began a long time ago – back in 1981 when interest rates and inflation were peaking. It’s taken over 30 years, but the relationship is now back where it was during the Korean War. The investment outlook is, as always, uncertain with multiple areas of concern. However, the Federal Open Market Committee has made it abundantly clear that rates will rise slowly; recent earnings reports from Coke (KO), Dow Chemical (DOW), Microsoft (MSFT) and Amazon (AMZN) have all been good. These and many other stocks are near 52-week highs and in some cases all-time highs. FactSet projects earnings and dividends to grow mid to high single digits over the next year. These considerations are once again highlighting the inadequacy of fixed return securities as a source of after-tax real returns, and with one major asset class devoid of any value investors are again turning to stocks. The tumultuous markets of late August and September are receding; rather than portending a coming economic collapse, they simply represent additional evidence that far too much capital employs leverage.

S&P Dividend Growth Rate October 23 2015

The long term trend suggests that treasury yields will remain below dividend yields for the foreseeable future. We’re not forecasting such, simply noting that a 2% yield that is likely to grow on a diversified portfolio of stocks looks a whole lot more attractive than a 2% yield that’s fixed. It didn’t look so smart in recent weeks, but if you don’t use leverage and restrict yourself to companies with strong balance sheets you can watch such shenanigans from the sidelines.

Master Limited Partnerships (MLPs) have begun reporting earnings. Kinder Morgan (KMI) disappointed investors by trimming their 2016 dividend growth from 10% to 6-10%. KMI isn’t technically an MLP any more since they reorganized into a C-corp last year. However, they are squarely in the energy infrastructure business like midstream MLPs. Rather than issue equity to fund their growth projects, they plan to access an alternate, not yet disclosed source of capital through the middle of next year. Their free cashflow covers their distribution, and they access the capital markets to finance growth.

MLPs have had a torrid year, with the sector down far more (in our view) than lower crude oil would justify. As Rich Kinder said, “…we are insulated from the direct and indirect impacts of very low commodity environment, but we are not immune.” KMI owns pipelines and terminals; 54% of their cashflows come from natural gas pipelines; 11% come from a CO2 business that supports oil production; they transport about a third of the natural gas consumed in the U.S. 96% of their cashflows are fee-based or hedged: “insulated…but not immune”.

Selling energy infrastructure stocks is fashionable, and owning them is not. While bond yields are dipping below the S&P’s 2% dividend yield, KMI yields more than three times as much (7.25% on its 2016 dividend assuming the low end of the 6-10% growth range) and its dividend will grow at least as fast. Owning such securities will once more be fashionable.

We are invested in KO, DOW and KMI.

Hedge Fund Manager Runs Drug Company…

In time we may all owe a debt of thanks to Martin Shkreli, CEO of Turing Pharmaceuticals and a former hedge fund manager. Their 5,456% increase in Daraprim brought attention to the the importance of regular price hikes in driving revenue growth at major drug companies. The Wall Street Journal later noted that almost 80% of the increase in the top line for the manufacturers of 30 top-selling drugs came from raising prices versus increasing volumes. It strikes me that this may just become a political issue in the U.S., especially heading into an election year. High drug prices affect millions of Americans and it’s easy for the media to find some poor individual whose needed medication has suddenly tripled in price. Hilary Clinton’s infamous “price gouging” tweet shows that the issue easily lends itself to sound bites, a necessary condition to retain media interest. Big pharma represents a fairly easy target. Congressional hearings no doubt loom for companies such as Valeant (VRX), whose business model relies on testing the limits of the market’s acceptance for price hikes. They operate as a ruthless capitalist in a market where the laws of economics routinely fail, since customers (patients) are rarely informed buyers and typically incur the expense not directly through paying the asking price, but indirectly through consequently higher health insurance premiums or ultimately higher taxes. One friend told me he holds an investment in health care stocks as a hedge against rising medical expenses for him and his wife, an unusual yet insightful approach.

A common refrain from drug companies  is that high drug prices (and the relatively unregulated U.S. market has the highest) allow money to be reinvested back into R&D. This is a weak argument. If research has a high enough IRR, it can be funded through capital from the public and private markets; it doesn’t have to be through retained earnings. It’s just as likely that the ability to charge whatever they can dramatically increases the IRR on R&D. High drug prices themselves makes the R&D more worthwhile than it would be otherwise.

We don’t invest in healthcare stocks, as might be apparent. Therefore, to the extent we run investment strategies that are benchmarked against the S&P500, we are effectively short the health care sector, which has outperformed the S&P500 for the last three years and remains on pace to do so again in 2015.  The issue of drug pricing isn’t likely to recede soon though, and maybe health care stocks will start receiving some of the opprobrium so routinely heaped on banks and oil companies. The energy sector is due for a break as most out of favor.

Martin Shkreli used to work at a hedge fund, and he would probably like the economics of the General Partner (GP) in the MLP sector too. Targa Resources Partners (NGLS) is an MLP whose business is divided between the midstream activities of Gathering and Processing (G&P) of crude oil and natural gas across the central U.S., and downstream activities of Marketing and Distribution. NGLS recently provided guidance for 2016 that included flat distribution growth, reflecting the more challenging environment for some energy infrastructure businesses. However, as the hedge fund is to the hedge fund manager, so is NGLS to Targa Resource Corp (TRGP), the GP of NGLS. The same guidance projected 15% dividend growth at TRGP. Flat returns for hedge fund clients rarely hurt the hedge fund manager, and so it is at TRGP whose Incentive Distribution Rights (IDRs) are at the 50% level, entitling it to half the Distributable Cash Flow from NGLS, the MLP it controls through its ownership of the GP and IDRs. TRGP currently yields  6.3% on its forecast $4.12 2016 dividend, and with a market cap of $3.7BN is of sufficiently modest size to be of interest to many potential acquirers.

We are invested in TRGP.

image_pdfimage_print