What the Midterms Mean for Stocks
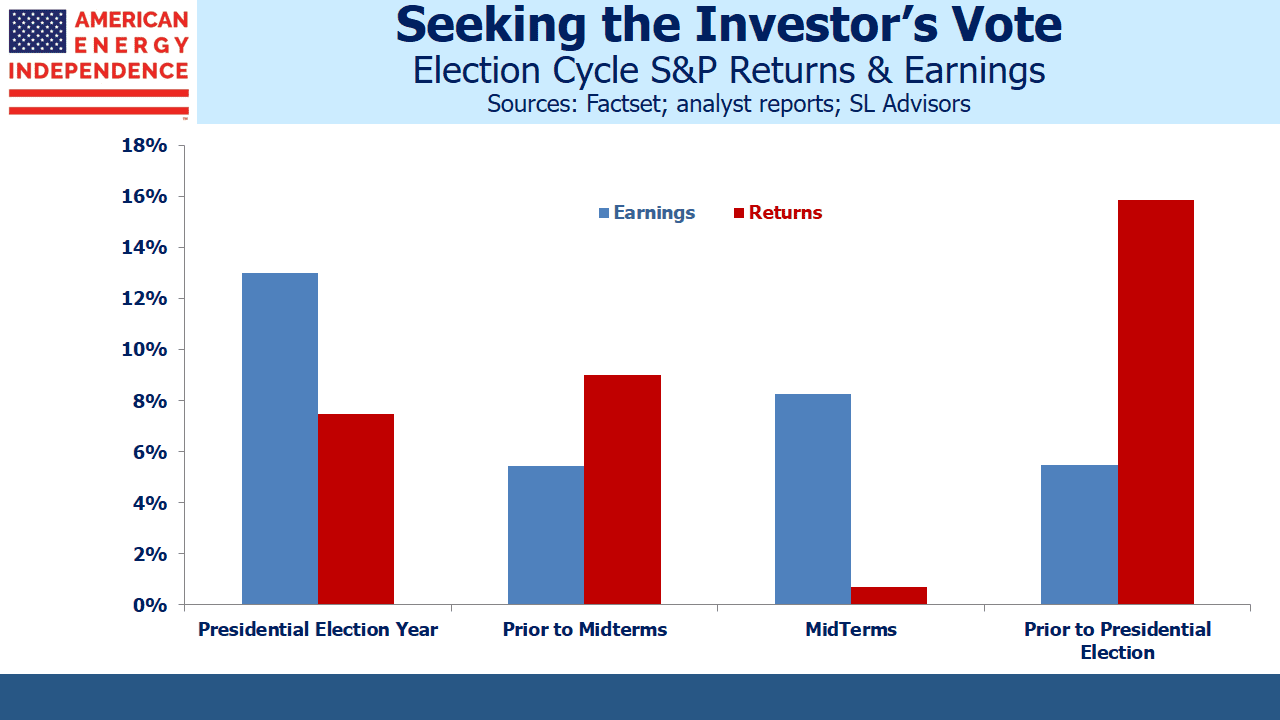
Equity returns are historically strongest in the year following the midterms. Conspiracy theorists will judge that politicians in office focus on market-friendly moves that aren’t limited to government spending in order to stay in power. Whatever the reason, the effect is quite remarkable. Since 1960, the S&P500 has risen by 15.9% on average in the third year of a Presidential cycle, almost twice the 8% average across all years.
When equity returns in the year following midterms have been poor, the White House has often changed hands. In 2015 stocks were flat and Trump’s victory followed. Eight years earlier, modest losses in 2007 provided Obama with his opening, and the 2008 financial crisis confirmed the pattern.
Many people feel that a divided government is preferable since it requires both parties to compromise in order to achieve anything. With the House of Representatives shifting to Democrat control, legislation will require support from both parties. However, the numbers don’t support this, with such returns in the year following midterms 1% lower if one of the two houses of Congress is controlled by the party not in the White House.
So history suggests 2019 should be a good year for stocks.
But much about the Trump presidency is different. Looking at S&P500 earnings by year presents a different picture. Earnings growth in a midterm year is 8.3%, approximately the average. Earnings tend to be strongest in Presidential election years. That’s partly what drives good returns following midterms, because investors look ahead to stronger profits the following year.
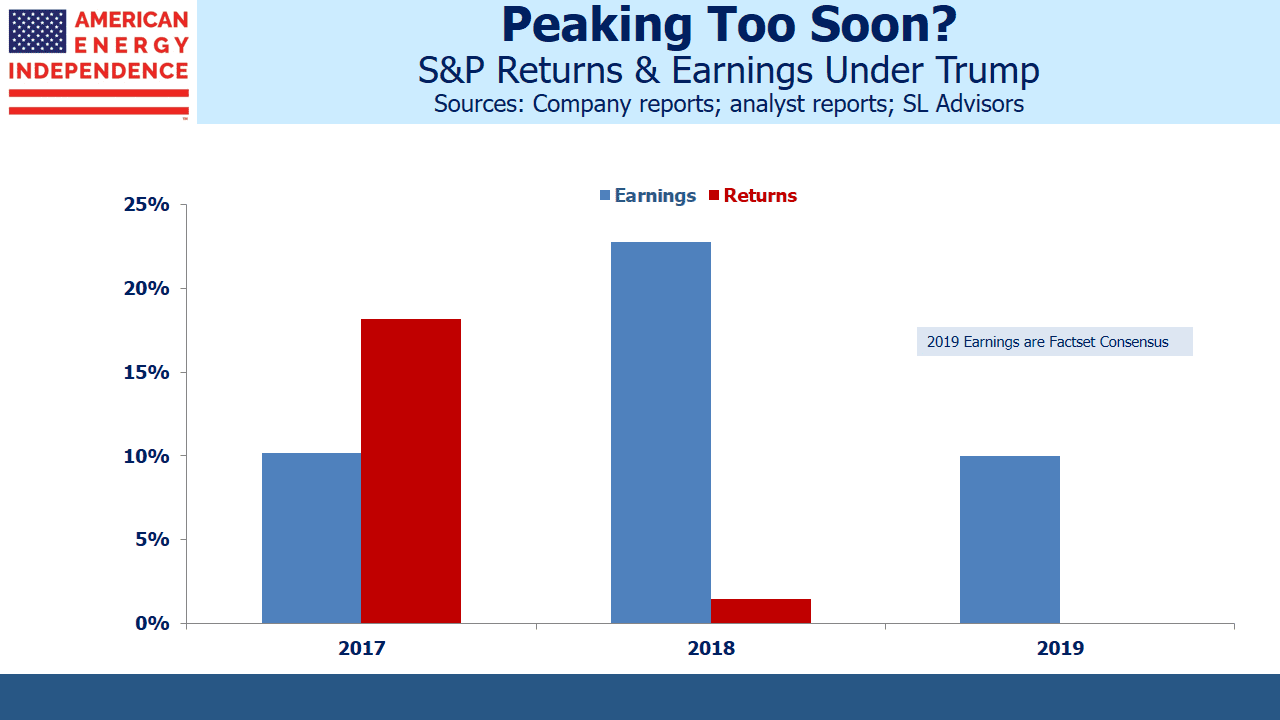
2018 S&P earnings are coming in at +22%, fueled by the cut in corporate taxes. That’s likely to be the strongest profits year of the four year cycle, and it’s come two years ahead of what typically happens.
So it’s possible the election cycle effect may have already peaked; last year’s 18% rise in the S&P500 was looking ahead to this year’s jump in earnings. The new administration completed tax reform following its first full year in office.
Factset is forecasting 10% earnings growth for 2019 – still higher than the 50+ year average albeit down sharply from this year.
In addition to the votes for elective office, many states included ballot questions for voters to consider.
Colorado included a proposal (Proposition 112) that would mandate a 2,500 foot setback for oil and gas development (including gathering & processing plants and pipelines) from “vulnerable” areas (residential neighborhoods, schools, parks, sports fields, general public open space, lakes, rivers, creeks, intermittent streams or any vulnerable area). Analysis showed that it would essentially ban oil & gas development on non-federal lands. It was a keenly contested issue, with one side claiming that energy extraction is endangering air quality while the other noted the jobs at risk from such a move.
Voters rejected it 57 to 43, which is a relief for Colorado’s oil and gas industry. Strikingly, Weld County, home to most of Colorado’s drilling, voted against 112 by a resounding 75/25. If the people closest to it are so strongly in favor of its continuation, it’s not clear why a statewide ballot was the right approach.
Proposition 112 was in any case likely unconstitutional, since leaseholders losing their property (i.e. their foregone right to drill for oil and gas in affected areas) would have sued the government for compensation. It illustrates why direct democracy is such a clumsy instrument, since “yes/no” public questions aren’t easily translated into coherent legislation. Politicians in the state had previously failed to act, which created enough public support to get the question on the ballot.
Even though Proposition 112 lost, it reflects the ambivalence of many regions over the development of America’s hydrocarbon reserves. The energy sector spent money on commercials highlighting the threat to the local economy, given 112’s stifling provisions. Colorado’s legislature is now likely to take up the issue and pass legislation intended to address the concerns of the proposals supporters. It means existing energy infrastructure already in service has a little more value, given increasing challenges to development.
Important Disclosures
The information provided is for informational purposes only and investors should determine for themselves whether a particular service, security or product is suitable for their investment needs. The information contained herein is not complete, may not be current, is subject to change, and is subject to, and qualified in its entirety by, the more complete disclosures, risk factors and other terms that are contained in the disclosure, prospectus, and offering. Certain information herein has been obtained from third party sources and, although believed to be reliable, has not been independently verified and its accuracy or completeness cannot be guaranteed. No representation is made with respect to the accuracy, completeness or timeliness of this information. Nothing provided on this site constitutes tax advice. Individuals should seek the advice of their own tax advisor for specific information regarding tax consequences of investments. Investments in securities entail risk and are not suitable for all investors. This site is not a recommendation nor an offer to sell (or solicitation of an offer to buy) securities in the United States or in any other jurisdiction.
References to indexes and benchmarks are hypothetical illustrations of aggregate returns and do not reflect the performance of any actual investment. Investors cannot invest in an index and do not reflect the deduction of the advisor’s fees or other trading expenses. There can be no assurance that current investments will be profitable. Actual realized returns will depend on, among other factors, the value of assets and market conditions at the time of disposition, any related transaction costs, and the timing of the purchase. Indexes and benchmarks may not directly correlate or only partially relate to portfolios managed by SL Advisors as they have different underlying investments and may use different strategies or have different objectives than portfolios managed by SL Advisors (e.g. The Alerian index is a group MLP securities in the oil and gas industries. Portfolios may not include the same investments that are included in the Alerian Index. The S & P Index does not directly relate to investment strategies managed by SL Advisers.)
This site may contain forward-looking statements relating to the objectives, opportunities, and the future performance of the U.S. market generally. Forward-looking statements may be identified by the use of such words as; “believe,” “expect,” “anticipate,” “should,” “planned,” “estimated,” “potential” and other similar terms. Examples of forward-looking statements include, but are not limited to, estimates with respect to financial condition, results of operations, and success or lack of success of any particular investment strategy. All are subject to various factors, including, but not limited to general and local economic conditions, changing levels of competition within certain industries and markets, changes in interest rates, changes in legislation or regulation, and other economic, competitive, governmental, regulatory and technological factors affecting a portfolio’s operations that could cause actual results to differ materially from projected results. Such statements are forward-looking in nature and involves a number of known and unknown risks, uncertainties and other factors, and accordingly, actual results may differ materially from those reflected or contemplated in such forward-looking statements. Prospective investors are cautioned not to place undue reliance on any forward-looking statements or examples. None of SL Advisors LLC or any of its affiliates or principals nor any other individual or entity assumes any obligation to update any forward-looking statements as a result of new information, subsequent events or any other circumstances. All statements made herein speak only as of the date that they were made. r
Certain hyperlinks or referenced websites on the Site, if any, are for your convenience and forward you to third parties’ websites, which generally are recognized by their top level domain name. Any descriptions of, references to, or links to other products, publications or services does not constitute an endorsement, authorization, sponsorship by or affiliation with SL Advisors LLC with respect to any linked site or its sponsor, unless expressly stated by SL Advisors LLC. Any such information, products or sites have not necessarily been reviewed by SL Advisors LLC and are provided or maintained by third parties over whom SL Advisors LLC exercise no control. SL Advisors LLC expressly disclaim any responsibility for the content, the accuracy of the information, and/or quality of products or services provided by or advertised on these third-party sites.
All investment strategies have the potential for profit or loss. Different types of investments involve varying degrees of risk, and there can be no assurance that any specific investment will be suitable or profitable for a client’s investment portfolio.
Past performance of the American Energy Independence Index is not indicative of future returns.


Leave a Reply
Want to join the discussion?Feel free to contribute!