US Sets Multiple Energy Records

/
President Biden probably won’t brag about US energy production, but when the final figures for 2023 are in the US will have set numerous records.
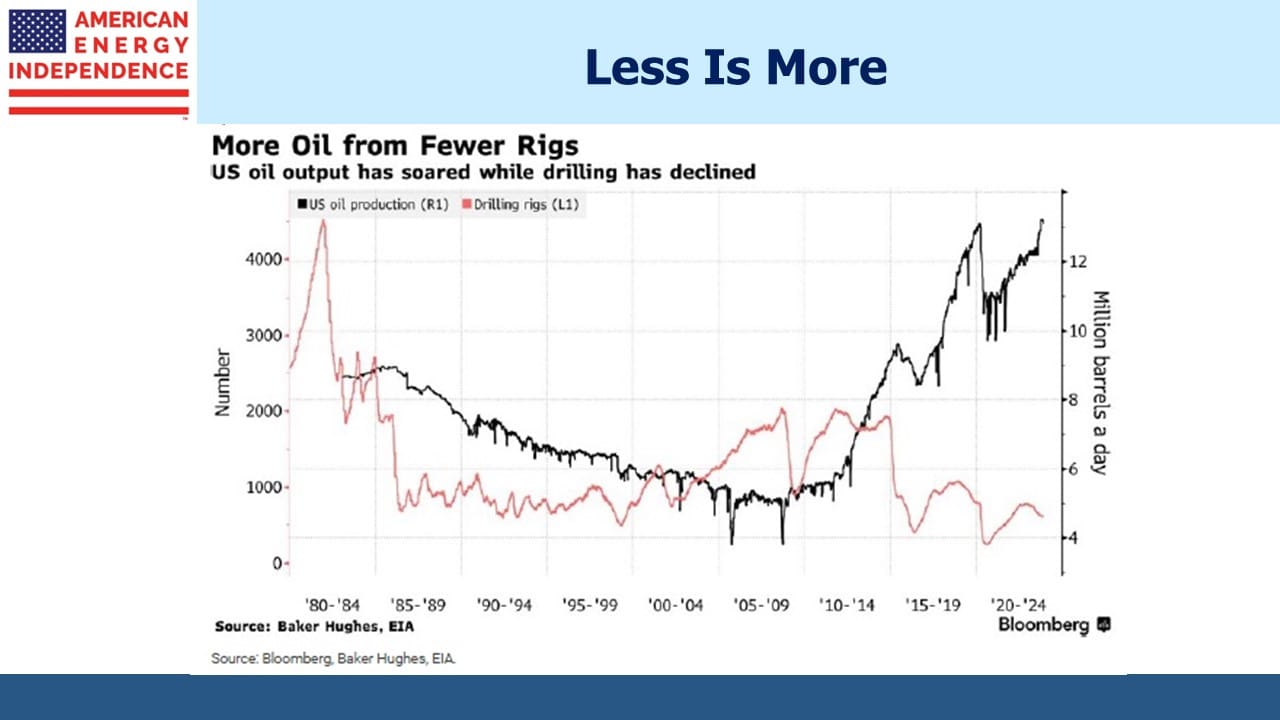
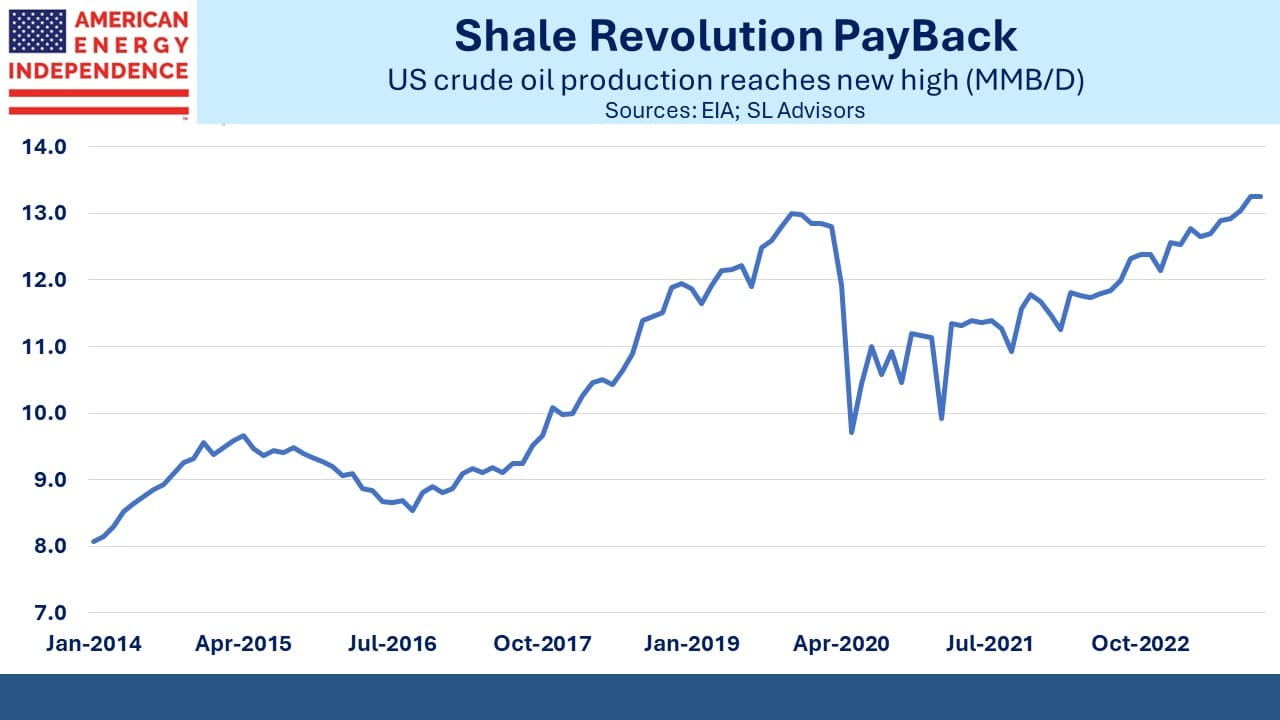
Crude oil production reached a record 13.2 Million Barrels per Day (MMB/D) in October, surpassing the prior record set four years earlier before the pandemic. Few analysts were projecting this at the beginning of last year. Upstream capital discipline was expected to moderate output growth. But drillers squeezed efficiencies out of their operations, producing more with fewer rigs and drilling longer laterals.
Biden complained bitterly two years ago that US oil production wasn’t increasing in response to higher prices. As he was reminded back then, it takes time to raise production and the Administration doesn’t exactly behave like a friend of reliable energy. But the market works, and most bullish price forecasts for crude oil last year were wrong because they didn’t expect increasing US supply.
Our crude exports averaged a record high of 3.99 MMB/D in 1H23.
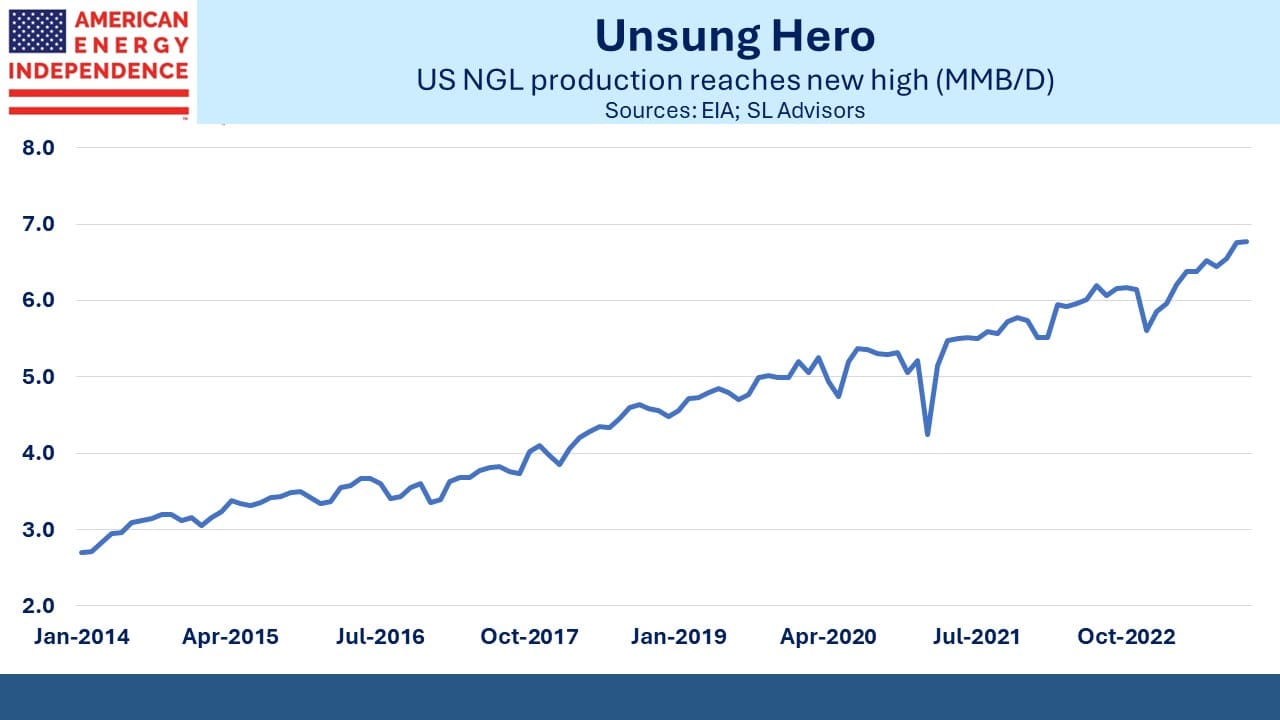
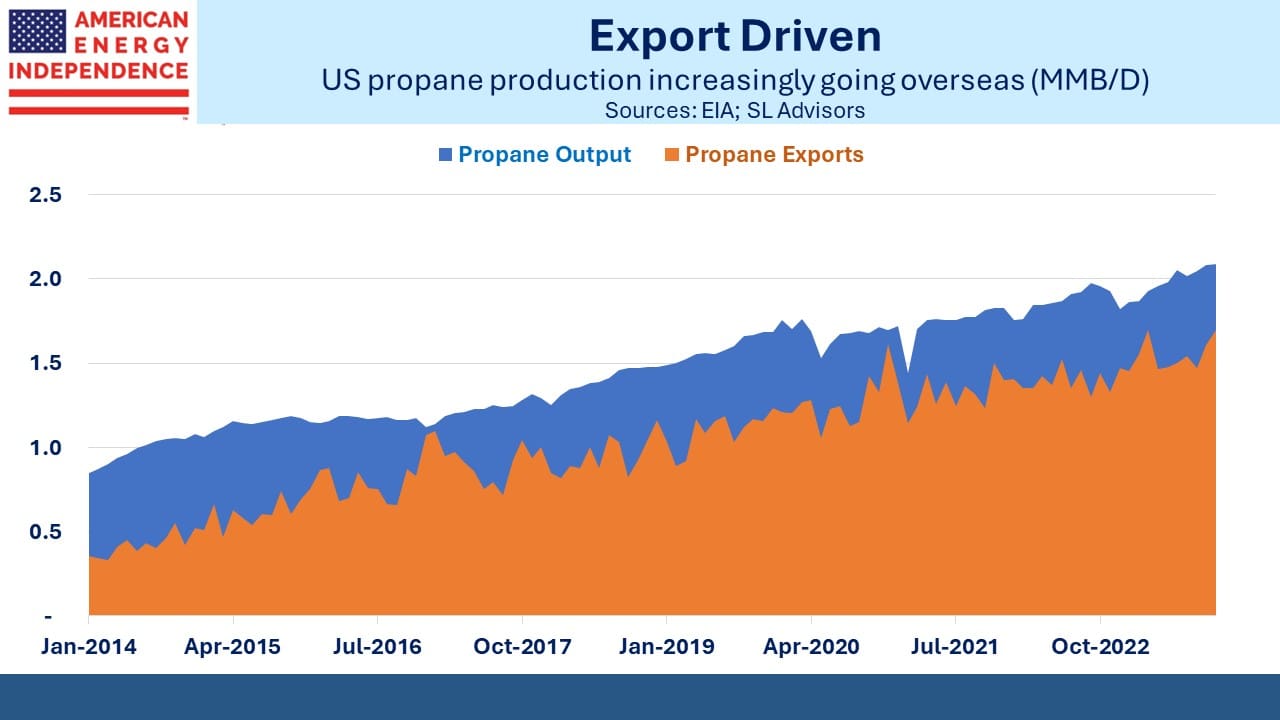
Natural Gas Liquids (NGLs, which include ethane, propane and butane) continue to set new records with volumes more than doubling over the past decade. Ethane is increasingly used in the petrochemical industry to manufacture various forms of plastics. Propane is used domestically for cooking where natural gas is unavailable, and by farmers for drying crops. But export growth is behind the steady increase in US propane production.
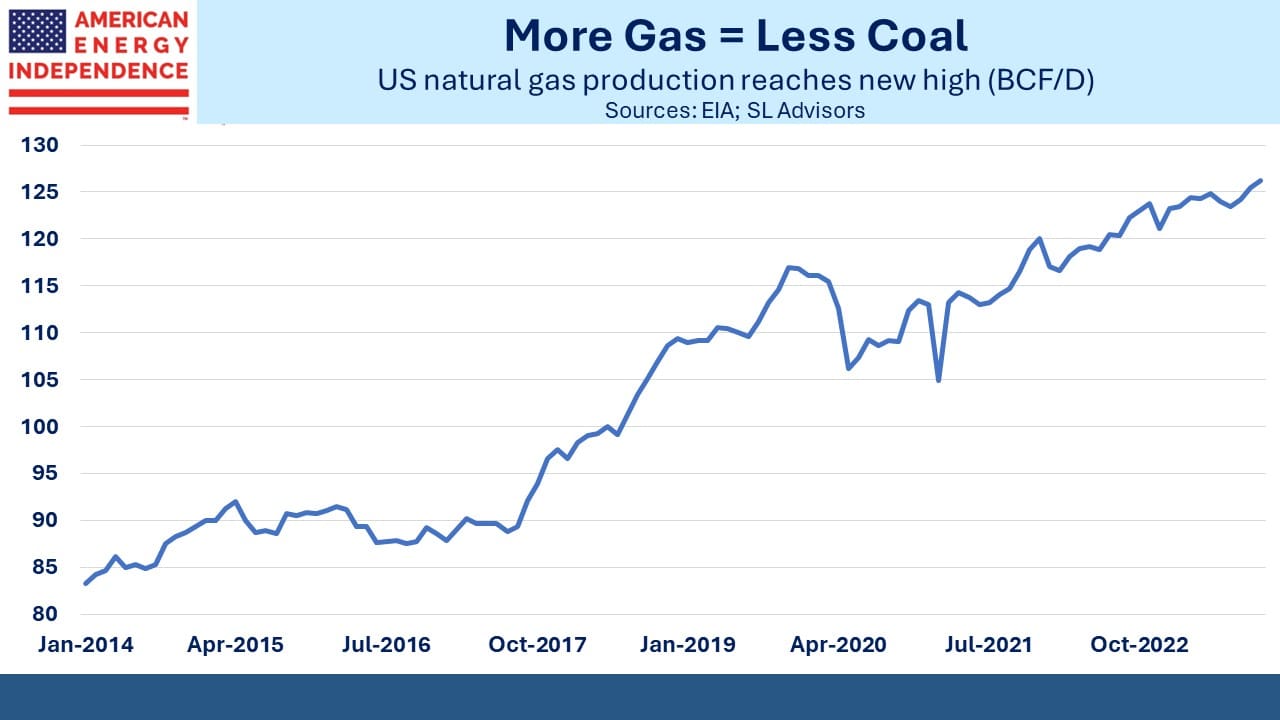
Natural gas production continues to set new records. As with crude oil, this has been done more efficiently, with the gas rig count falling 24% during the first ten months of last year. Some of the increased gas production has come from oil wells as associated gas, largely in the Permian basin in west Texas and New Mexico. The three major oil plays in the Permian are now producing almost 14 Billion Cubic Feet per Day (BCF/D) of gas, over a tenth of US output.
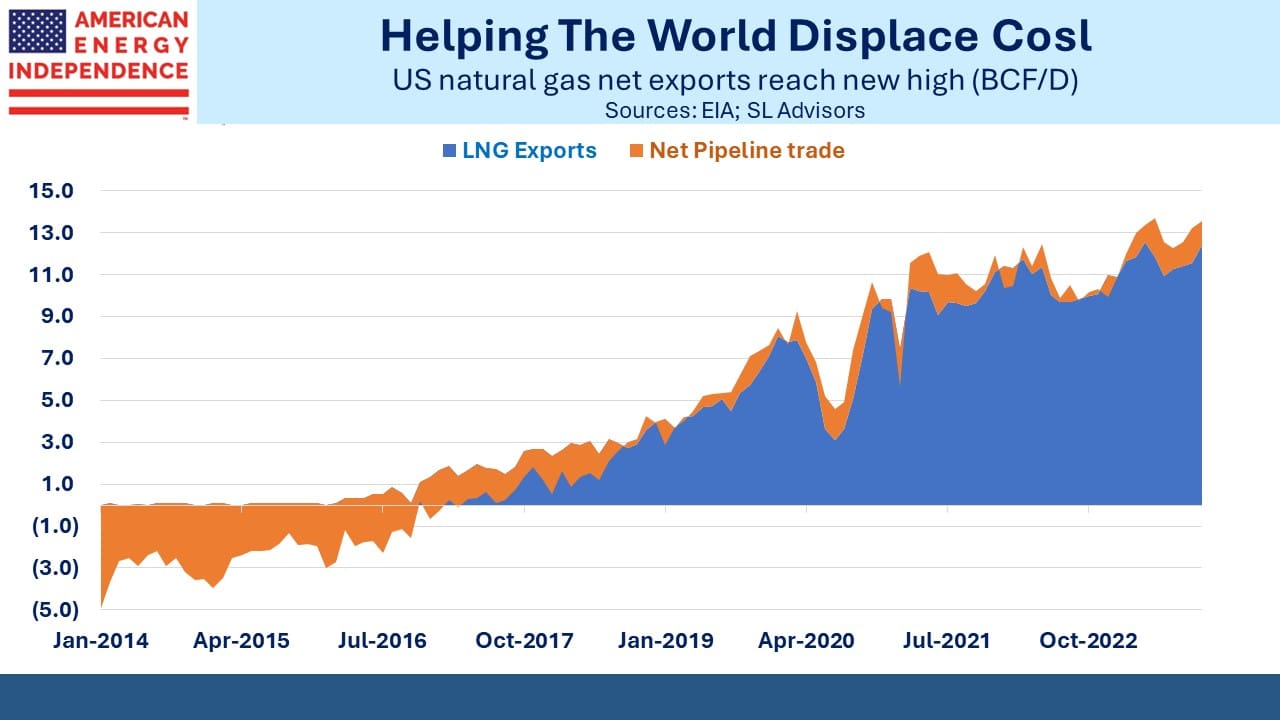
Natural gas production growth helped reduce our use of coal for power generation and is increasingly offering the same opportunity to our trade partners. LNG exports set another record last year, and the Energy Information Administration (EIA) expects export capacity to more than double by 2027.
This is all a big success story for America.
This abundance has weighed on prices for crude oil and domestic natural gas. Exxon Mobil warned that 4Q operating results could drop to $8.9BN, down 30% on a year ago. They also expect to write down California-based assets by $2.5BN in response to the Golden state’s hostile policies towards reliable energy.
Chevron expects to take $3.5-4.0BN impairment on its California assets due to “continuing regulatory challenges.”
Both stocks are down over the past year. Most of the energy sector had a poor year.
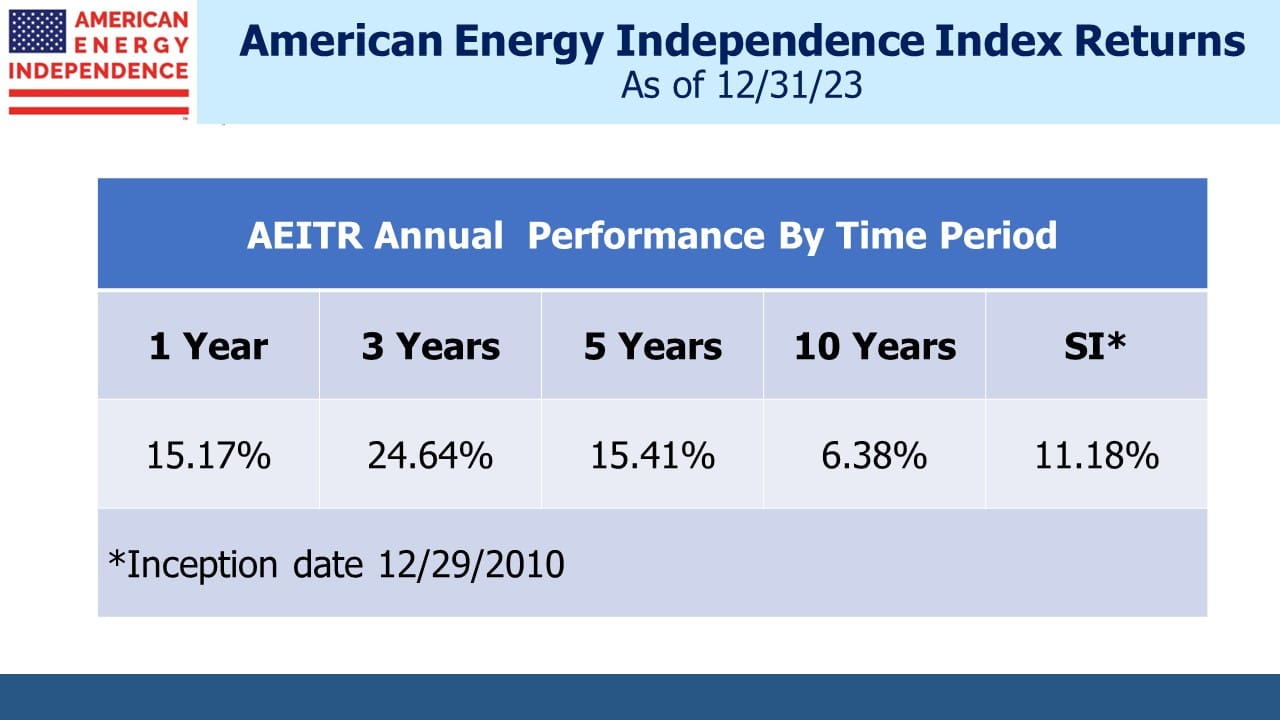
But the increasing volumes were good for midstream, with the American Energy Independence Index beating eight of the 11 S&P 500 sectors (see Higher Despite Retail Selling). The link between oil prices and pipeline stocks is weakening in response to lower leverage.
Record-setting US production of oil, NGLs and natural gas under a Democrat administration shows that the party in the White House has less influence than some think over the sector. Even though Biden famously promised to end fossil fuels four years ago when he was campaigning, that goal soon became aspirational and before long he was pleading for more oil.
VP Kamala Harris is from California, and assuming Biden keeps her on the ticket the presidential election will carry a real possibility that a second Biden term might be completed by a President Harris. There’s little about California’s energy policies that should endear investors to such a prospect.
But when you’re looking for energy policies to avoid, Germany usually offers a better example. The WSJ recently estimated that pursuing zero emissions will cost Germans €1.9TN by 2030. This is around half their GDP.
German voters have generally supported policies that are domestically ruinous and mostly serve to accommodate growth in emissions by emerging economies led by China and India. You’d think a willingness to spend so much would assure results – and emissions from Germany fell to 673 Million Metric Tonnes (MMTs), down by 73 MMTs and well below the government’s annual target of 722 MMTs. However, only 15% of this reduction was credited to improved efficiencies and renewables.
Half came from production cuts.
German policies have made energy so expensive, both because of the focus on renewables but also because of the reliance on Russian natural gas, that they are shrinking their way towards their climate goals.
Some of those German companies cutting back production are investing in new facilities in America.
Let’s hope the sharp contrast between American and German policies persists, unless German voters become more pragmatic – and more American.
We have three have funds that seek to profit from this environment:

Important Disclosures
The information provided is for informational purposes only and investors should determine for themselves whether a particular service, security or product is suitable for their investment needs. The information contained herein is not complete, may not be current, is subject to change, and is subject to, and qualified in its entirety by, the more complete disclosures, risk factors and other terms that are contained in the disclosure, prospectus, and offering. Certain information herein has been obtained from third party sources and, although believed to be reliable, has not been independently verified and its accuracy or completeness cannot be guaranteed. No representation is made with respect to the accuracy, completeness or timeliness of this information. Nothing provided on this site constitutes tax advice. Individuals should seek the advice of their own tax advisor for specific information regarding tax consequences of investments. Investments in securities entail risk and are not suitable for all investors. This site is not a recommendation nor an offer to sell (or solicitation of an offer to buy) securities in the United States or in any other jurisdiction.
References to indexes and benchmarks are hypothetical illustrations of aggregate returns and do not reflect the performance of any actual investment. Investors cannot invest in an index and do not reflect the deduction of the advisor’s fees or other trading expenses. There can be no assurance that current investments will be profitable. Actual realized returns will depend on, among other factors, the value of assets and market conditions at the time of disposition, any related transaction costs, and the timing of the purchase. Indexes and benchmarks may not directly correlate or only partially relate to portfolios managed by SL Advisors as they have different underlying investments and may use different strategies or have different objectives than portfolios managed by SL Advisors (e.g. The Alerian index is a group MLP securities in the oil and gas industries. Portfolios may not include the same investments that are included in the Alerian Index. The S & P Index does not directly relate to investment strategies managed by SL Advisers.)
This site may contain forward-looking statements relating to the objectives, opportunities, and the future performance of the U.S. market generally. Forward-looking statements may be identified by the use of such words as; “believe,” “expect,” “anticipate,” “should,” “planned,” “estimated,” “potential” and other similar terms. Examples of forward-looking statements include, but are not limited to, estimates with respect to financial condition, results of operations, and success or lack of success of any particular investment strategy. All are subject to various factors, including, but not limited to general and local economic conditions, changing levels of competition within certain industries and markets, changes in interest rates, changes in legislation or regulation, and other economic, competitive, governmental, regulatory and technological factors affecting a portfolio’s operations that could cause actual results to differ materially from projected results. Such statements are forward-looking in nature and involves a number of known and unknown risks, uncertainties and other factors, and accordingly, actual results may differ materially from those reflected or contemplated in such forward-looking statements. Prospective investors are cautioned not to place undue reliance on any forward-looking statements or examples. None of SL Advisors LLC or any of its affiliates or principals nor any other individual or entity assumes any obligation to update any forward-looking statements as a result of new information, subsequent events or any other circumstances. All statements made herein speak only as of the date that they were made. r
Certain hyperlinks or referenced websites on the Site, if any, are for your convenience and forward you to third parties’ websites, which generally are recognized by their top level domain name. Any descriptions of, references to, or links to other products, publications or services does not constitute an endorsement, authorization, sponsorship by or affiliation with SL Advisors LLC with respect to any linked site or its sponsor, unless expressly stated by SL Advisors LLC. Any such information, products or sites have not necessarily been reviewed by SL Advisors LLC and are provided or maintained by third parties over whom SL Advisors LLC exercise no control. SL Advisors LLC expressly disclaim any responsibility for the content, the accuracy of the information, and/or quality of products or services provided by or advertised on these third-party sites.
All investment strategies have the potential for profit or loss. Different types of investments involve varying degrees of risk, and there can be no assurance that any specific investment will be suitable or profitable for a client’s investment portfolio.
Past performance of the American Energy Independence Index is not indicative of future returns.


Leave a Reply
Want to join the discussion?Feel free to contribute!