Some Surprising Facts About Energy
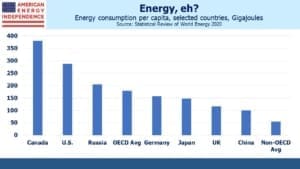
BP’s Statistical Review of World Energy offers many interesting and sometimes surprising insights about global energy. Start with our neighbors to the north. In a poll last year, two thirds of Canadians believed climate change is as serious an issue as Covid. Canada has a carbon tax, and lowering emissions has long been official government policy. However, adjusted for population Canada is an energy hog, consuming 380 Gigajoules (GJ) per person, compared with the U.S. at 288 GJ. Canada has the highest use of any OECD (i.e. rich) country, and two times the OCED average.
Moreover, 10.1% of Canada’s primary energy comes from renewables (including hydro), while the equivalent U.S. figure is 12.2%.
Germany’s per capita energy consumption is 157 GJ, less than half Canada’s. While Germany’s commitment to renewables has caused many problems (see Renewables: More Capacity, Less Utilization), using less energy lowers emissions.
Canada is better than the U.S. in coal consumption though (5.3% of primary energy production vs 11.3%), which explains why their per capita emissions are just below ours. Most Canadians would probably assume their country is a global leader on climate change, but this isn’t supported by the numbers.
Phasing out coal-burning power plants is a simple and direct way for most countries to reduce emissions. Replacing coal with natural gas has been a big source of America’s reduced emissions in recent years. U.S. coal consumption has been declining at over 5% p.a. for the past decade, faster than the OECD average of 3% (Canada has reduced coal consumption at a 6% CAGR). However, non-OECD countries have increased coal consumption at a 2% CAGR over this time, which is why global coal consumption unfortunately continues to increase.
Herein lies the conundrum for the simplistic world view of climate extremists. Developed countries are using less of the dirtiest fuel, while emerging countries are using more. The rich world wants to save the planet, while the emerging one wants rich world living standards. These conflicting goals are clearly visible in the numbers on global energy consumption.
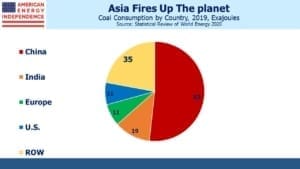
Coal is cheap, easily handled and ubiquitous. Because coal is found in so many parts of the world, coal trade is a much smaller portion of global consumption than for other fuels such as crude oil. OECD countries could decide to stop exporting coal, but they won’t. Australia exports 86% of its production. China’s domestic production (79.8 Exajoules) approximately equals its consumption (81.7 Exajoules).
Australia possesses 14% of the world’s coal reserves. China has 13%. Should Australia leave most of theirs in the ground, slashing exports and pushing up prices on the dirtiest fossil fuel, thereby promoting switching to cleaner alternatives such as natural gas? Should China, consumer of half the world’s coal, leave theirs in the ground? The U.S. possesses 23% of the world’s coal, and will burn more of it to generate power this year and next than in 2020, according to the Energy Information Administration (see Emissions To Rise Under Democrats). Coal’s continued prevalence around the world mocks all the media hype over solar panels and windmills.
The U.S. is the world’s biggest producer of natural gas, with around a 23% share. The big opportunity is for Joe Biden to send John Kerry, Climate Czar, around the world promoting this as a far better choice than coal.
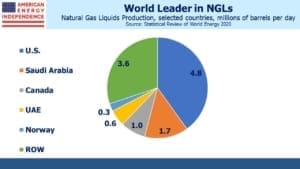
Less appreciated is our dominance in natural gas liquids (mostly ethane and propane) where we produce 40% of global output. Volumes grew at 9% p.a. over the past decade. Much of this is used by the petrochemical industry as feedstock for plastics. Propane exports are now above 1.2 million barrels per day, up over 10X in the past decade.
Climate change exposes many misalignments of interests. Developed countries are pursuing lower emissions, while developing countries like China and India favor economic growth to raise living standards, which is why their emissions are rising and offsetting reductions elsewhere. But reserves of crude oil lie predominantly in non-OECD countries too.
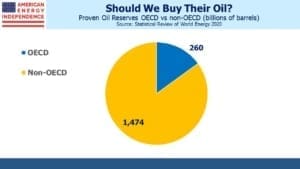
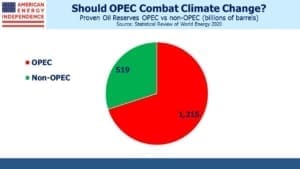
We’re told that we have a moral obligation to take the lead in reducing emissions, because poorer countries are less able to afford flood control and other mitigants. But 85% of the world’s proved oil reserves are in non-OECD countries. How much of this will be left in the ground? OPEC has 70% of the world’s crude reserves. Providing this oil to the rest of the world will create wealth that can be invested to protect against the effects of global warming. That may even be in some countries’ best interests.
If the U.S. trims crude consumption (which isn’t on the horizon) and imports less from Nigeria, a willing seller, are we really helping them? More broadly, the world’s poorest continent, Africa, produces 8% of the world’s oil. Environmental extremists haven’t yet reconciled a desire to reduce global demand for their output with those countries’ efforts to raise living standards by selling oil.
Misalignments of interest are everywhere. The rich world wants lower emissions, while emerging countries want rich world living standards, which require more energy. Rich countries seek to use less oil, which is predominantly owned and sold by poorer countries. OECD countries burn 20% of the world’s coal, leaving non-OECD, supposedly more vulnerable to climate change because they’re poorer, burning the other 80%. It should be no surprise the biggest contributors to reduced emissions have been economic: coal-to-gas switching because of cost, and the Covid recession.
Interestingly, Bloomberg’ NEF, which writes about the energy transition, expects electric vehicles to represent only 8% of the global auto fleet by 2030, with internal combustion engine sales still growing at 0.8% p.a. over the next decade. Rising incomes in developing countries will drive auto sales growth.
As long as environmental extremists reject nuclear power, you can be assured their concern for the world’s future isn’t genuine. Nuclear is clean, cheap, and the record shows proportionately safer than any other form of energy. If the extremists really believed the world has ten years left before irreversible catastrophe, they’d be embracing every solution including this one.
Japan’s consumption of nuclear power dropped to zero in 2014 following the 2011 Fukushima disaster. But they have pragmatically been restarting nuclear plants since then. Following power shortages this winter, Japan’s energy minister said nuclear was crucial to the country’s emission goals.
Solar panels, windmills and batteries will demand more of certain key minerals, of which U.S. reserves are negligible. We have no cobalt (over half is in Congo); 4% of the world’s lithium (Chile has over half) and 1% of the planet’s rare earth metal reserves (China has 35%). Having reached energy independence, policymakers will need to consider the geopolitical consequences of becoming dependent once more on other countries for key energy inputs.
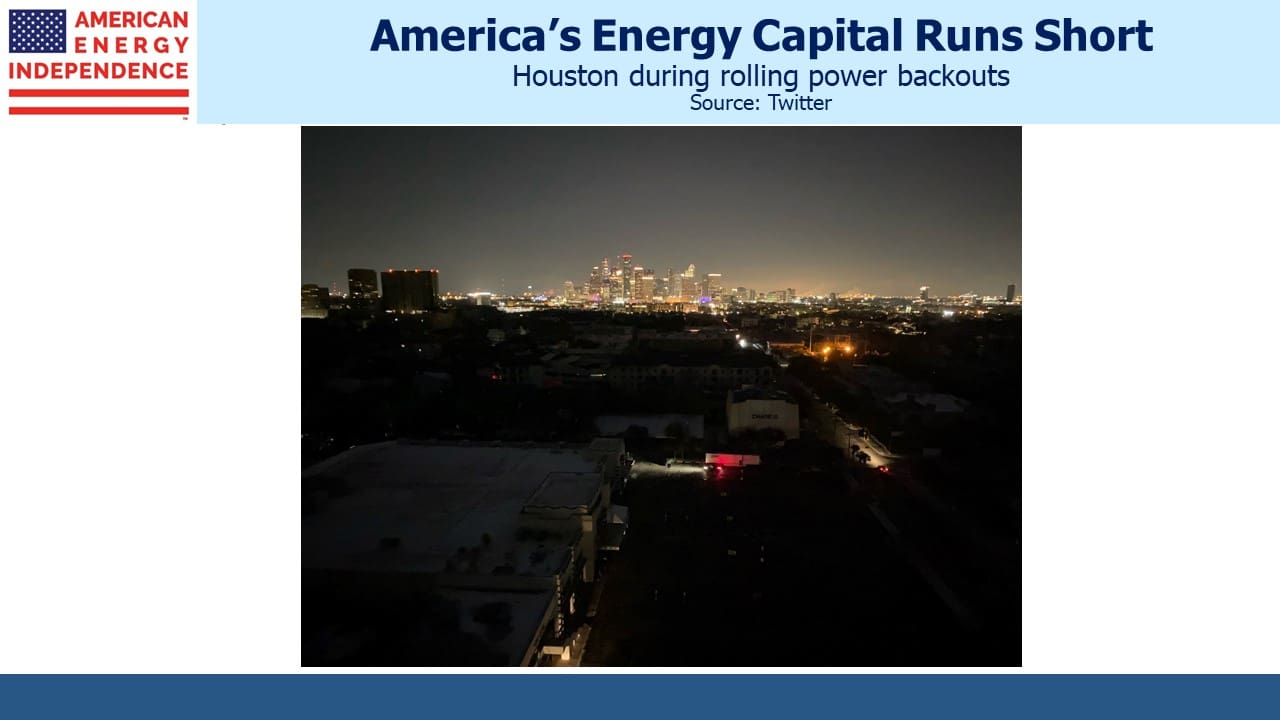
Recent cold weather in the U.S. has once again exposed the fickle nature of renewable power. Its intermittency means its often available but not always when you need it most. Texas expects to see record electricity demand over the President’s Day weekend. However, the chill has reduced windmills’ share of power generation from 42% to 8%, as ice has impeded their operations. Natural gas, always there to compensate for weather-related unreliability, tripled its contribution to Texans’ electricity needs.
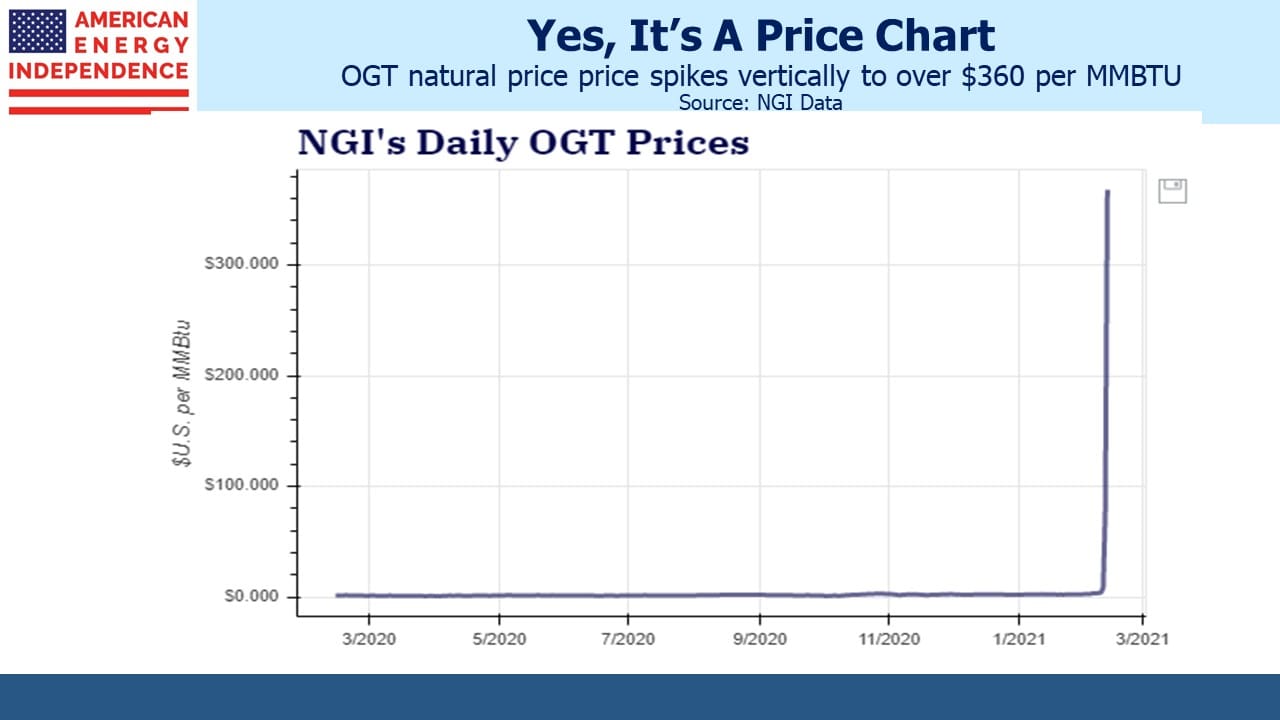
North Asian LNG prices exceeded $35 per Million BTUs (MMBTU) during a cold snap in January (see Asia Leads Natural Gas Demand). On Friday, natural gas on the Oklahoma Gas Transmission line (OGT) touched $600 per MMBTU intra-day on Friday, settling at over $360. The Henry Hub benchmark closed at $2.91. Few fans of renewables will factor this cost in when promoting how “cheap” wind power is.
The world is using more of every kind of energy. China’s electricity consumption grew at 7% p.a. over the past decade. An energy transition that makes the most of natural gas is one that’s likely to succeed. A fund backed by Bill Gates recently backed start-up C-Zero, which aims to split natural gas (methane) into hydrogen, which it’ll burn, and solid carbon which it will bury. Since combusted hydrogen only produces heat and water, it’s zero-emission energy. There are many R&D efforts to use natural gas cleanly, often by capturing the emissions before they enter the atmosphere. The U.S. and our pipeline sector are well positioned for it.
We are invested in all the components of the American Energy Independence Index via the ETF that seeks to track its performance.
Important Disclosures
The information provided is for informational purposes only and investors should determine for themselves whether a particular service, security or product is suitable for their investment needs. The information contained herein is not complete, may not be current, is subject to change, and is subject to, and qualified in its entirety by, the more complete disclosures, risk factors and other terms that are contained in the disclosure, prospectus, and offering. Certain information herein has been obtained from third party sources and, although believed to be reliable, has not been independently verified and its accuracy or completeness cannot be guaranteed. No representation is made with respect to the accuracy, completeness or timeliness of this information. Nothing provided on this site constitutes tax advice. Individuals should seek the advice of their own tax advisor for specific information regarding tax consequences of investments. Investments in securities entail risk and are not suitable for all investors. This site is not a recommendation nor an offer to sell (or solicitation of an offer to buy) securities in the United States or in any other jurisdiction.
References to indexes and benchmarks are hypothetical illustrations of aggregate returns and do not reflect the performance of any actual investment. Investors cannot invest in an index and do not reflect the deduction of the advisor’s fees or other trading expenses. There can be no assurance that current investments will be profitable. Actual realized returns will depend on, among other factors, the value of assets and market conditions at the time of disposition, any related transaction costs, and the timing of the purchase. Indexes and benchmarks may not directly correlate or only partially relate to portfolios managed by SL Advisors as they have different underlying investments and may use different strategies or have different objectives than portfolios managed by SL Advisors (e.g. The Alerian index is a group MLP securities in the oil and gas industries. Portfolios may not include the same investments that are included in the Alerian Index. The S & P Index does not directly relate to investment strategies managed by SL Advisers.)
This site may contain forward-looking statements relating to the objectives, opportunities, and the future performance of the U.S. market generally. Forward-looking statements may be identified by the use of such words as; “believe,” “expect,” “anticipate,” “should,” “planned,” “estimated,” “potential” and other similar terms. Examples of forward-looking statements include, but are not limited to, estimates with respect to financial condition, results of operations, and success or lack of success of any particular investment strategy. All are subject to various factors, including, but not limited to general and local economic conditions, changing levels of competition within certain industries and markets, changes in interest rates, changes in legislation or regulation, and other economic, competitive, governmental, regulatory and technological factors affecting a portfolio’s operations that could cause actual results to differ materially from projected results. Such statements are forward-looking in nature and involves a number of known and unknown risks, uncertainties and other factors, and accordingly, actual results may differ materially from those reflected or contemplated in such forward-looking statements. Prospective investors are cautioned not to place undue reliance on any forward-looking statements or examples. None of SL Advisors LLC or any of its affiliates or principals nor any other individual or entity assumes any obligation to update any forward-looking statements as a result of new information, subsequent events or any other circumstances. All statements made herein speak only as of the date that they were made. r
Certain hyperlinks or referenced websites on the Site, if any, are for your convenience and forward you to third parties’ websites, which generally are recognized by their top level domain name. Any descriptions of, references to, or links to other products, publications or services does not constitute an endorsement, authorization, sponsorship by or affiliation with SL Advisors LLC with respect to any linked site or its sponsor, unless expressly stated by SL Advisors LLC. Any such information, products or sites have not necessarily been reviewed by SL Advisors LLC and are provided or maintained by third parties over whom SL Advisors LLC exercise no control. SL Advisors LLC expressly disclaim any responsibility for the content, the accuracy of the information, and/or quality of products or services provided by or advertised on these third-party sites.
All investment strategies have the potential for profit or loss. Different types of investments involve varying degrees of risk, and there can be no assurance that any specific investment will be suitable or profitable for a client’s investment portfolio.
Past performance of the American Energy Independence Index is not indicative of future returns.


Good article!