Fiscal Policy Moves Center Stage

/
I traveled down the east coast last week – stopping along the way to see clients. My first stop was Washington, DC to see Robert Dove, an old friend from high school in London and a long-time client. We can both still recite the school song in Latin, an obscure skill not as highly valued by today’s younger alumni. I was privileged to join Robert at the unveiling of a stamp honoring the late Ruth Bader Ginsburg.
Additional stops were made in Virginia, South Carolina and SE Florida on my way to Naples. I always enjoy meeting our investors.
Politics came up more than usual, because of the news. The House Republicans’ defenestration of speaker Kevin McCarthy must increase the odds of a government shutdown when the brief agreement he negotiated expires next month. Indeed, it’s hard to see how any incoming speaker can avoid this without suffering their predecessor’s fate. It might even be more likely than not.
Bond yields have been rising, but inflation expectations are not. The increase in real yields has prompted articles suggesting that the market’s reckoning with our dire fiscal outlook is finally at hand. The WSJ’s Grep IP is one of several journalists linking the two. A government shutdown more clearly demonstrates the absence of any fiscal middle ground than it does a pathway to resolution.
One of the most dramatic illustrations of the problem is that Federal interest expense is now expected to reach 3% of GDP in 2028 based on the Congressional Budget Office’s June 2023 long range projections. Less than a year prior, in July 2022, the 3% threshold wasn’t expected until 2030. Fed tightening is the reason.
The June 2023 outlook assumes a real yield on the ten year treasury of 0.9% next year and 1.6% for the rest of the decade. It’s currently 2.4%. Fed tightening has worsened our fiscal outlook. The FOMC would argue that a less hawkish policy response would have allowed longer term inflation expectations to become embedded at a higher level, pushing up long term yields even more. It’s unknowable. So far the real economy has been remarkably resilient to higher rates.
Canadian pipeline stocks have been relatively weak this year, including Enbridge (ENB), the biggest midstream company in North America. The market didn’t like their acquisition of three natural gas utilities businesses from Dominion Energy for C$19BN, partly financed by issuing C$4BN in equity. The S&P Dow Jones Utility Index is down 14% YTD. ENB, which increasingly shares their characteristic of stable, regulated returns, has been dragged down with the sector.
Except ENB sports a yield over 8%, roughly 1.5X covered by distributable cash flow. It’s true their leverage will rise uncomfortably once they close on their acquisitions, but the company is confident they’re on track to get back within their prior range of 4.5-5X with a dividend payout ratio of 60-70%.
ENB has raised their dividend for the past 28 years. Canadian management teams exhibit the Scottish Presbyterian conservatism that is part of the culture. During times of market stress, we’ve mused that some American companies could do better than being run by risk-loving Texans (see Send in the Canadians!)
ENB is certainly not overlooked but compared with the S&P500 which yields 1.4%, it looks pretty attractive.
Long ENB/short SPY looks like a good trade to this blogger. If bond yields keep rising, the broader market will fall, and if nothing dramatic happens there’s over 6.5% of positive carry on the trade. If rates fall ENB will look even more attractive. And if AI stocks recommence their ascent…well, there’s always a way for a trade to lose and that is probably it.
ENB’s high and growing dividend is a decent metaphor for the entire midstream energy infrastructure sector.
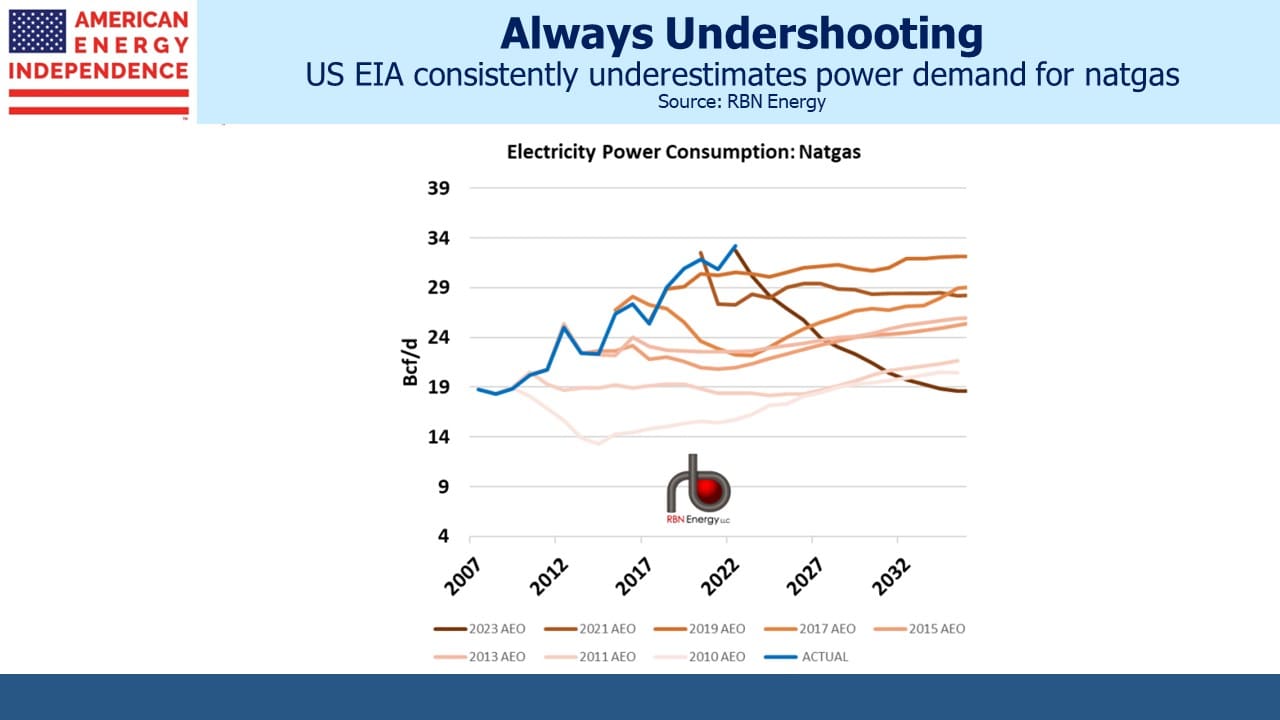
RBNEnergy noted some weaknesses in the Energy Information Administration’s (EIA) long term US natural gas consumption forecasts – they’ve been consistently too low, by an average of around 3 Billion Cubic Feet per Day for several years. Part of the reason is the EIA has been overly optimistic about renewables utilization.
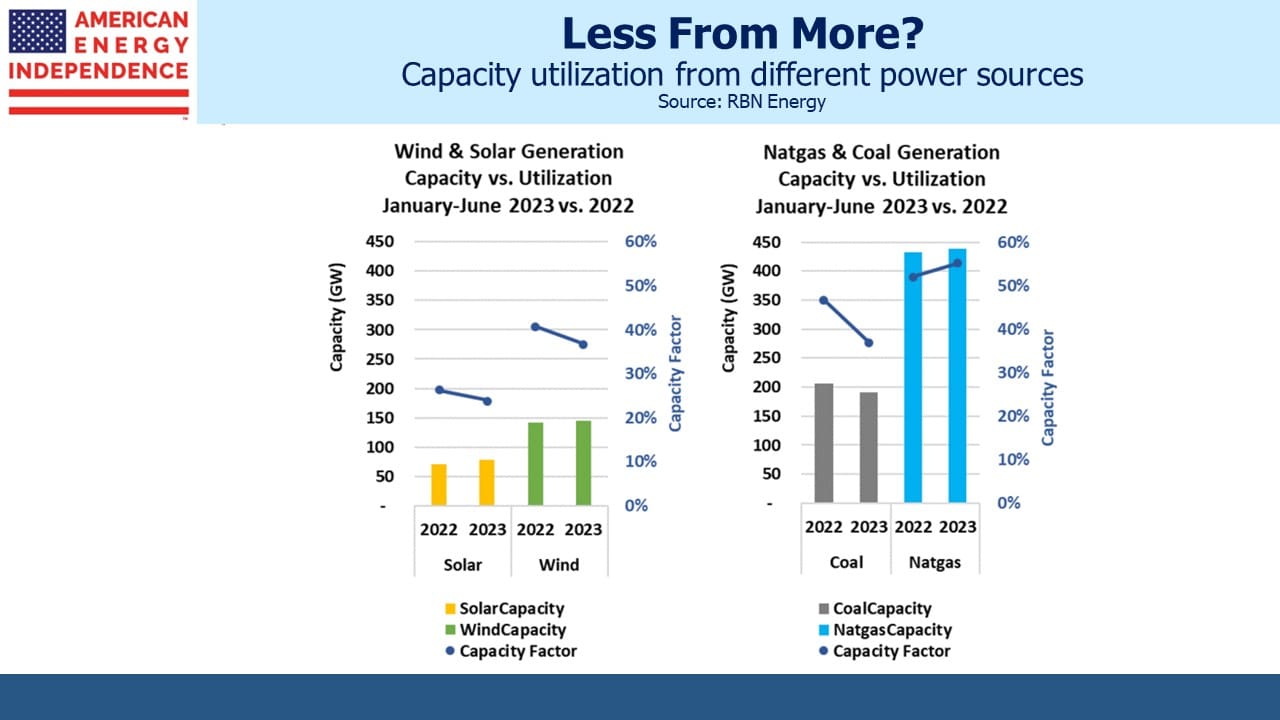
The past couple of years illustrate – comparing 1H22 and 1H23, solar and wind utilization both fell while natural gas rose. The problem of intermittency with weather-dependent energy remains a problem. Some states are enjoying good success with wind – notably Iowa which gets 55% of its electricity from this source. But the extended bear market in clean energy stocks and companies closely identified with renewables such as Nextera reflects a realization that it’s not an easy business. The declining utilization of existing solar and winds assets is another indication.
We three have funds that seek to profit from this environment:

Important Disclosures
The information provided is for informational purposes only and investors should determine for themselves whether a particular service, security or product is suitable for their investment needs. The information contained herein is not complete, may not be current, is subject to change, and is subject to, and qualified in its entirety by, the more complete disclosures, risk factors and other terms that are contained in the disclosure, prospectus, and offering. Certain information herein has been obtained from third party sources and, although believed to be reliable, has not been independently verified and its accuracy or completeness cannot be guaranteed. No representation is made with respect to the accuracy, completeness or timeliness of this information. Nothing provided on this site constitutes tax advice. Individuals should seek the advice of their own tax advisor for specific information regarding tax consequences of investments. Investments in securities entail risk and are not suitable for all investors. This site is not a recommendation nor an offer to sell (or solicitation of an offer to buy) securities in the United States or in any other jurisdiction.
References to indexes and benchmarks are hypothetical illustrations of aggregate returns and do not reflect the performance of any actual investment. Investors cannot invest in an index and do not reflect the deduction of the advisor’s fees or other trading expenses. There can be no assurance that current investments will be profitable. Actual realized returns will depend on, among other factors, the value of assets and market conditions at the time of disposition, any related transaction costs, and the timing of the purchase. Indexes and benchmarks may not directly correlate or only partially relate to portfolios managed by SL Advisors as they have different underlying investments and may use different strategies or have different objectives than portfolios managed by SL Advisors (e.g. The Alerian index is a group MLP securities in the oil and gas industries. Portfolios may not include the same investments that are included in the Alerian Index. The S & P Index does not directly relate to investment strategies managed by SL Advisers.)
This site may contain forward-looking statements relating to the objectives, opportunities, and the future performance of the U.S. market generally. Forward-looking statements may be identified by the use of such words as; “believe,” “expect,” “anticipate,” “should,” “planned,” “estimated,” “potential” and other similar terms. Examples of forward-looking statements include, but are not limited to, estimates with respect to financial condition, results of operations, and success or lack of success of any particular investment strategy. All are subject to various factors, including, but not limited to general and local economic conditions, changing levels of competition within certain industries and markets, changes in interest rates, changes in legislation or regulation, and other economic, competitive, governmental, regulatory and technological factors affecting a portfolio’s operations that could cause actual results to differ materially from projected results. Such statements are forward-looking in nature and involves a number of known and unknown risks, uncertainties and other factors, and accordingly, actual results may differ materially from those reflected or contemplated in such forward-looking statements. Prospective investors are cautioned not to place undue reliance on any forward-looking statements or examples. None of SL Advisors LLC or any of its affiliates or principals nor any other individual or entity assumes any obligation to update any forward-looking statements as a result of new information, subsequent events or any other circumstances. All statements made herein speak only as of the date that they were made. r
Certain hyperlinks or referenced websites on the Site, if any, are for your convenience and forward you to third parties’ websites, which generally are recognized by their top level domain name. Any descriptions of, references to, or links to other products, publications or services does not constitute an endorsement, authorization, sponsorship by or affiliation with SL Advisors LLC with respect to any linked site or its sponsor, unless expressly stated by SL Advisors LLC. Any such information, products or sites have not necessarily been reviewed by SL Advisors LLC and are provided or maintained by third parties over whom SL Advisors LLC exercise no control. SL Advisors LLC expressly disclaim any responsibility for the content, the accuracy of the information, and/or quality of products or services provided by or advertised on these third-party sites.
All investment strategies have the potential for profit or loss. Different types of investments involve varying degrees of risk, and there can be no assurance that any specific investment will be suitable or profitable for a client’s investment portfolio.
Past performance of the American Energy Independence Index is not indicative of future returns.


Leave a Reply
Want to join the discussion?Feel free to contribute!