Fiscal Policy Moves Center Stage
I traveled down the east coast last week – stopping along the way to see clients. My first stop was Washington, DC to see Robert Dove, an old friend from high school in London and a long-time client. We can both still recite the school song in Latin, an obscure skill not as highly valued by today’s younger alumni. I was privileged to join Robert at the unveiling of a stamp honoring the late Ruth Bader Ginsburg.
Additional stops were made in Virginia, South Carolina and SE Florida on my way to Naples. I always enjoy meeting our investors.
Politics came up more than usual, because of the news. The House Republicans’ defenestration of speaker Kevin McCarthy must increase the odds of a government shutdown when the brief agreement he negotiated expires next month. Indeed, it’s hard to see how any incoming speaker can avoid this without suffering their predecessor’s fate. It might even be more likely than not.
Bond yields have been rising, but inflation expectations are not. The increase in real yields has prompted articles suggesting that the market’s reckoning with our dire fiscal outlook is finally at hand. The WSJ’s Grep IP is one of several journalists linking the two. A government shutdown more clearly demonstrates the absence of any fiscal middle ground than it does a pathway to resolution.
One of the most dramatic illustrations of the problem is that Federal interest expense is now expected to reach 3% of GDP in 2028 based on the Congressional Budget Office’s June 2023 long range projections. Less than a year prior, in July 2022, the 3% threshold wasn’t expected until 2030. Fed tightening is the reason.
The June 2023 outlook assumes a real yield on the ten year treasury of 0.9% next year and 1.6% for the rest of the decade. It’s currently 2.4%. Fed tightening has worsened our fiscal outlook. The FOMC would argue that a less hawkish policy response would have allowed longer term inflation expectations to become embedded at a higher level, pushing up long term yields even more. It’s unknowable. So far the real economy has been remarkably resilient to higher rates.
Canadian pipeline stocks have been relatively weak this year, including Enbridge (ENB), the biggest midstream company in North America. The market didn’t like their acquisition of three natural gas utilities businesses from Dominion Energy for C$19BN, partly financed by issuing C$4BN in equity. The S&P Dow Jones Utility Index is down 14% YTD. ENB, which increasingly shares their characteristic of stable, regulated returns, has been dragged down with the sector.
Except ENB sports a yield over 8%, roughly 1.5X covered by distributable cash flow. It’s true their leverage will rise uncomfortably once they close on their acquisitions, but the company is confident they’re on track to get back within their prior range of 4.5-5X with a dividend payout ratio of 60-70%.
ENB has raised their dividend for the past 28 years. Canadian management teams exhibit the Scottish Presbyterian conservatism that is part of the culture. During times of market stress, we’ve mused that some American companies could do better than being run by risk-loving Texans (see Send in the Canadians!)
ENB is certainly not overlooked but compared with the S&P500 which yields 1.4%, it looks pretty attractive.
Long ENB/short SPY looks like a good trade to this blogger. If bond yields keep rising, the broader market will fall, and if nothing dramatic happens there’s over 6.5% of positive carry on the trade. If rates fall ENB will look even more attractive. And if AI stocks recommence their ascent…well, there’s always a way for a trade to lose and that is probably it.
ENB’s high and growing dividend is a decent metaphor for the entire midstream energy infrastructure sector.
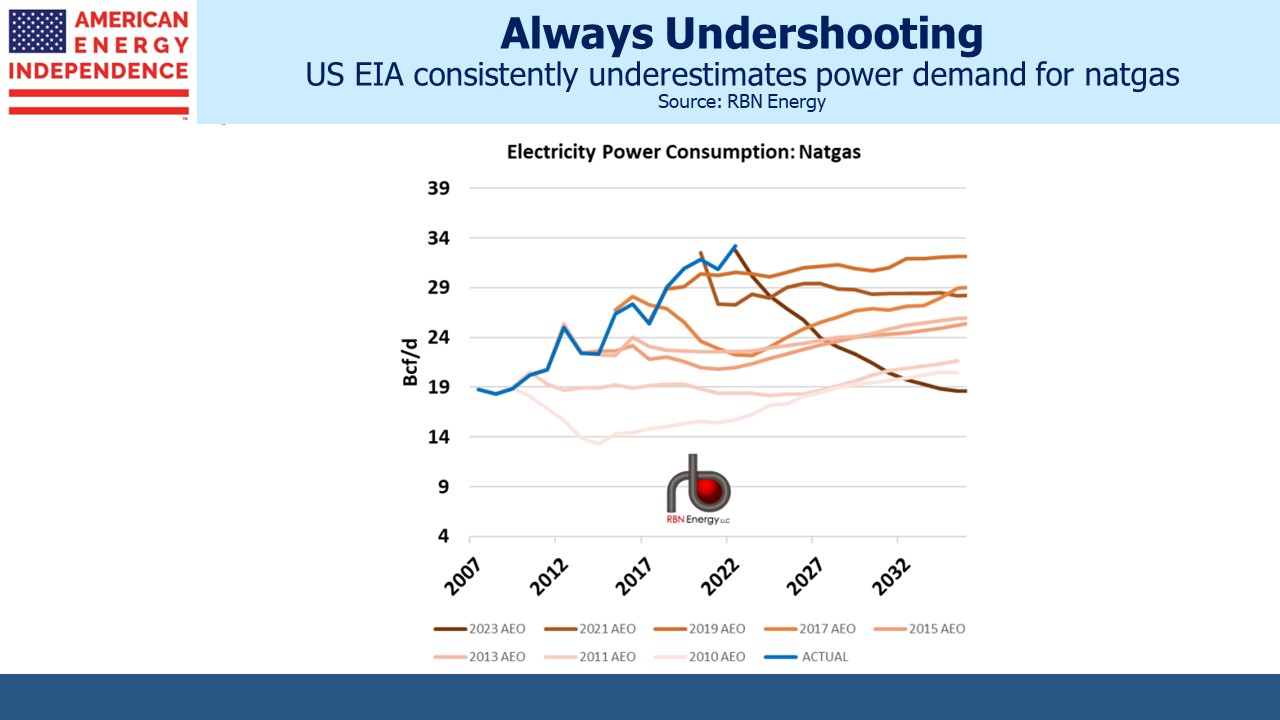
RBNEnergy noted some weaknesses in the Energy Information Administration’s (EIA) long term US natural gas consumption forecasts – they’ve been consistently too low, by an average of around 3 Billion Cubic Feet per Day for several years. Part of the reason is the EIA has been overly optimistic about renewables utilization.
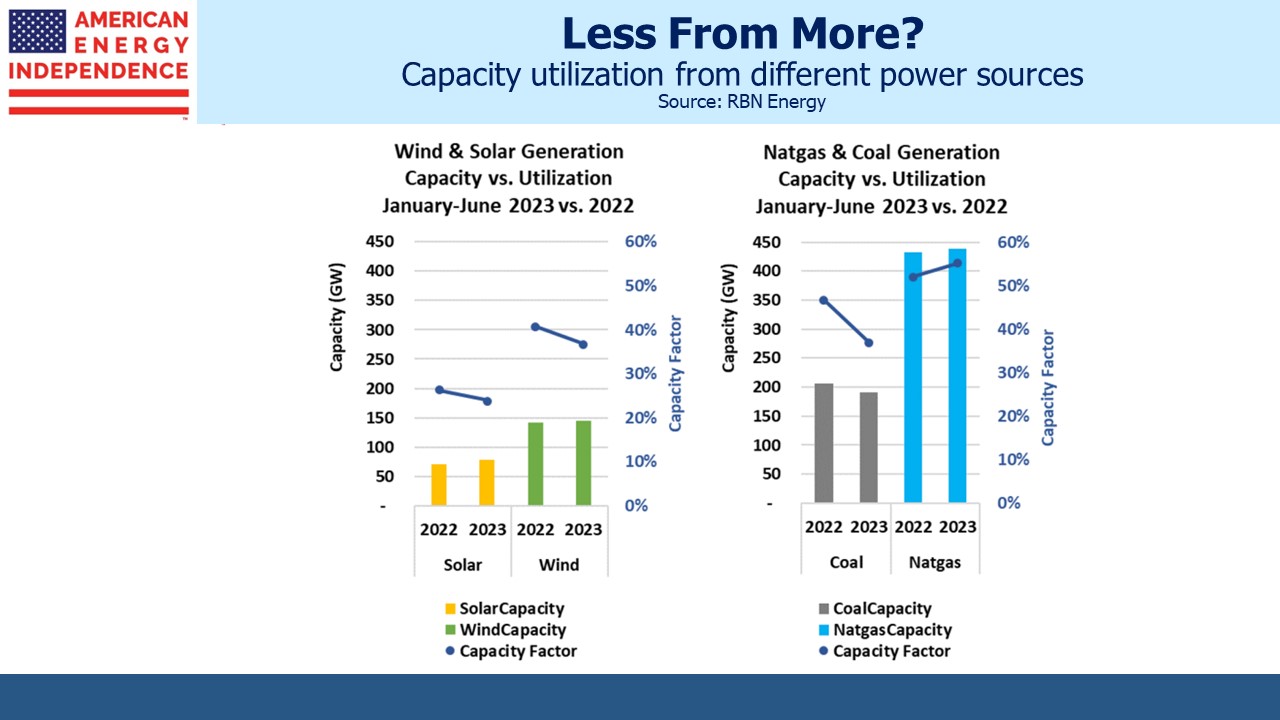
The past couple of years illustrate – comparing 1H22 and 1H23, solar and wind utilization both fell while natural gas rose. The problem of intermittency with weather-dependent energy remains a problem. Some states are enjoying good success with wind – notably Iowa which gets 55% of its electricity from this source. But the extended bear market in clean energy stocks and companies closely identified with renewables such as Nextera reflects a realization that it’s not an easy business. The declining utilization of existing solar and winds assets is another indication.
We three have funds that seek to profit from this environment:


