Natural Gas Liquids — the Lesser Known Side of the Shale Revolution

Many people think of fossil fuels as coal, crude oil and natural gas, with the nastiness of their toxic emissions lying in that order. Among the less colorful comments during the second Presidential debate was Hillary Clinton’s reference to natural gas as a “bridge” fuel, sitting between today’s reliance on hydrocarbons and a future of renewables (solar, wind and so on). Methane (or, to use its Chemical symbols, CH4 since it combines four hydrogen atoms with one Carbon atom), is colloquially known as natural gas, and is the simplest and cleanest burning fuel.  It  is helping the U.S. limit its carbon footprint since as the Shale Revolution has made it plentiful domestically, it’s replacing far dirtier coal as the fuel of choice for power plants.

Natural Gas Liquids (NGLs) are a set of hydrocarbons that lie between Methane (also called “Dry” Gas”) and the lightest blends of crude oil (such as Naphtha). Methane is often extracted mixed with NGLs and crude oil.  It’s used for residential gas stoves and heating, electricity generation and, when chilled to -260F turns to Liquid Natural Gas (LNG) in which form it can be transported by ship. The mix of NGLs and oil found in a well with methane affects the value of the play since after being separated from the dry gas the NGLs can be put to other purposes.  “Wet” gas wells that contain more NGLs often generate more attractive returns as NGLs fetch higher prices.

The energy infrastructure business provides the ability to gather and process the mix of hydrocarbons into Gas, NGLs and Crude Oil.  Dry gas then is piped to customers, crude oil heads to storage & refiners, and NGLs are sent to fractionation plants.  By exploiting their different boiling points the NGLs are then separated into into their components: Ethane (C2H6), Propane (C3H8), Butane(C4H10), Iso-Butane (C4H10 with tertiary carbon), and natural gasoline (C5+). Although NGLs are gases, their production is usually expressed in barrels a day, like oil. The conversion is based on energy equivalence, so a barrel of an NGL has the same energy output measured in BTUs (British Thermal Units) as a barrel of oil. Nothing gets moved in barrels anymore, but the industry has retained it as a common measure of volume.

Although often ignored, NGLs are significant. The U.S currently produces 3.6MMBD (Millions of Barrels a Day) of NGLs.  Compare this with U.S shale oil production of 4.5MMBD  and it’s a big business in its own right.

Ethane is most readily found with methane, although it’s also a by-product of refining crude oil. Some portion of ethane can be left in the gas stream for residential and commercial use if its price doesn’t justify separating it out. However, by far its most important use is as a feedstock for petrochemical plants to produce polyethylene, the most commonly created organic compound in the world. It winds up as plastics in various forms with thousands of ultimate uses across consumer products as packaging, containers, plastic bags carpeting and clothing (including swimwear). As the U.S. steps up its production of ethane, the low price caused by America’s shift towards energy independence is leading to a substantial cost advantage in polyethylene production. Currently the U.S produces 1.3MMBD of ethane.

Credit for the first industrial synthesis of polyethylene generally goes to Imperial Chemical Industries (ICI) in the UK in 1933.

Propane exists as a gas at temperatures above -44F, but turns to a liquid under pressure when it occupies 1/270th of the space, allowing it to be stored in propane tanks and bottles (such as the one under your gas grill outside).  It has many other uses as a fuel from heating homes (particularly mobile homes which often lack a permanent connection to the local gas supply) to drying crops.  The U.S produces 1.15MMBD of Propane. Butane is the fuel in pocket lighters, the propellant in aerosols, and is blended with gasoline during the summer to reduce pollution (it’s the vapors that come out while you’re pumping).  Iso-butane is primarily used to increase the octane in gasoline while making it cleaner burning.  The U.S produces 300MMBD each of butane and i-butane.

The chart below shows forecast growth in NGLs (referred to as “Natural Gas Plant Liquids”) provided by the U.S. Energy Information Administration (EIA) in their 2016 Annual Energy Outlook.

The first point of this brief summary on NGLs is to illustrate that the composition and uses of the hydrocarbons we produce vary enormously. Master Limited Partnerships (MLPs) own and operate the pipelines, storage assets and processing facilities that handle this output, which includes providing treatment and separation of methane from the NGLs with which it’s found.  They process the mixed NGLs into their individual components, providing storage and then transportation of the pure products to their end users.

The second point is that, just as natural gas and crude oil production look set to continue growing in the U.S., so does NGL output. Their increasing use is another side to the story of energy independence. Moreover, exports are increasingly driving this growth; as recently as 2014 the U.S. was a net importer of ethane, and marine exports were not considered economically viable.

According to the EIA, U.S. production of ethane and propane have substantially exceeded demand in recent years. This has led to ethane at times being “rejected,” meaning some portion of it is left with the methane in the natural gas supply rather than being separated out. But the growing supply of ethane has also has led to significant investments in petrochemical plants and export capacity.

Ethane exports were non-existent before 2014 when two pipelines  came online to ship it to petrochemical complexes in Canada.  Pembina’s (PBA) Vantage pipeline recently added 70KBD (Thousands of Barrels a Day) of capacity from North Dakota,  and Sunoco Logistics (SXL) moves  50KBD from their Mariner West line in southwestern Pennsylvania. In March of this year the first waterborne ethane left SXL’s Marcus Hook terminal on the Delaware River just south of Philadelphia, headed for Norway. Subsequent shipments for Norway have also left  from Texas. Just as the U.S. is selling methane to the Middle East, a region not exactly short of it (see Coals to Newcastle), we’re able to sell to Norway even though they produce almost 4MMBD equivalent of crude oil, NGLs and natural gas.

In July, refrigerated ships began taking ethane from Enterprise Products Partners’ (EPD) 200KBD Morgan’s Point terminal, now the largest ethane export facility in the world, on the Houston Ship Channel. We are in the middle of the ramp-up now as ethane export capacity is expected to increase from 65KBD in 2015 to almost 400KBD by the end of next year.  Additionally, Kinder Morgan’s (KMI) 50KBD pipeline from eastern Ohio is expected to come online early 2018.  Adding in propane & butane docks, the U.S will have waterborne Liquid Petroleum Gas (LPG, NGLs when they’re condensed to liquid form for transport) capacity of 1.5MMBD by 2017.  This includes  1.2MMBD on the gulf coast held by Targa Resources (TRGP), EPD, Phillips 66 (PSX), Occidental Petroleum (OXY), and SXL. There’s an additional 275KBD in the northeast being developed by Energy Transfer Partners (ETP) and SXL. In other words, there’s a lot of energy infrastructure being built that will increase MLP cashflows.

Domestic processing of ethane into ethylene has risen by almost a third in the last three years. Demand from ethylene producers for ethane feedstock is expected to soak up another 600KBD in the next five years, a more than 50% jump from today’s level.  Propane can be converted into polypropylene, with similarly wide application in plastics to polyethylene although polypropylene is produced as a clear plastic whereas polyethylene is opaque, like a milk jug. Polypropylene production capacity has tripled since 2013 and is expected to consume another 135KBD of propane in the next five years. With all the new demand for NGLs, pipeline capacity is being expanded in multiple regions. Examples include Oneok Partners’ (OKS) Bakken NGL network; EPD’s Aegis system on the Gulf of Mexico and EPD’s ATEX line from the Northeast to the gulf; SXL’s Mariner East line.

New pipelines are being built, such as KMI’s Utica Marcellus Texas pipeline, and idle ones re-purposed, including a JV between EPD and Marathon Petroleum (MPC) called  Centennial. Another example is NuStar’s (NS) Mont Belvieu line to Corpus Christi.

The picture of widespread investment in new midstream energy assets is clear enough. Last year’s sellers of MLPs gave no heed to the secular theme that is unfolding.

The chart below shows how the petrochemical industry is gearing up to process increasing volumes of ethan and propane into plastics.

Natural gas and crude oil for power generation tend to dominate the headlines about the Shale Revolution. But the associated production of NGLs and their use in wide-scale production of plastics represents a growing and increasingly important part of the economics of domestic hydrocarbon production. Fully utilizing this resource is another driver of demand for new energy infrastructure, another source of growth for MLPs. Unsurprisingly, we are invested in many of the names listed, often through their General Partner (GP) since that’s where the returns to growth are best realized. Of the names mentioned above, we are invested in the following:

EPD, Energy Transfer Equity (ETE, GP of ETP and SXL), KMI, NuStar GP Holdings (NSH, the GP of NS), Oneok (OKE, the GP of OKS), PBA, PSX (GP to PSXP) and TRGP.


U.S. Natural Gas Exports Taking Off

A couple of months ago we wrote about how the U.S. had sent a shipment of Liquid Natural Gas (LNG) to the United Arab Emirates (see Coals to Newcastle). The notion of natural gas being extracted under a field in Pennsylvania, processed and then transported by pipeline to Louisiana, chilled and condensed to liquid form, loaded onto an LNG tanker and then sent to a part of the world that’s the world’s major hydrocarbon supplier is amazing. It probably reflects better than most things how the worlds of natural gas and crude oil have been upended by the Shale Revolution. So far this year, U.S. sourced LNG has also shipped to Brazil, Chile, Portugal, China, India, Jordan and Kuwait.

Ten years ago when the U.S. was importing around 10 BCFD (Billion Cubic Feet per Day) of natural gas, the idea that some of that would arrive by LNG tanker was uncontroversial. Cheniere Energy began planning facilities such as Sabine Pass to accommodate such flows. As natural gas became steadily more abundant in the U.S., Cheniere reversed themselves and planned for its export via LNG tanker. Although their chosen site had deep water access and connectivity to the domestic network, switching a facility from LNG imports to exports isn’t trivial. Former Cheniere President Charif Souki, who led the company through this metamorphosis, is one of the industry’s most colorful characters.


The U.S. is within sight of being a net exporter of natural gas. Additional LNG export facilities are at various stages of development. However, other countries are also increasing their export capability and it’s quite possible the world will have more LNG available than it needs for several years. So far, virtually all the shift in the U.S. balance of trade in natural gas has taken place through pipelines. Canada has long been a net exporter to us although flows go both ways and our net imports from Canada are down by almost half in ten years. We’ve exported to Mexico for thirty years but in recent months volumes have really taken off. Early last year exports to Mexico exceeded those to Canada and the gap keeps growing.

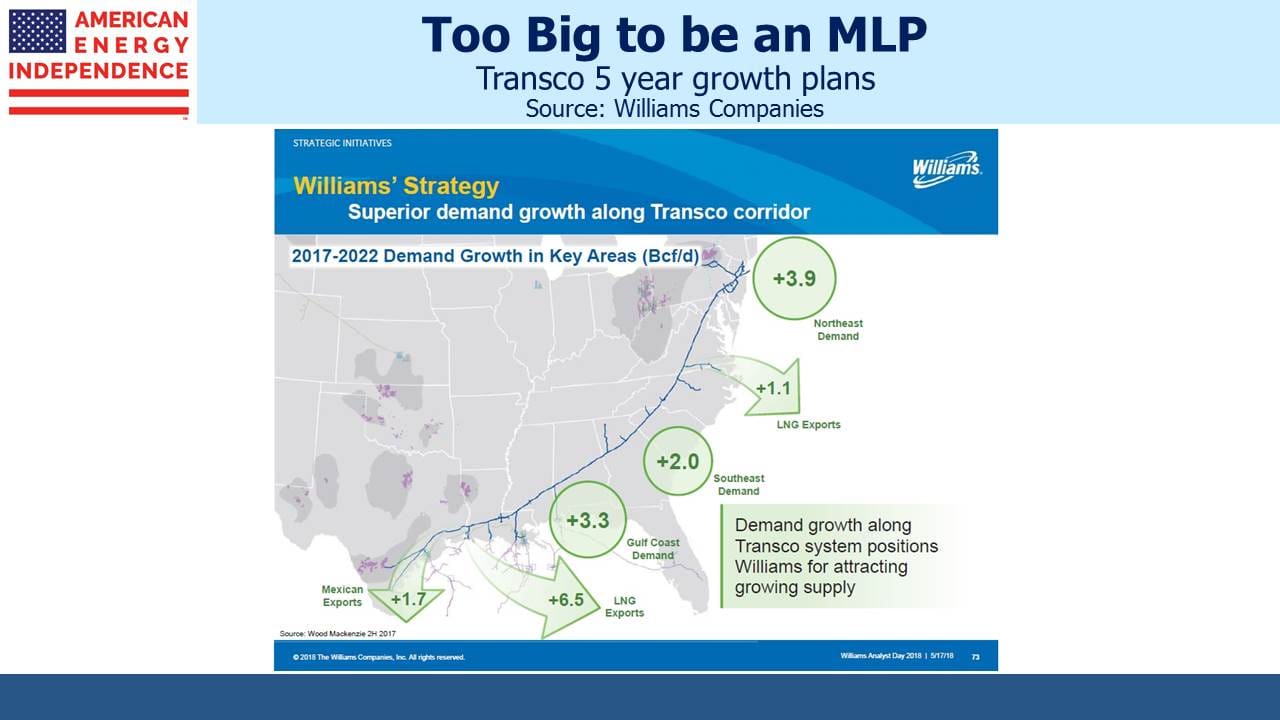
Several new pipeline projects are at various stages of development. Between supplying gas for LNG export facilities and increasing Mexican exports, there’s a lot of energy infrastructure being built. One of the clear beneficiaries is Williams Companies (WMB), whose Transco pipeline is the main recipient of their capital expenditures to accommodate growing demand.

But other midstream infrastructure companies involved in Mexican trade include TransCanada (TRP), Spectra (SE), Energy Transfer Equity (ETE) and Oneok (OKE).

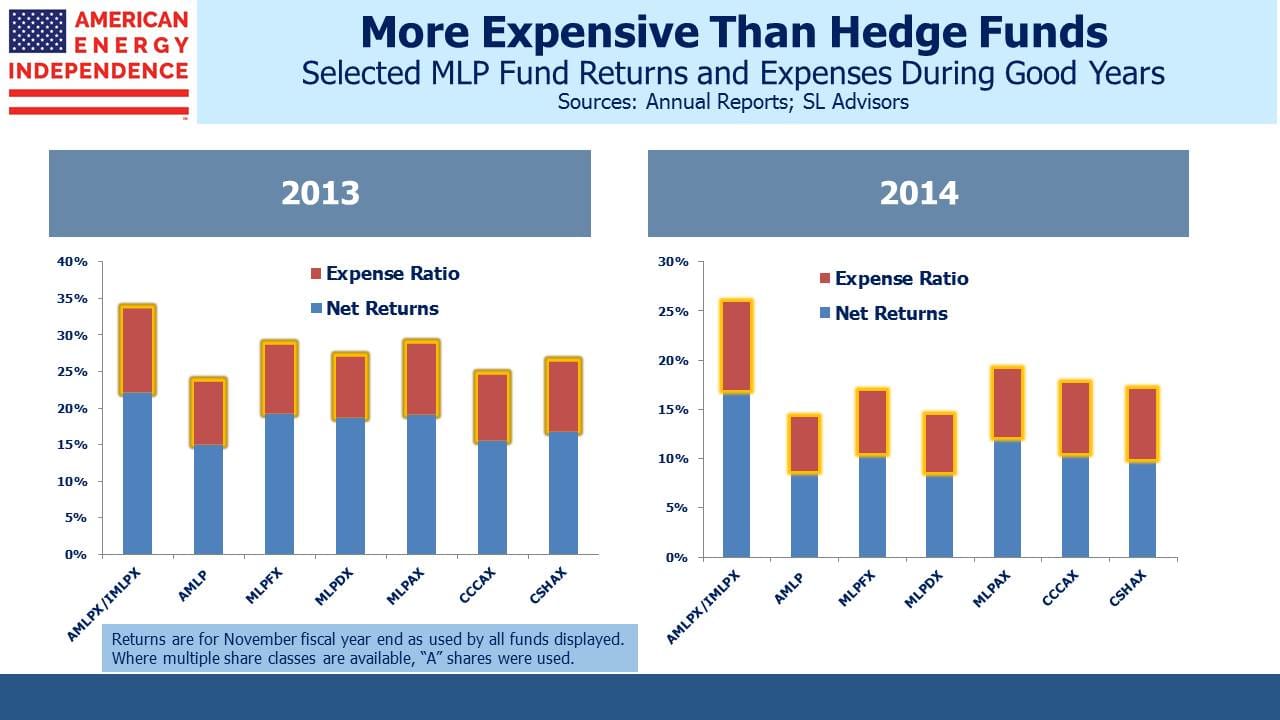
In many cases their Master Limited Partnership (MLP) will build the assets and then share the Distributable CashFlow with their General Partners (GPs) via Incentive Distribution Rights as is common. This asset growth will benefit the GPs. Just as asset growth for a hedge fund benefits the hedge fund manager, or GP, so does asset growth for an MLP benefit its GP. An MLP GP is like a hedge fund manager.

We are invested in ETE, OKE, SE, TRP and WMB

OPEC Blinks

OPEC Blinks

Last week OPEC announced a plan to reduce their crude oil production, from August’s level of 33.23 MMB/D (Million Barrels a Day) to somewhere between 32.5 and 33 MMB/D. The last time OPEC agreed to curb output was in 2008.

Healthy skepticism correctly greets OPEC’s pronouncements on production curbs. Saudi Arabia is the only country with much ability or desire to manage output and therefore prices. A cartel that controls a third of global output is hardly in much control, and widespread cheating over the years has not helped to create an environment of mutual trust among OPEC’s members. Nonetheless, there’s no doubt that some type of accord to reduce output is in their interests given the relative inelasticity of oil supply over even the intermediate term. So the fact that the Saudis and Iranians keep coming together for talks, albeit inconclusive perhaps until recently, illustrates that they’d both like to get to an agreement.

It’s interesting to review how we got here from $100 oil just over two years ago. In 2014 Plains All American used the chart below in their investor presentations, and it neatly encapsulates the dilemma facing OPEC at that time. New global demand was increasingly being satisfied by North American producers. In fact, the 3MMB/D Cumulative Demand Growth from 2011-14 in this chart pretty much matches the increase in U.S. shale oil output over the same period of time. OPEC, or the Saudis, recognized that they were losing market share to the upstart, high cost U.S. shale industry and decided to expose its cost structure.

What follows is a great story of American ingenuity. Although financial pain and bankruptcies continue to occur in the U.S. energy sector, Exploration and Production (E&P) firms have furiously innovated, discovered new technological enhancements, demanded cost reductions from their service providers and adapted to oil under $50 a barrel. Consequently, while U.S. shale oil production dipped it remains around the levels it was in 2014.

The oil rig count shows signs of bottoming, and U.S. production was already looking as if it may not drop much further before last week’s announcement. The rig count chart shows that the industry has cut its use of rigs by 75%, reflecting substantially improved operating efficiencies.

The asymmetry is quite delicious; the governments of almost half the world’s oil production (since Russia is also sporadically involved in discussions around output) regularly meet to plot the path back to higher oil revenues. Meanwhile the U.S., whose output ostensibly caused the supply imbalance, doesn’t even have an official view on U.S. oil production. Private industry representing the U.S. at its best is combining technological expertise, access to capital, a relentless drive to cut costs and raw entrepreneurialism. The Saudi’s have little to show for their strategy of increasing output beyond steadily depleting their stock of financial assets as they draw on them to fund a gaping budget deficit.

The Saudis may have simply concluded that enough is enough. Or they may be considering the long game. Conventional new supply comes online slowly, typically requiring several years of development. The $1TN of reductions in capex for exploration (see Why Oil Could Be Higher for Longer) run the risk that the roughly 6MMB/D of new supply that’s needed annually to meet depletion and new demand won’t be there at anything close to current prices. There’s some risk of a substantial run-up in prices 2-5 years out. Allowing prices to rise now can stimulate new exploration and reduce the risk of such an imbalance.

Whatever the OPEC strategy, the clear beneficiaries will include the U.S. shale oil industry and the infrastructure providers that support it. They have the shortest reaction time, and can bring on new supply within a couple of quarters or so. By acting as the swing producer, U.S. production will impede the higher price that would make other conventional projects viable. As the Saudis are learning, it’s not good to bet against the American private sector.


Gallic Justice

In 2008 Jerome Kerviel, a trader at Societe Generale, cost his employer €4.9BN when his unauthorized trading spectacularly blew up. Kerviel was sent to prison and assessed €4.9BN in damages. Last week, a French court reduced the damages claim to just €1MM, on the basis that the bank’s poor controls were to blame.

Implausibly, back in June Kerviel also won a wrongful dismissal suit against SocGen that awarded him €400K. Although he had accumulated positions that were nearly twice the value of the entire bank, the tribunal found that he was fired, “without real and serious cause”. And yet, even had SocGen refrained from this most reasonable action and not fired him, Kerviel would nonetheless have been unable to show up for work because he was in prison. Therefore, the tribunal presumably believes this extended absence from his place of work would also have been insufficient grounds for dismissal. You just can’t make this stuff up.

There's More to Pipelines Than Oil

If I had $1MM for every time an MLP investor has asked me where crude oil is going, well I could probably buy a good chunk of Plains All American (PAA), the biggest crude oil pipeline operator in the U.S.

But PAA aside, MLPs are not as closely aligned with crude oil as popularly believed. The charts below show in raw numbers how many miles of U.S. pipelines are dedicated to crude oil, refined products, Natural Gas Liquids (NGLs) and natural gas. We have over 2 million miles of transmission capacity for natural gas. While a good portion of that travels the last few yards to a residence or business, almost 1.3 million miles is classified as “Distribution Main” mileage. On pure miles of pipeline, natural gas swamps anything else. Their owners are diverse and include utilities as well as MLPs. The network of gas pipelines has been growing, to accommodate America’s increasing use of natural gas for heating, electricity generation and other industrial uses.


The Energy Information Administration (EIA) counts 300,000 miles of inter-state and intra-state transmission pipelines which are largely controlled by MLPs.


We have over 200,000 miles of pipelines carrying hazardous liquids, which are roughly evenly split amongst petroleum/refined products, NGLs (referred to as HVLs) and crude oil. The last two categories have been responsible for the growth in this sector.


We’re also storing more NGLs too, and the chart below shows a recent jump in storage capacity (measured in Millions of Barrels).


Meanwhile, spending on new infrastructure has continued although the 2015 MLP Crash did lead to the deferral of some projects. There have also been some notable cancellations because of the often complex approval process. Kinder Morgan (KMI) halted their North East Direct project because they were unable to obtain enough capacity commitments. This was in part because in Massachusetts there’s no financial incentive for a utility to secure long term supply, which limited their interest in signing up for pipeline capacity. Access Northeast, another effort to improve distribution and storage for New England under the direction of Spectra Energy (SE), may also be cancelled for similar reasons. A surprising consequence is that Boston now imports Liquified Natural Gas (LNG) by ship for use in winter, even while the U.S. is beginning to export it. LNG has to be liquefied for storage and regassified for use, a not trivial expense borne by the helpless consumers in the region.

It’s not uncommon to hear energy sector executives complaining about the present Administration and their opposition to fossil fuels. The increases in crude oil and natural gas production over the past eight years weaken the case for critics, although the drawn out and eventual cancellation of the Keystone pipeline project did not reflect an enlightened energy policy. More recently, the Dakota Access Pipeline (DAPL) project run by Energy Transfer Partners (ETP) has been the victim of some hostile and possibly illegal moves by the Administration. It is too long a story to recount, but a good description is on Forbes (see Why The DOJ Order To Shut Down Construction On The DAPL Pipeline is Legally Indefensible). While the opposition to new projects such as this hurts many unwitting participants including consumers who’d benefit from cheaper energy, such difficulties can only enhance the value of existing infrastructure. Given the unpredictability of the approval process as shamefully on display in the DAPL case, a new build looks ever more daunting compared with extracting higher returns out of existing assets.

In fact, on this point we recently ran across a very old documentary (sometime in the 1950s) highlighting the Transcontinental Gas Pipe Line Corporation as it traverses from Texas north through the eastern U.S. to New York City. If you have twenty five minutes to spare it’s worth watching. It reminds how energy infrastructure has a useful life of decades and is in many cases impossible to replicate as communities develop around and over it. Today Transco, as it is called, belongs to Williams Companies (WMB).

What has changed over the past couple of years is that the planned new infrastructure dedicated to natural gas has grown while crude oil projections have fallen, as forecast by the Interstate Natural Gas Association of America (INGAA). The charts below compare 2014 and 2016. The prospect of MLPs investing approximately two times their current market capital in new projects over the next twenty years hasn’t been much altered. MLPs and crude oil are gradually disengaging (see MLPs and Crude Oil, the Improbable Dance Partners). Just as hedge fund asset growth is good for hedge fund managers, MLP asset growth should be good for MLP General Partners. At a time when the Federal Reserve continues its benign interest rate policy of wealth transfer from savers to borrowers (see The Shrinking Pool of Cheap Assets), MLPs remain one of the few asset classes to offer attractive valuations.

We are invested in KMI, SE and WMB


Growing Without Paying For It

Investors in Master Limited Partnerships (MLPs) like their distributions to be reliable and, by comparison with other asset classes, generous. Investors in the General Partners (GPs) that control them hold a more discerning view on value creation. Last month we highlighted how Williams Companies (WMB) was giving its MLP investors in Williams Partners (WPZ) what they want (reliable, high distributions) while also meeting the different needs of WMB investors for total return (see Williams Satisfies Two Masters).

The slide below from a recent WMB investor presentation lays it out nicely. WMB has two sources of cashflow – LP distributions from WPZ (since it owns WPZ units) and Incentive Distribution Rights (IDR) related cashflows from their GP interest. These two items are expected to generate 1.2BN and $1BN respectively for WMB over the next twelve months.

Move right across the bar chart and they’re planning to invest $1.3BN annually in new projects, by investing in new units of WPZ. These new WPZ units will generate additional IDRs through WMB’s GP interest. Working through the numbers, WPZ will supplement the $1.3BN it receives for selling new units to WMB with $1.2BN in debt, giving it $2.5BN to invest in new projects.

We know from other regulated projects that WPZ’s minimum IRR target is 15% on invested capital. The table below shows how this cashflow will divide up. WMB receives on average 32% of WPZ cashflows (i.e. the $1BN GP take is 32% of the $3.1BN total WPZ Distributed Cash Flow, the left-most bar on the chart). So WMB should expect 32% of the project’s cashflows and WPZ LP unitholders 68% up to a 9.4% return on the LP units (the current yield on WPZ). Thereafter, since the GP is at the 50% level on IDRs, the excess cashflow is split equally.

The total IDR take for WMB from the $2.5BN WPZ capital outlay is $131MM, representing a 13.1% growth rate on its current $1BN GP IDR receipts. WMB can if it chooses sell the $1.3BN in WPZ LP units acquired into the open market at a time of its choosing, thus winding up with no net cash outlay in exchange for this growth.

So what’s it worth? The LP cashflows are pretty straightforward. $1.2BN in WPZ distributions less the $300MM in cash operating costs leaves $900MM, valued at the market yield on WPZ units of 9.4% gives $9.6BN.

WMB’s market cap is $22.4BN, so the GP stake is being valued at $12.8BN ($22.4BN – $9.6BN), or 11.3X next year’s cashflow. This looks cheap compared to other transactions. For example, Marathon (MPL) acquired MarkWest last year at an implied GP multiple of more than twice this, according to figures from Wells Fargo. And our analysis here only assumes GP IDR growth from new projects; it gives no credit to growth from WPZ’s substantial existing asset base. So we think the 13.1% growth rate on the GP IDRs is conservative. In effect, WMB can grow its GP IDR-derived cashflow without having to pay for it.

We think on this basis that WMB is undervalued.

We are invested in WMB.

Controlling Assets Without Buying Them

On Tuesday morning, Enbridge (ENB) and Spectra (SE) revealed how they’d spent the Labor Day weekend by announcing their merger. After the highly contentious and ultimately unconsummated Energy Transfer/Williams soap opera, it was a welcome surprise to see two large energy companies join their businesses agreeably, without rancor.

Although the financial media excitedly covered the union, investors in the Master Limited Partnerships (MLPs) controlled by ENB and SE might well have wondered what’s in it for them. In another demonstration that the General Partner (GP) is where the action is, their long list of affiliated MLPs enjoyed only muted revaluation at best. The combined ENB/SE will control (among others) Spectra Energy Partners (SEP), Enbridge Energy Partners (EEP) and Midcoast Energy Partners (MEP). Yet since control of the MLP lies with the GP rather than the Limited Partners (LPs), there was no need to acquire the MLPs.

Not only did SEP investors not see a bump in their stock price, but SEP’s price fell as the market reflected its greater use as a source of funding for the $26BN combined capex program scheduled 2017-19. One of the MLPs, EEP, has a cap on its Incentive Distribution Rights (IDRs, the fees paid to the GP) of only half the limit set for SEP. This makes it potentially attractive for EEP to be rolled up into SEP where the more generous SEP IDR structure would apply to its cashflows. GPs always have options.

Suppose two big hedge fund managers merged. To avoid any confusion we’ll use fictitious names of two already successful firms, Masters of the Universe (“Masters”) and Kings of the Cosmos (“Kings”). The owners of Masters and Kings would rightly celebrate, since they anticipate many operating efficiencies as well as synergies by working more closely together. Clients of the hedge funds run by Masters and Kings would gamely cheer the union as well, reasoning that a good financial event for the stewards of their capital surely couldn’t actually be bad for the clients, even if no objective evidence supports such warm feelings. Principals from Masters and Kings would reach out to significant clients and explain their new growth strategy as “win-win”, “good for all concerned” and “driven by partnership philosophy.”  In fact, a good rule as an investor is to recognize that when a money manager refers to his clients as “partners” (think hedge funds and private equity) the fees look less partner-like and more wealth-transfer-like.

Masters and Kings will use their now larger aggregate Assets under Management (AUM) to grow their investment strategies to the limits of their capacity and beyond. They’ll rely on the Large Size = Highly Successful = Defensible Decision thought process of new investors and their consultants. The original clients’ misplaced earlier happiness is rewarded with lower returns.

It’s not a perfect analogy. MLP investors are generally treated far better by MLP GPs than are hedge fund and private equity clients. And hedge fund managers rarely merge, although size and performance reliably follow opposite paths.  But the ENB/SE merger is about synergies, faster cashflow growth and stability from diversification. The affiliated MLPs’ main purpose in life is to provide cheap capital to support the GP’s growth plans. A skillful GP generates MLP returns just sufficiently attractive to keep investors returning, but anything in excess is wasteful. When an MLP yield falls from, say, 7% to 5%, the corresponding strong price performance cheers its investors. However, to the GP the resulting low yield on its MLP creates an imperative to cash in by issuing equity cheaply to fund more growth. A GP who allows the yield on his MLP to fall too far is missing an opportunity to issue equity. Investment bankers rarely fail to point this out.

We like the ENB/SE merger, but that’s because we’re invested in ENB and SE rather than any of the affiliated MLPs. We also note that Williams Companies (WMB) continued the rally that followed its escape from the altar with Energy Transfer. The 11.4X Price/Distributable Cash Flow multiple of WMB looks attractive relative to SE’s 25.3X, more so following ENB’s willingness to merge at that valuation.

We are invested in ENB, SE and WMB

blog-september-11-2016-image-v2

MLPs and Crude Oil, the Improbable Dance Partners


Talk about MLPs nowadays and pretty soon you’ll get to crude oil. Few will quickly forget the collapse in crude from 2014 that led to the collapse in MLPs. To be an MLP investor seemingly requires a view on the price of what moves through their infrastructure (although only 7% of pipelines in the U.S. carry oil; natural gas, natural gas liquids and refined products are more dominant).

Since pictures can be more eloquent, we’ve produced some visual insight to the long term relationship between the two. Going back to 1996 (the start of the Alerian Index) crude and MLPs have sometimes moved together and sometimes not. However, an investor who had the foresight to call oil’s sometimes violent but ultimately limp twenty year move from $19.50 a barrel to $43 today might have been dissuaded from buying MLPs. He would have missed a thirteen fold increase in value.

However, we’re not trying to forecast the level of one from the other but their respective returns (forgive me, their first derivatives). How will changes in crude oil affect returns to MLP investors? Both have moved up over twenty years, but not always together as the second chart shows.

And the third chart confirms what we all knew anyway, which is that their returns have become more correlated. In fact, the past couple of years have seen a dramatic shift in the relationship. In June 2014 the correlation was 0.1, which is to say there was effectively no relationship at all. Since then it has tightened to levels last seen in the 2008 financial crisis, when everything apart from government debt was falling.

Having examined the past, what can we conclude going forward? First, correlations tend to mean-revert, and it’s not a big leap to suggest that MLPs and crude oil will decouple to some extent. The three month correlation of daily returns (not pictured here) is more sensitive than the 12 month correlation we’ve used, and it shows that the relationship has weakened in recent weeks.

Another point to note is that correlations across asset classes in general are moving up. Stocks and bonds have both been registering new highs. As MLPs have recovered from their February low they become more highly correlated with both asset classes (although at still 35% off their old August 2014 high a switch from almost anything into MLPs looks attractive). And in fact, MLPs have demonstrated a more meaningful relationship with stocks both recently and over twenty years. So the more pertinent question for the potential MLP investor is to ask where stocks are going, but perhaps that seems both obvious and unanswerable, so attention shifts back to crude.

We think the correlation will come down from current levels. But as U.S. hydrocarbon production increases our economy will gradually enjoy less of a consumption boost when crude oil falls. Traditionally, cheaper gasoline has been regarded as a tax cut, but many economists were surprised at the muted boost to consumption that we saw last year.

We also think the long term outlook for crude oil is positive. $1TN of cuts in drilling budgets through 2020 will make it hard to source new supply needed to offset roughly 5MMB/D of depletion and another 1.0—1.5MMB/D of new demand. We wrote about this recently in Why Oil Could Be Higher for Longer.

It’s perfectly natural for investors to mention crude oil and MLPs in the same breath. But we think the strong recent relationship will weaken, and industry fundamentals will dominate again.


The Shrinking Pool of Cheap Assets

Stocks have in recent years been the destination of choice for bond refugees. The guiding strategy behind monetary policy since 2008 has been to drive investors into riskier assets so as to boost economic growth. Amid mounting evidence that this objective was being achieved, the Federal Reserve has contemplated the timing around ending this strategy by normalizing rates. In fact, the Federal Reserve has provided so many false warnings of an impending tightening of monetary policy that it’s barely worth paying attention. I have kept track of their evolving rate forecasts ever since they began providing greater precision back in January 2012. The chart of “blue dots” represents individual FOMC members’ expectations for the Fed Funds rate. Four and a half years ago they kicked off this greater openness with a forecast of a single tightening that year and a 0.75% rate by 2014. It’s fair to say that in early 2012 none of them expected the August 2016 funds rate to be where it is at 0.25%. Ever since they started with the blue dots, they’ve strained to adapt their updated forecasts to their persistent inaction.  It has been an amusing if not especially informative spectacle. You’d think it would be easier to get it right than the record suggests — they are, after all, merely trying to forecast their own actions. However, tactics regularly overwhelm strategy, as a moment of weakness in any sector of the economy is extrapolated into the possibility of a disappointing GDP number. If you look hard enough, there’s always softness somewhere. FOMC members possess many skills, but good forecasters they are not.

Not everyone has been surprised by the lethargic return to “normal” interest rates. Since it is the political season (i.e. shameless self-promotion is all around us), back in 2013 your blogger noted high levels of public debt and concluded that, “As a society we want low rates, and the Federal Reserve is pursuing a set of policies that are clearly in the public interest.” See Bonds Are Not Forever; The Crisis Facing Fixed Income Investors (Wiley, 2013).

Consequently, interest rates have remained lower for far longer than most investors expected. Every fixed rate mortgage has turned out to be more expensive than going with an adjustable one. Every non-defaulting corporate bond issued was, in hindsight, more costly than relying on floating rate debt. Eventually a borrower somewhere will lock in an all-time low in rates, but it hasn’t happened yet.

It’s not hard to find examples of strong performance in bonds, but even by recent standards I found the chart below from the Financial Times striking. The UK may have voted itself a recession via Brexit, but among the winners are holders of long-dated Sterling denominated corporate bonds whose prices in some cases have reached two times their par value at maturity.

Because of continued central bank monetary accommodation, the indices touching new highs are many and varied. Stocks, bonds, utilities and REITs are all at or very close to all- time best levels. As a result their yields are all commensurately paltry, as one might expect. By comparison, energy infrastructure, as represented by the Alerian MLP Index, offers both a substantially higher yield and a meaningful discount to its former high. With so many asset classes trading at hitherto unseen levels, it’s increasingly difficult to identify pockets of value. Momentum investors of course have plenty of choices, since so many sectors have strong upward momentum. MLPs have been no recent laggard on this score either, having leapt 60% from their low this past February. But it seems to us that if you like your investments to offer some kind of value cushion for when the momentum inevitably turns, MLPs should hold your attention. The yield spread between MLPs and REITs remains close to the widest levels it reached during the 2008 financial crisis. Switching from REITs or Utilities into MLPs looks like a portfolio upgrade.

Energy Transfer's Gift Is Less Than It Appears

For information on our MLP mutual fund, please click the link below:

Last week’s blog post (Williams Satisfies Two Masters) highlighted the different views of cash payouts by the MLP investors who hold Williams Partners (WPZ) and the C-corp investors who hold Williams Companies (WMB), the General Partner of WPZ. WPZ investors value regular payouts whereas WMB investors are driven by total returns. WMB neatly gave both types of investor what they desired by diverting WMB dividends to buy new WPZ units which provided cash to fund WPZ’s capex program, and thereby eliminated the risk to WPZ’s distribution. One of the powerful features of the GP/MLP structure is that is allows a business to access different classes of investors who can have different objectives. As their appetite to provide capital fluctuates, the GP/MLP can access the more willing investor class.

Continuing this theme, Energy Transfer similarly found a way to make everyone happy with the same set of assets.  CEO Kelcy Warren is masterful at moving cashflows and businesses around to find value. Aligning your interests with Kelcy Warren works most of the time, even if he is occasionally ethically challenged (see Is Energy Transfer Quietly Fleecing Its Investors?).

On their recent earnings call, Energy Transfer Equity (ETE) generously announced that it would waive $720MM of Incentive Distribution Rights (IDRs) due from Energy Transfer Partners (ETP) to ETE over the next 6 quarters.  IDRs are the payments an MLP makes to its GP and are somewhat analogous to the incentive fees a hedge fund manager earns from his hedge fund. ETP traded up following the announcement of this largesse, and ETE traded down.  On the surface this is a straight transfer of value from ETE to ETP, a movement of cashflow from one pocket to the other. It’s a zero-sum transaction.

The ostensible reason is to support ETP’s stock price which will make it easier to sell new units of ETP. On the previous earnings call, Kelcy said: “In order to support ETP with its cost of equity capital in light of ETP’s current common unit price, ETE has recently advised ETP that ETE intends to waive its rights to receive incentive distributions, with respect to ETP’s 2016 issuances of common units… whether pursuant to the ATM or other offerings of common units, through fourth-quarter 2017 distributions. As these potential IDR waivers have not been approved by the ETE board, ETE is not formally bound to these proposed IDR waivers. This reinforces ETE’s commitment to support ETP.”  On the same call, Kelcy noted that, “ETE will do what it needs to do to support ETP”

ETP rose 10% on the day of the announcement.

Although the conference call made it sound like an altruistic move by ETE, the relevant SEC filing noted that in exchange for these IDR waivers ETP was granting ETE new Class J units which would transfer $1.8BN of ETP’s depreciation, depletion and amortization (“DD&A”) to ETE over a period of three years (2016-18). Both ETP and ETE are partnerships issuing K-1s, so the proportional share of depreciation runs through each investor’s tax return. ETP investors will in aggregate have $1.8BN less in tax-deductible depreciation expense, approximately $3.44 per unit (there are 524MM ETP units outstanding). Assuming a 45% marginal tax rate (K-1 tolerant MLP investors are usually in the top rate) the taxable ETP investor is $1.55 per unit worse off. The IDR waivers work out to be worth $1.37 pre-tax per unit. So it’s at best a wash.

Prior statements from ETE include an assertion that ETE would not suffer any reduction in cashflows from ETP, and on the most recent conference call, Kelcy confirmed that there would not be additional IDR waivers applied to new equity raised at ETP. The IDR forgiveness is not equally spread over six quarters but is modestly back-ended. Therefore, we deduce that ETP will issue additional equity which will pay IDRs to make up for the shortfall from this IDR waiver. The rise in ETP’s stock price that followed this announcement makes it a little easier to issue equity. It also shows that ETP is valued, like other MLPs, on a pre-tax basis.

While MLP investors are drawn to the sector because of the tax-deferral that depreciation charges afford, few calculate their effective after-tax return on each individual security. They just send the K-1s to their accountant, who grumbles while charging a bit more, and the investor winds up with a lower tax bill. Figuring out which MLPs one holds are the most tax-effective is beyond most investors’ interest or ability. After-tax returns are notoriously quixotic and vary based on an individual’s tax situation. ETE management has insightfully spotted this. For this reason, most investment analysis relies on pre-tax returns. And sure enough, Barron’s quoted four analysts who gushed about the IDR waiver while ignoring the loss of tax shield (see Energy Transfer Partners Gets Fee Break from Parent, Shares Rise).

Kelcy has figured out that if investors don’t value something that highly you might as well give it to someone else. ETE investors (of which Kelcy is 18%) value the tax shield more accurately, which is clear since ETP’s stock rose even though the after-tax outcome for ETP investors didn’t add any value. Meanwhile, not only does the swap of tax shield for IDR waivers leave ETE investors better off after tax, but ETP can now issue new equity more easily, which will throw off additional IDRs for ETE indefinitely. The IDR waiver is expected to be $130M in 4Q17 after which it expires.  Starting in 2018 ETE will receive $520M more in IDRs each year for its “support” in which it gave up no cash flows and received $810M of value in DD&A units. Those Energy Transfer people are pretty clever.

We are invested in ETE and WMB

Just so it doesn’t seem as if we only pick on Energy Transfer, here’s a link to a recent TV spot on hedge funds.

Williams Satisfies Two Masters; More on Solar

Williams Satisfies Two Masters

Master Limited Partnership (MLPs) have been reporting earnings over the past couple of weeks. They were largely as expected with several names providing modest positive surprises. There were also some other interesting announcements – notably the sale by Energy Transfer Partners (ETP) and Sunoco Logistics (SXL) of part of their interest in the Bakken Pipeline Project to Enbridge Energy Partners (EEP) and Marathon Petroleum (MPC).

We calculate that ETP and SXL collectively invested $2BN developing this asset and have received $2BN for a partial interest, leaving them with a significant economic stake for minimal cash outlay. In addition, they removed competitor project Sandpiper by bringing its sponsors into their project and MPC’s refineries will be an important customer which could provide an uplift to volumes.  The value of the assets and backlog of the Energy Transfer Family is why we’re invested for now in ETP and SXL’s General Partner (GP), Energy Transfer Equity (ETE). This is in spite of misgivings about management who remain unapologetic about acting in their own self interest (see Will Energy Transfer Act With Integrity?). On this topic we salute friend Ethan Bellamy, R.W. Baird’s Senior Analyst covering MLPs, for shunning the usual, sycophantic “great quarter guys” posture of most analysts and asking CEO Kelcy Warren a direct question on his crooked converts.

But our focus this week is on Williams Companies (WMB). As they warned before the vote on their ill-fated merger with ETE, a dividend cut was coming and was duly announced this week. In the meantime, a failed effort to fire CEO Alan Armstrong resulted in six of thirteen board members resigning.

Dividend cuts usually reflect strategic mis-steps by management, and although WMB controls a unique asset in Transco (an extensive pipeline network covering much of the eastern U.S.) their stock has lagged the Alerian Index substantially over the past two years. CEO Armstrong might argue that the influence of activists led by Keith Meister (an investor whose long term advice is of dubious value, as we wrote in  The Corvex Discount) forced poor strategic decisions. The pending sale to ETE limited WMB’s ability to make any other moves, such as raising capital, until it was resolved.

But in this case WMB is using the cash saved from its reduced dividend to fund its growth capex, most of which is going to expand its Transco asset at attractive multiples. Although WMB cut its dividend by 70%, its MLP Williams Partners (WPZ) maintained theirs and both securities rose on the news. It was a perfect illustration of  the divergent views of dividends. WMB investors are total-return oriented and cheered the redirection of cash into high-return projects. WPZ investors just want the cash. Both classes of investors are getting what they want.

It reflects a different approach to the Sponsor/MLP model. Traditionally, the sponsor develops the assets and then sells them to its MLP through a “dropdown” transaction. The MLP raises capital through a secondary offering of equity (usually supplemented with debt) and uses the cash raised to pay its sponsor for the asset.


This model broke down last year as MLP yields rose to levels that made equity financing prohibitive. And yet, many attractive investment opportunities remained. It illustrates that the problem with midstream MLPs last year was not poor operating performance but a need for growth capital in excess of traditional investors’ desire to provide it (see The 2015 MLP Crash; Why and What’s Next).

Prior to the WMB dividend cut, WPZ yielded 9.7%, representing an expensive cost of equity capital. The 70% cut in WMB’s dividend will save $1.3BN annually. WMB expects to invest $1.7BN through the end of 2017 in new WPZ units. WPZ will use this cash to fund its capex, thereby eliminating its need to issue equity to the public and also taking pressure off its distribution.

WMB can in the future sell the WPZ units it will be acquiring through the next five quarters when the market environment is better and yields are lower. It’s an elegant way to provide WMB C-corp investors what they want (invested capital in high return projects) and WPZ investors what they want (stable distributions under any and all circumstances). Because the two classes of investors have different objectives, there are different times to access them for capital. Today the C-corp investor is more receptive, whereas MLP investors are setting a higher price. In time the cycle will shift, and the MLP investor will be a more eager capital provider, at which time WMB may sell its WPZ units. Crucially, the Incentive Distribution Rights (IDRs), under which WMB earns 50% of WPZ’s incremental Distributable Cash Flow (DCF) will remain with WMB even after the WPZ units are sold. It’s like a hedge fund manager investing his own cash in his hedge fund when investors are hard to find but opportunities attractive, and later on replacing his capital at a profit with outside investors’ money which will pay the ubiquitous “2 & 20”.

This is why it’s better to invest in MLP GPs.

We are invested in ETE and WMB

More on Solar

We received quite a few comments on our August newsletter (see Why Electric Cars Are Good for Fossil Fuels). We see solar-derived electricity generation growing at a high rate, but maintain that electric cars will for the foreseeable future consume electricity that is largely derived by burning natural gas and coal.

There are solar bulls who forecast that the sun will provide a substantial portion of our electricity in less than a generation (see Ray Kurzweil: Here’s Why Solar Will Dominate Energy Within 12 Years). Mr. Kurzweil’s Wikipedia page lists him as a computer scientist, inventor and futurist. He works for Google, so is a seriously smart guy.

So we won’t take on Mr. Kurzweil’s forecast directly; I’m personally a late adopter on most new things and on solar domination well, I’m just not quite there yet. But an important challenge for solar is that U.S. electricity consumption is barely growing, rising at 0.5% annually since 2000 according to the Energy Information Administration’s Annual Energy Outlook 2016. So to be significant quickly, solar will have to gain market share from traditional sources of electricity generation – and it is expected to gain at the expense of coal (as is natural gas). But to become the dominant source of electricity it will have to undercut many power stations that still have years of useful life ahead of them.

Moreover (as my partner Henry so insightfully noted), to do so they’ll need to deliver electricity not simply cheaper than the fully-loaded cost of a power plant but below its marginal cost. A nuclear power plant involves a high up-front cost to construct. Thereafter, its operating costs are the threshold for any new, competing source of electricity. As in micro-economics, once your fixed costs are spent, as long as you cover your variable costs you’ll keep producing widgets (or Megawatts). Power plants last for decades, so the openings for solar even if competitively priced will occur very slowly as less efficient plants are retired.

Furthermore, utilities and municipalities account for two thirds of U.S. gas transport capacity (pipelines) and sign long-dated volume & price commitments, making a quick switch ever more cost-prohibitive.  Replacing retired coal capacity is how natural gas is making inroads into coal (although expensive environmental regulations are hastening the process). For these reasons and a lot of others specific to the intricacies of the electric utility sector (including load balancing and regulations), we think solar will grow and yet fail to be dominant for decades, similar to all past transformative energy technologies.

image_pdfimage_print