Why the Shale Revolution Hasn't Yet Helped MLPs
MLP investors must wish they’d never heard of the Shale Revolution. The consequent growth in volumes of crude oil and natural gas seemed a fairly simple thesis for owners of volume-driven infrastructure assets. Increased demand for pipeline and storage capacity, for gathering and processing networks, ought to be good for the sector. But so far, a dramatically more productive domestic energy industry has driven MLP stock prices relentlessly lower. Moreover, the divergence between the energy sector and the broader averages is a common investor complaint – the truism that MLPs are a volume business and therefore rising volumes should be good isn’t reflected in recent returns.
Early last week the International Energy Agency (IEA) published World Energy Outlook 2017 which forecasts that the U.S. will become the world’s biggest Liquified Natural Gas (LNG) exporter by the mid-2020s, and a net oil exporter by the end of that decade. Other long term forecasts, including those from the Energy Information Administration, Exxon Mobil and Goldman Sachs are broadly consistent with the IEA. MLPs slumped anyway, perhaps oblivious to the report or maybe because of it.
The Shale Revolution, the paradigm driving America to Energy Independence, has not done much for investors. It’s pressured cashflows and balance sheets of formerly stable businesses. Few management teams seem able to pass up growth opportunities, and the consequent redirection of Distributable Cash Flow (DCF) from distributions to growth projects has alienated those wealthy Americans who accepted K-1s in exchange for steady, growing, tax-deferred income. The evidence of this is most clearly seen in the defiantly high yields of some securities. Energy Transfer Partners (ETP), with its 14% payout, reflects investor disbelief that payments will continue.
Since yield no longer convinces, consider Duke Energy Corp (DUK) which delivers electricity and natural gas to over 9 million customers across the southern and Midwest U.S. It operates a highly regulated, capital intensive business. Kinder Morgan (KMI) transports, treats and stores natural gas (including now LNG), natural gas liquids and crude oil in a highly regulated, capital intensive business. Debt:Equity at DUK is 5.6X and KMI is 5.3X, so they’re similarly leveraged. But KMI’s multiple to its Distributable Cash Flow (DCF, or Free Cash Flow less growth capex) is 8.8X. The analogous cash flow multiple for DUK is 13.2X (Net Income plus D&A minus maintenance CapEx). DUK is 50% more expensive on a cash flow per share basis. Furthermore, the value of the land and easements acquired for pipelines appreciates over time whereas power plants eventually depreciate to zero. In this regard, DUK’s $7B/year (11% of it’s market cap) in growth CapEx becomes much more concerning.
The Utilities sector has been strong this year, which has stretched valuations while energy, including infrastructure, has lagged. The question is why investors in DUK and other similar names don’t make what looks like a substantial valuation upgrade by switching from one highly regulated business to another. KMI long ago broke its contract with the original Kinder Morgan Partners investors. When you remove a slide titled “Promised Made, Promises Kept” (see What Kinder Morgan Tells Us About MLPs) there are consequences. Redirecting cashflow from distributions to growth projects necessitated the revision to its investor presentation and took them in search of new investors.
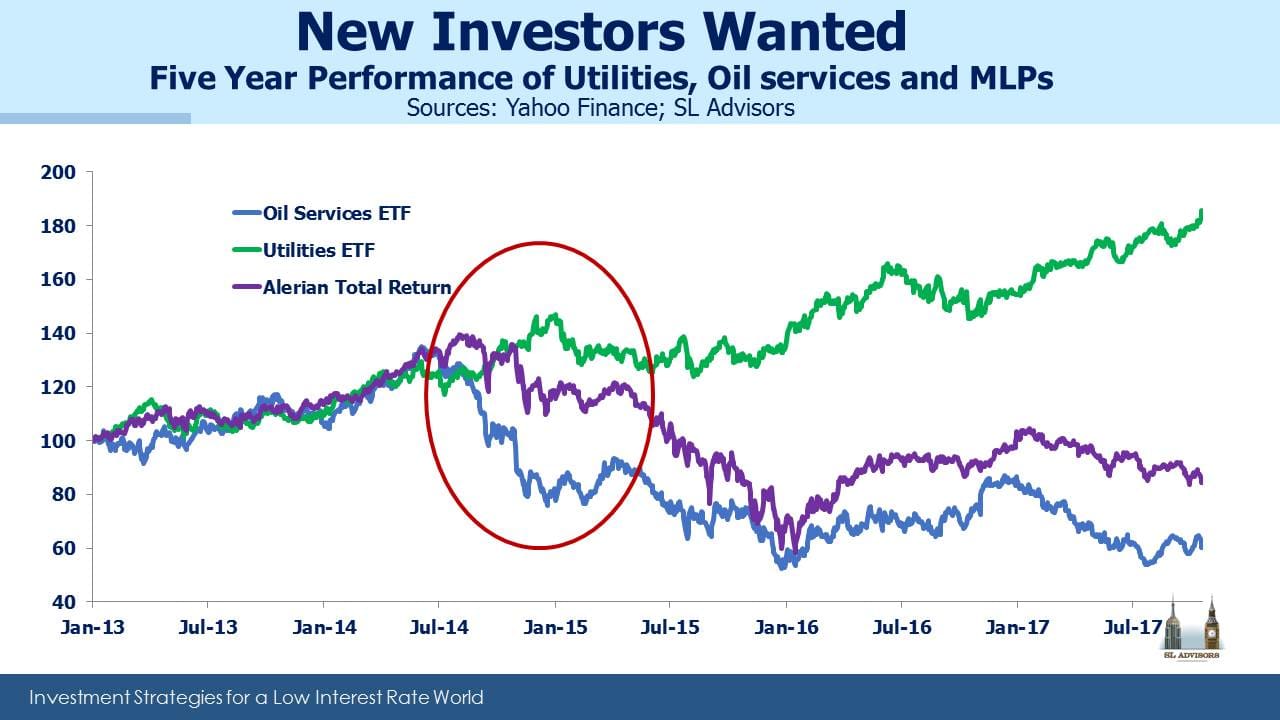
MLPs are a shrinking part of the energy infrastructure landscape. The Shale Revolution is leading us towards Energy Independence, increasingly through C-corps (hence our new American Energy Independence Index). But the sector moves nowadays with the Oil Services sector whose biggest names are struggling with a global slump in spending on conventional oil and gas projects, whereas in the U.S. the strength in volumes and spending continues. The close relationship between oil services and energy infrastructure is not likely to sustain over the long term given their substantially different business models (cyclical versus regulated; global versus domestic).
Recent weakness may also be due to concerns that tax reform could result in lower corporate tax rates with no improvement in rates charged on passive investment income from pass-through vehicles. This would benefit C-corps over MLPs — although details on the plan continue to change, there’s probably less certainty about the ultimate tax treatment for MLPs which could be causing potential buyers to wait for clarity. The news that Norway’s $1TN sovereign wealth fund is planning to divest its oil and gas holdings certainly didn’t help sentiment either.
Returning to the chart, it shows that as growth plans took hold through 2014-15, increasing secondary offerings (how you finance growth if you pay out all your cashflow in distributions) revealed the reluctance of traditional MLP investors to reinvest those payouts. This drove yields up and hurt sector performance. Although they got there in different ways, most big MLPs concluded that the growth capital wasn’t available and so cut payouts, redirecting cash to fund projects instead. Traditional MLP investors felt betrayed and are clearly not rushing to invest in the sector, which has created today’s value opportunity.

Important Disclosures
The information provided is for informational purposes only and investors should determine for themselves whether a particular service, security or product is suitable for their investment needs. The information contained herein is not complete, may not be current, is subject to change, and is subject to, and qualified in its entirety by, the more complete disclosures, risk factors and other terms that are contained in the disclosure, prospectus, and offering. Certain information herein has been obtained from third party sources and, although believed to be reliable, has not been independently verified and its accuracy or completeness cannot be guaranteed. No representation is made with respect to the accuracy, completeness or timeliness of this information. Nothing provided on this site constitutes tax advice. Individuals should seek the advice of their own tax advisor for specific information regarding tax consequences of investments. Investments in securities entail risk and are not suitable for all investors. This site is not a recommendation nor an offer to sell (or solicitation of an offer to buy) securities in the United States or in any other jurisdiction.
References to indexes and benchmarks are hypothetical illustrations of aggregate returns and do not reflect the performance of any actual investment. Investors cannot invest in an index and do not reflect the deduction of the advisor’s fees or other trading expenses. There can be no assurance that current investments will be profitable. Actual realized returns will depend on, among other factors, the value of assets and market conditions at the time of disposition, any related transaction costs, and the timing of the purchase. Indexes and benchmarks may not directly correlate or only partially relate to portfolios managed by SL Advisors as they have different underlying investments and may use different strategies or have different objectives than portfolios managed by SL Advisors (e.g. The Alerian index is a group MLP securities in the oil and gas industries. Portfolios may not include the same investments that are included in the Alerian Index. The S & P Index does not directly relate to investment strategies managed by SL Advisers.)
This site may contain forward-looking statements relating to the objectives, opportunities, and the future performance of the U.S. market generally. Forward-looking statements may be identified by the use of such words as; “believe,” “expect,” “anticipate,” “should,” “planned,” “estimated,” “potential” and other similar terms. Examples of forward-looking statements include, but are not limited to, estimates with respect to financial condition, results of operations, and success or lack of success of any particular investment strategy. All are subject to various factors, including, but not limited to general and local economic conditions, changing levels of competition within certain industries and markets, changes in interest rates, changes in legislation or regulation, and other economic, competitive, governmental, regulatory and technological factors affecting a portfolio’s operations that could cause actual results to differ materially from projected results. Such statements are forward-looking in nature and involves a number of known and unknown risks, uncertainties and other factors, and accordingly, actual results may differ materially from those reflected or contemplated in such forward-looking statements. Prospective investors are cautioned not to place undue reliance on any forward-looking statements or examples. None of SL Advisors LLC or any of its affiliates or principals nor any other individual or entity assumes any obligation to update any forward-looking statements as a result of new information, subsequent events or any other circumstances. All statements made herein speak only as of the date that they were made. r
Certain hyperlinks or referenced websites on the Site, if any, are for your convenience and forward you to third parties’ websites, which generally are recognized by their top level domain name. Any descriptions of, references to, or links to other products, publications or services does not constitute an endorsement, authorization, sponsorship by or affiliation with SL Advisors LLC with respect to any linked site or its sponsor, unless expressly stated by SL Advisors LLC. Any such information, products or sites have not necessarily been reviewed by SL Advisors LLC and are provided or maintained by third parties over whom SL Advisors LLC exercise no control. SL Advisors LLC expressly disclaim any responsibility for the content, the accuracy of the information, and/or quality of products or services provided by or advertised on these third-party sites.
All investment strategies have the potential for profit or loss. Different types of investments involve varying degrees of risk, and there can be no assurance that any specific investment will be suitable or profitable for a client’s investment portfolio.
Past performance of the American Energy Independence Index is not indicative of future returns.
I truly hope that you are correct in characterizing MLP investments as a “value opportunity”.. We also have to see what Congress does with the two pending versions of tax law changes (it is not “reform”). For example, the House version limits interest deductions to 30% of EBITDA, whereas the Senate version reduces the base operating income against which the percentage is calculated by depreciation and amortization, which can create a base of zero and no interest deductions at all, which isn’t so great in an increasing interest rate environment. And whereas the House version taxes pass through income at 25%–to which one must add the Obama financial transactions tax of 3.8%–the Senate version has a base rate of 31.8% before adding the 3.8% financial transactions tax. Hopefully the Conference Committee will favor the House version. In any event, immediate expensing of capital improvements ought to help a lot.