Behind Soft Natural Gas Prices

/
Most of the commodity questions we get relate to crude oil, since its price reflects energy investor sentiment and can move midstream prices. When oil and pipelines are down, people want to know why the volume dependency of midstream cashflows isn’t visible in stock price performance. The correlation between the two is unstable (see Energy’s Asynchronous Marriage).
Pipelines are even less correlated with natural gas. This is partly because there are enormous global price disparities. US LNG exports are growing but still constrained by insufficient liquefaction capacity to satisfy global demand. Hence US natural gas prices are far lower than European and Asian benchmarks.
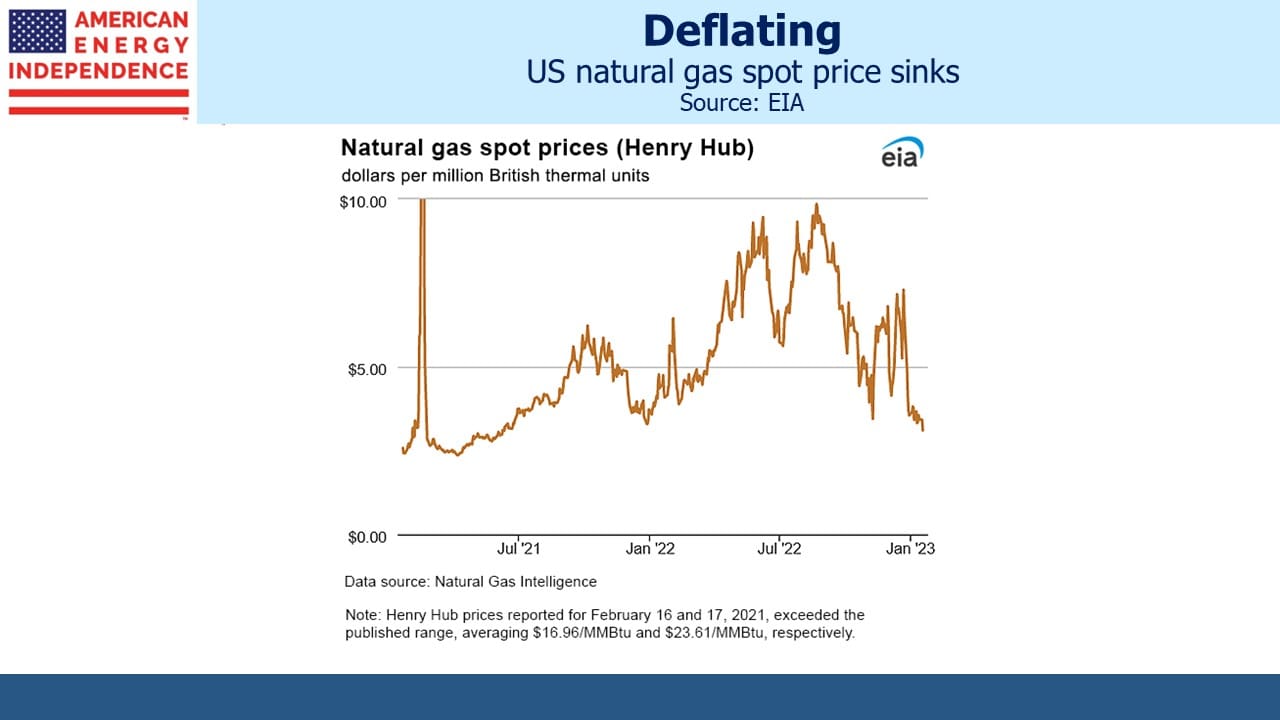
Gas prices have been sliding in recent weeks, confounding some who think Europe’s pivot away from Russian pipeline exports should create immediate incremental demand. The main reason is weather. Just before Christmas the US experienced a cold snap which boosted domestic demand, but since then it’s been a relatively mild winter. The same has been true in Europe, where fears that rationing might be required before winter’s end are receding.
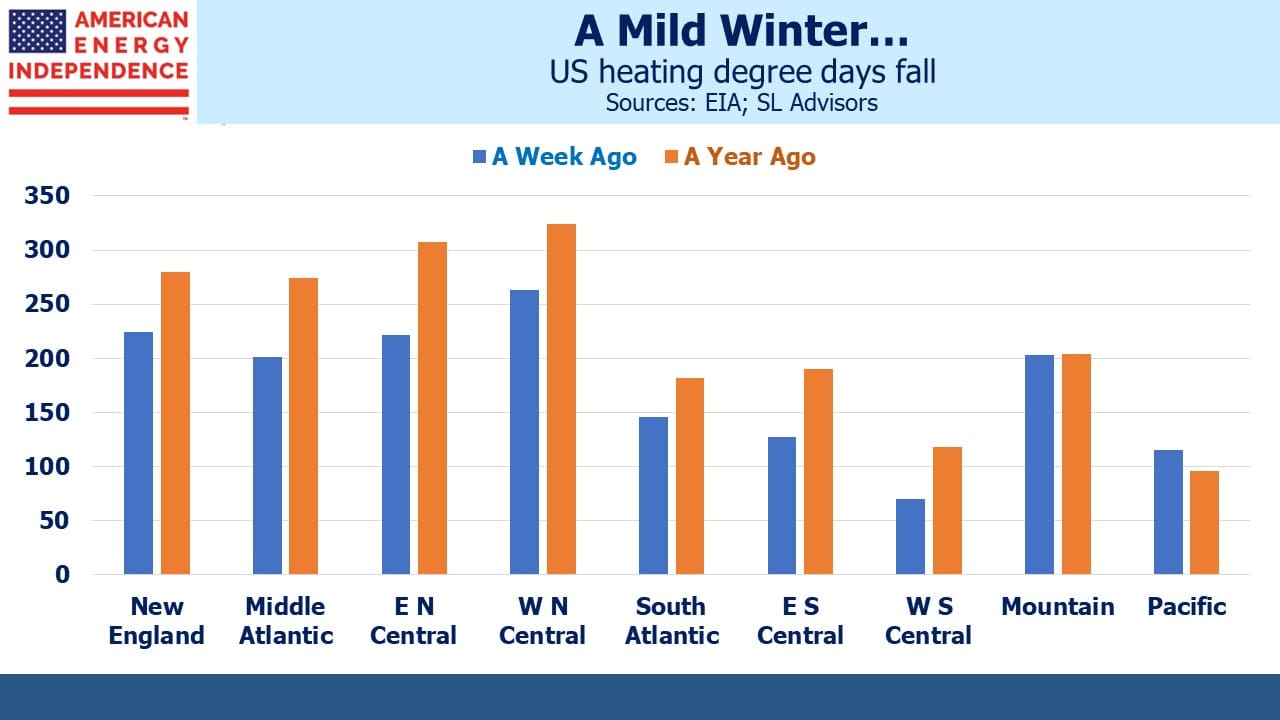
Most of the US has seen milder weather as defined by Heating Degree Days (the average of the day’s high and low subtracted from 65, or 0 if negative). Only the Rocky Mountains and west coast have been different. California’s relentless rain is being blamed by some on global warming, but it reaches the mountains as snow which I can personally attest is creating great skiing conditions.
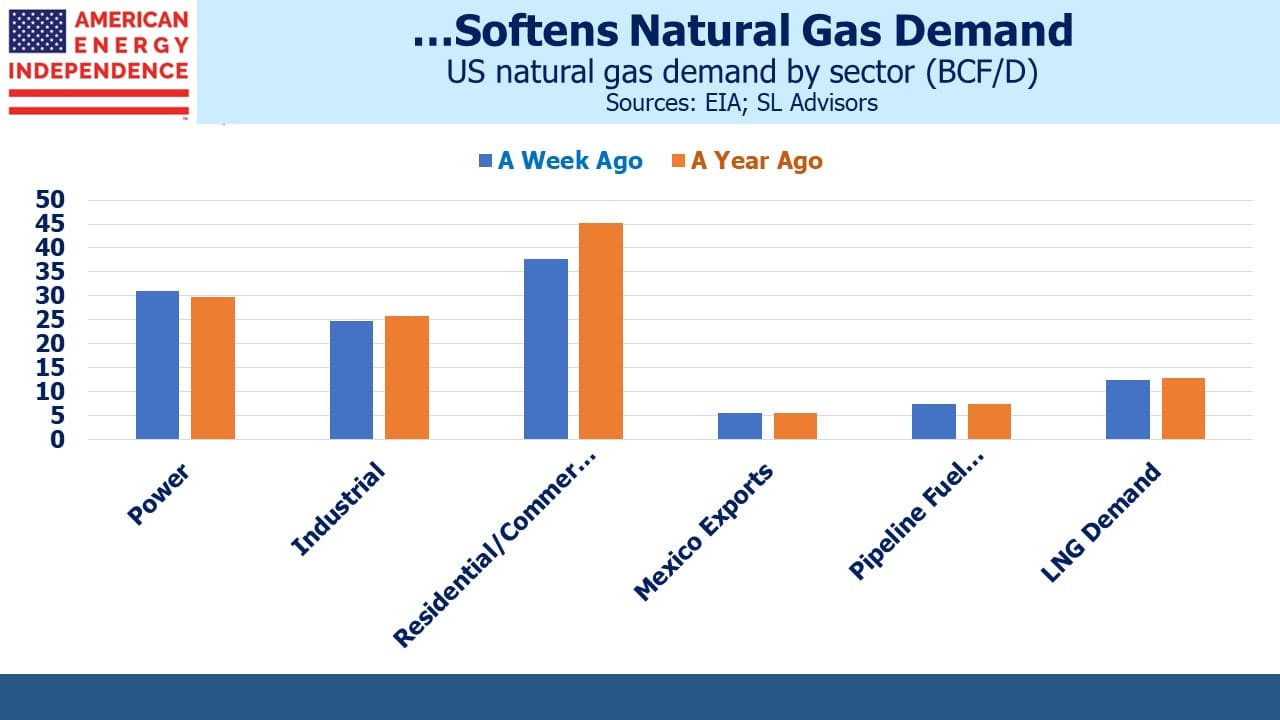
The milder winter is curbing demand for natural gas, most clearly seen in the 17% drop in the residential and commercial category compared with a year ago. Exports are also less than forecast. The Freeport LNG plant is the 2nd biggest such facility in the US behind Cheniere’s Sabine Pass. Restarting operations there following the fire last June has also taken longer than expected, curbing demand for natural gas supplies to be converted into LNG. The company is sticking with its latest forecast that it’ll be back up by the end of January.
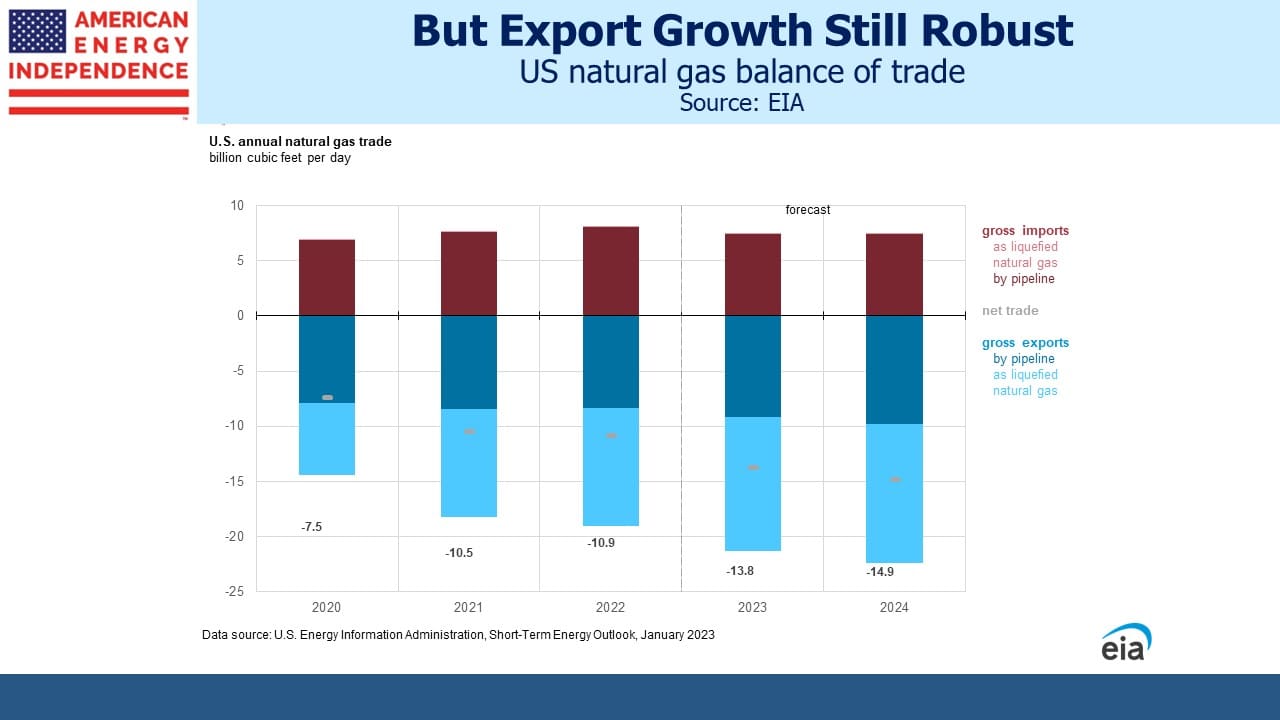
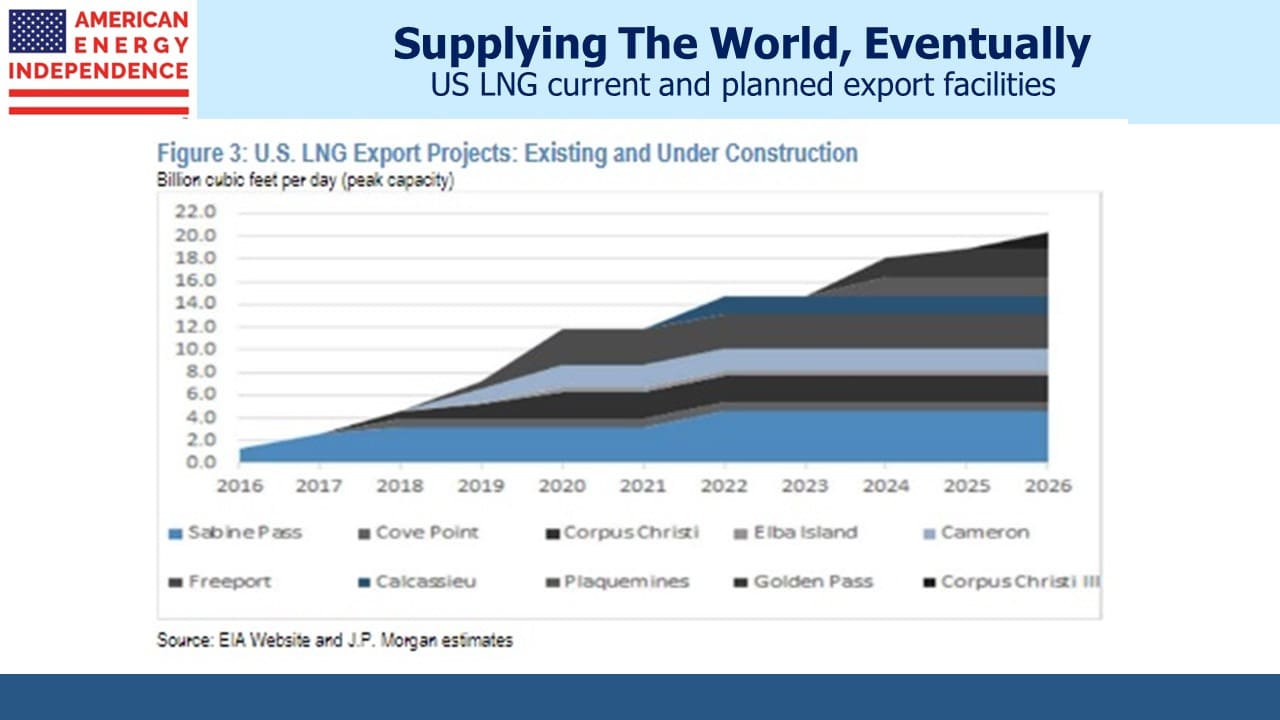
Looking ahead, LNG demand will assuredly grow and the weather will fluctuate. The Energy Information Administration’s Short Term Energy Outlook sees US LNG exports averaging 12.1 Billion Cubic Feet per Day (BCF/D) this year and 12.6 BCF/D in 2024. They did trim this year’s forecast modestly because of the delay in Freeport’s restart.
US LNG export capacity won’t grow significantly for another couple of years, but by 2030 will have almost doubled in a decade. This will help close the price gap between US natural gas and other global benchmarks, although even then LNG exports will represent less than 20% of domestic demand.
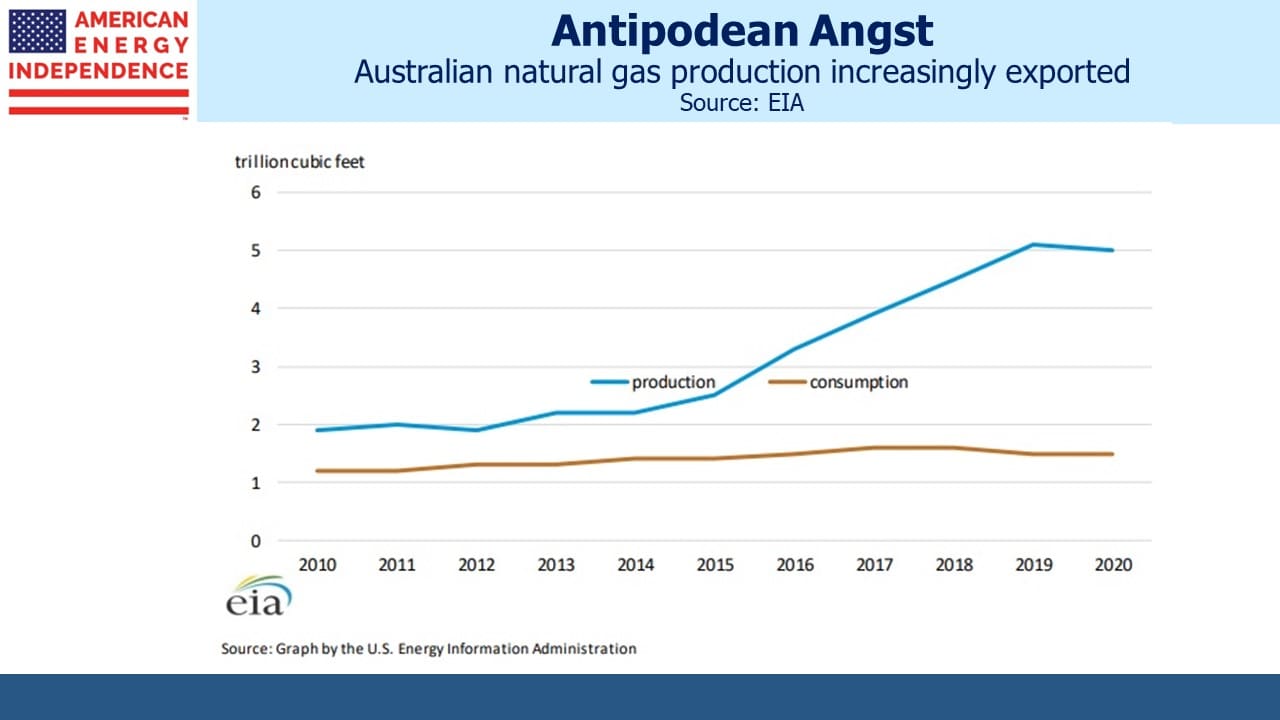
Australia vies with the US and Qatar for top LNG exporter. But LNG exports have become a political issue down under, because such a big portion of production is flowing overseas that it’s boosting domestic prices. In recent years Australia’s federal government has contemplated export curbs. These are vehemently opposed by the gas industry which argues they may be forced to violate contractual obligations. Partly as a result of political pressure, Australian LNG exports are expected to dip this year.
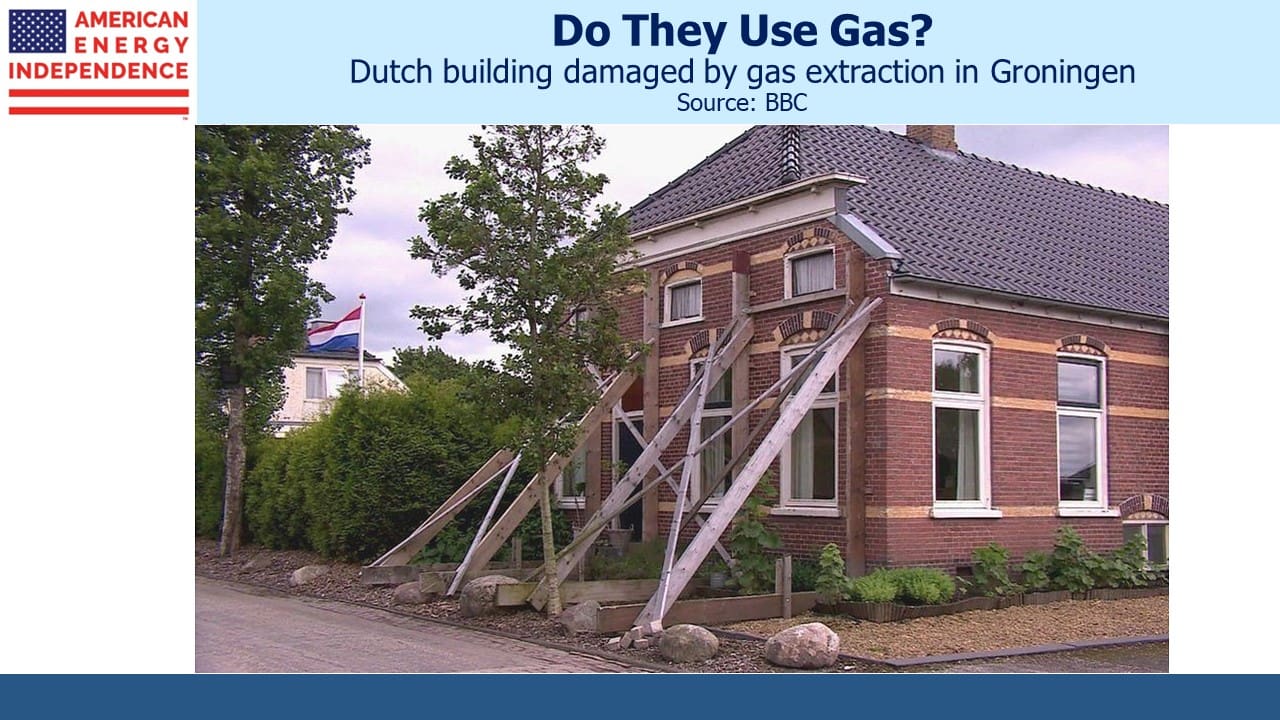
The Netherlands is also planning to curb exports, but for different reasons. Their Groningen gasfield, the largest in western Europe, has been widely linked with earthquakes. There have been up to 100 annually since 1980, ranging as high as magnitude 3.6. Several years ago tremors in Oklahoma were attributed to fracking, although blame was eventually pinned on improper wastewater disposal not the fracking itself.
But fracking is not used in Groningen, and it appears that the removal of natural gas itself destabilizes the ground. 160,000 damage claims have been submitted by residents of the area. The Dutch government has been promising to halt gas production there since 2018 and now sounds as if they will finally follow through.
The timing is awkward because Groningen borders Germany and supplies the northwest of the country. The EU pressed the Dutch to increase production following Russia’s invasion of Ukraine. Depending on Europe’s supplies Groningen may continue production until October 2024 but not beyond that.
Political pressure in Australia and the Netherlands will enhance the prospects for US LNG exports both to Europe and Asia.
Following Sunday’s blog critical of Kinder Morgan, some readers asked why we have any position in the company at all. We’ve been critical of their returns on invested capital for several years (see Kinder Morgan’s Slick Numeracy) and they’ve long been an underweight for us.
Today the company’s poor investment history is well known by analysts if not acknowledged by the board since they just elevated a long-time member of the management team and former CFO Kim Dang to CEO. We’ll look for signs of improvement. Their Enhanced Oil Recovery business (EOR) was an unwelcome source of EBITDA volatility, but with the Inflation Reduction Act increasing tax credits for CO2 capture including from EOR, there’s some chance for this segment to become more interesting.
We have three funds that seek to profit from this environment:

Important Disclosures
The information provided is for informational purposes only and investors should determine for themselves whether a particular service, security or product is suitable for their investment needs. The information contained herein is not complete, may not be current, is subject to change, and is subject to, and qualified in its entirety by, the more complete disclosures, risk factors and other terms that are contained in the disclosure, prospectus, and offering. Certain information herein has been obtained from third party sources and, although believed to be reliable, has not been independently verified and its accuracy or completeness cannot be guaranteed. No representation is made with respect to the accuracy, completeness or timeliness of this information. Nothing provided on this site constitutes tax advice. Individuals should seek the advice of their own tax advisor for specific information regarding tax consequences of investments. Investments in securities entail risk and are not suitable for all investors. This site is not a recommendation nor an offer to sell (or solicitation of an offer to buy) securities in the United States or in any other jurisdiction.
References to indexes and benchmarks are hypothetical illustrations of aggregate returns and do not reflect the performance of any actual investment. Investors cannot invest in an index and do not reflect the deduction of the advisor’s fees or other trading expenses. There can be no assurance that current investments will be profitable. Actual realized returns will depend on, among other factors, the value of assets and market conditions at the time of disposition, any related transaction costs, and the timing of the purchase. Indexes and benchmarks may not directly correlate or only partially relate to portfolios managed by SL Advisors as they have different underlying investments and may use different strategies or have different objectives than portfolios managed by SL Advisors (e.g. The Alerian index is a group MLP securities in the oil and gas industries. Portfolios may not include the same investments that are included in the Alerian Index. The S & P Index does not directly relate to investment strategies managed by SL Advisers.)
This site may contain forward-looking statements relating to the objectives, opportunities, and the future performance of the U.S. market generally. Forward-looking statements may be identified by the use of such words as; “believe,” “expect,” “anticipate,” “should,” “planned,” “estimated,” “potential” and other similar terms. Examples of forward-looking statements include, but are not limited to, estimates with respect to financial condition, results of operations, and success or lack of success of any particular investment strategy. All are subject to various factors, including, but not limited to general and local economic conditions, changing levels of competition within certain industries and markets, changes in interest rates, changes in legislation or regulation, and other economic, competitive, governmental, regulatory and technological factors affecting a portfolio’s operations that could cause actual results to differ materially from projected results. Such statements are forward-looking in nature and involves a number of known and unknown risks, uncertainties and other factors, and accordingly, actual results may differ materially from those reflected or contemplated in such forward-looking statements. Prospective investors are cautioned not to place undue reliance on any forward-looking statements or examples. None of SL Advisors LLC or any of its affiliates or principals nor any other individual or entity assumes any obligation to update any forward-looking statements as a result of new information, subsequent events or any other circumstances. All statements made herein speak only as of the date that they were made. r
Certain hyperlinks or referenced websites on the Site, if any, are for your convenience and forward you to third parties’ websites, which generally are recognized by their top level domain name. Any descriptions of, references to, or links to other products, publications or services does not constitute an endorsement, authorization, sponsorship by or affiliation with SL Advisors LLC with respect to any linked site or its sponsor, unless expressly stated by SL Advisors LLC. Any such information, products or sites have not necessarily been reviewed by SL Advisors LLC and are provided or maintained by third parties over whom SL Advisors LLC exercise no control. SL Advisors LLC expressly disclaim any responsibility for the content, the accuracy of the information, and/or quality of products or services provided by or advertised on these third-party sites.
All investment strategies have the potential for profit or loss. Different types of investments involve varying degrees of risk, and there can be no assurance that any specific investment will be suitable or profitable for a client’s investment portfolio.
Past performance of the American Energy Independence Index is not indicative of future returns.


Leave a Reply
Want to join the discussion?Feel free to contribute!