Energy Transfer’s Distribution Management

/
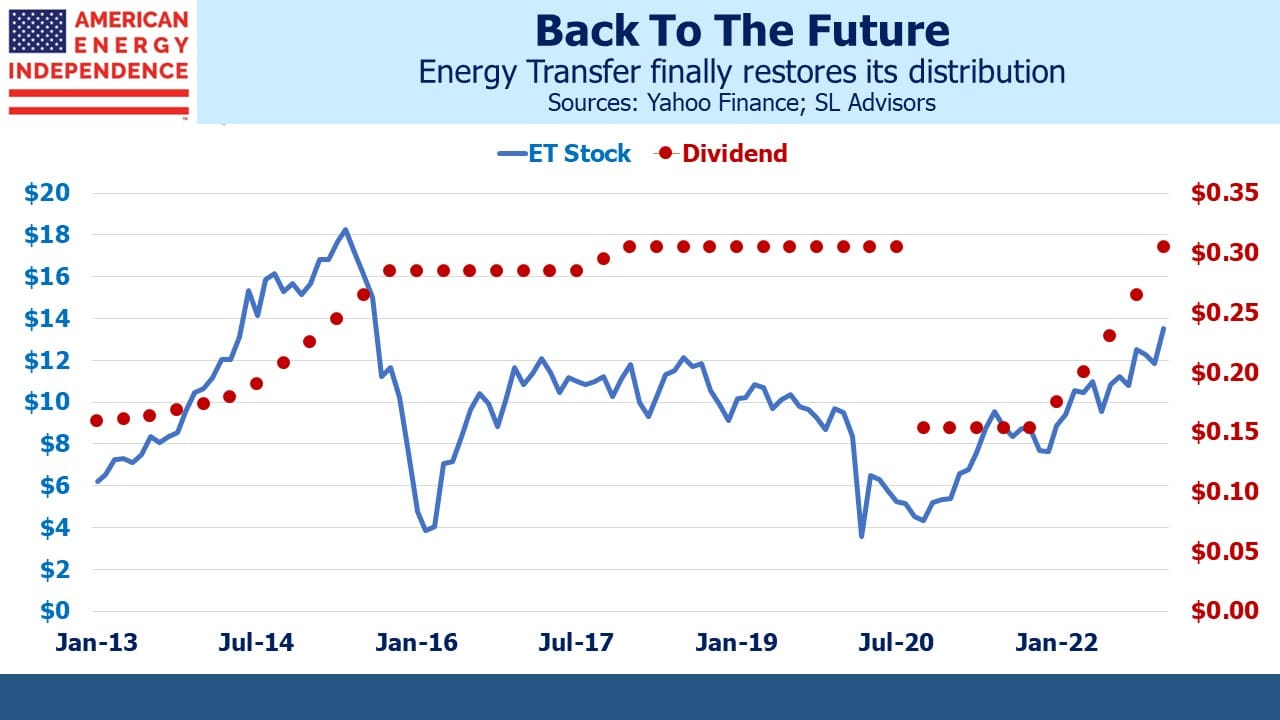
Last week Energy Transfer (ET) raised their quarterly distribution to $0.305, restoring it to a level last paid in July 2020. This cheered a great many people. Among the financial advisors we talk to it is the most widely held individual name. It is perennially cheap. JPMorgan, Morgan Stanley and (according to Refinitiv) 94% of sell side analysts list ET as Overweight.
Following the distribution hike, up 75% year-on-year, ET yields 9.1%. It remains the cheapest big MLP with a 2023 Distributable Cash Flow (DCF) yield of 18%. Under the old MLP standard that prevailed prior to the shale investment bust, 90% of DCF was commonly paid in distributions. Following the hike, their payout ratio is a parsimonious 50%. Like a great performer, ET leaves its audience hoping for more.
Co-CEOs Marshall McCrea and Tom Long retain the deft touch of former CEO (now Executive chairman) Kelcy Warren. ET executes well but always prioritizes management’s interests. Search results on our blog reveal they’re mentioned in 141 separate posts. Enbridge is 54.
In 2016 Energy Transfer Equity (ETE), the entity that ultimately became ET, issued a lucrative class of convertible preferred securities to insiders on the management team (see Is Energy Transfer Quietly Fleecing its Investors?). These securities allowed reinvestment of preferred dividends at $6.56 even if the prevailing unit prices was higher which it always was. This attractive feature was denied to other investors which led to a class action lawsuit. We wondered aloud, Will Energy Transfer Act with Integrity? ET answered by arguing that their maneuver had allowed them to preserve their distribution, winning the case.
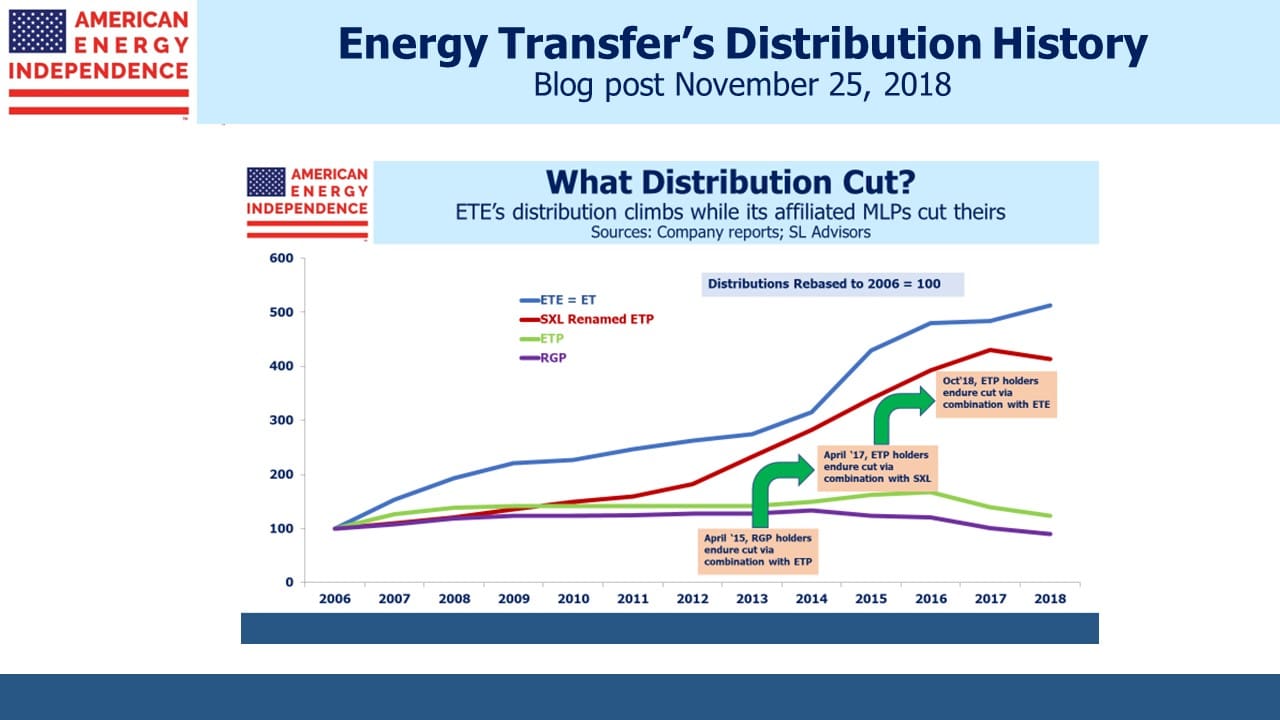
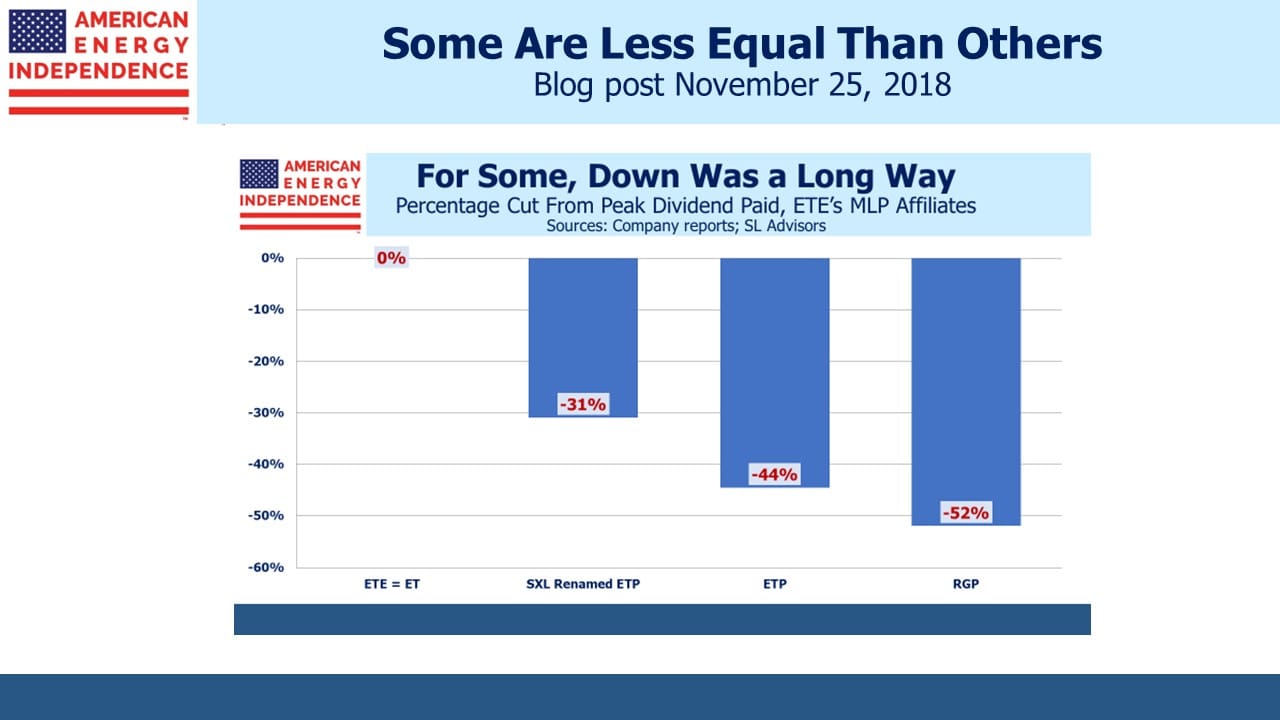
ETE was once the General Partner (GP) of MLPs Sunoco Logistics, Energy Transfer Partners and Regency Partners. Through a series of mergers culminating with being absorbed by ETE in 2018, all these LP unitholders endured substantial distribution cuts while ETE’s was preserved (see Energy Transfer: Cutting Your Payout, Not Mine). Management’s investment in Energy Transfer was overwhelmingly in the GP, ETE. We made our investment there to assure the best possible alignment of interests. Notwithstanding the legal case argued in Delaware Chancery by ETE in defense of its indefensible preferreds, many investors in the Energy Transfer family have endured payout cuts.
ET, the surviving entity having absorbed all its MLPs, cut its distribution in late 2020. Investor skepticism about the payout had driven the yield to 18%. Covid-led demand destruction, albeit brief, didn’t help. With no reward in the stock price for such largesse and facing rating agency pressure because of its 5X Debt:EBITDA leverage, the company decided it had better uses for available cash than paying ungrateful unitholders (see Why Energy Transfer Cut Their Distribution). This 50% cut meant long-time investors in Sunoco Logistics, Energy Transfer Partners and Regency Partners had endured cuts of 66%, 72% and 76% respectively since being combined with the parent.
Following last week’s distribution hike ET still trades at a meaningful discount to other large MLPs Enterprise Products Partners (EPD) and Magellan Midstream (MMP). We retain a full position for this reason, but always with a self-protective wariness. ET’s history does not induce the comfort of straight dealing that, say, Jim Teague of EPD provides to their investors.
In 2019 Blackstone acquired the 56% of Tallgrass Energy it didn’t already own via a transaction that paid a substantial premium for management’s units versus the lower one paid to everyone else (see Blackstone and Tallgrass Further Discredit the MLP Model). Perhaps ET’s $41BN market cap makes it too big for such a coup. But you know that if they could do it, they would.
ET’s diverse and well positioned midstream assets, which are largely supported with fee-based contracts offer attractive upside. Their Lake Charles LNG project will add exposure to growing global demand for US natural gas.
LNG import terminals allow for diverse sources. As Germany has learned, if your energy comes via a pipeline you’re locked into a long-term relationship with the supplier. European LNG demand is growing but Asia remains the biggest market. The Philippines expects to increase imports as their Malampaya gas field in the South China Sea winds down. The government just approved construction of a seventh import facility.
The slide in US natural gas prices is due to our mild winter. The Freeport LNG export unit is coming back on line, which will create some additional demand. Cheap US gas will stimulate additional demand for US exports, which will eventually support domestic prices. Curbing US households’ use of gas stoves never looked like a serious proposition, but in any event will not alter the growth in long-term demand.
We have three funds that seek to profit from this environment:

Important Disclosures
The information provided is for informational purposes only and investors should determine for themselves whether a particular service, security or product is suitable for their investment needs. The information contained herein is not complete, may not be current, is subject to change, and is subject to, and qualified in its entirety by, the more complete disclosures, risk factors and other terms that are contained in the disclosure, prospectus, and offering. Certain information herein has been obtained from third party sources and, although believed to be reliable, has not been independently verified and its accuracy or completeness cannot be guaranteed. No representation is made with respect to the accuracy, completeness or timeliness of this information. Nothing provided on this site constitutes tax advice. Individuals should seek the advice of their own tax advisor for specific information regarding tax consequences of investments. Investments in securities entail risk and are not suitable for all investors. This site is not a recommendation nor an offer to sell (or solicitation of an offer to buy) securities in the United States or in any other jurisdiction.
References to indexes and benchmarks are hypothetical illustrations of aggregate returns and do not reflect the performance of any actual investment. Investors cannot invest in an index and do not reflect the deduction of the advisor’s fees or other trading expenses. There can be no assurance that current investments will be profitable. Actual realized returns will depend on, among other factors, the value of assets and market conditions at the time of disposition, any related transaction costs, and the timing of the purchase. Indexes and benchmarks may not directly correlate or only partially relate to portfolios managed by SL Advisors as they have different underlying investments and may use different strategies or have different objectives than portfolios managed by SL Advisors (e.g. The Alerian index is a group MLP securities in the oil and gas industries. Portfolios may not include the same investments that are included in the Alerian Index. The S & P Index does not directly relate to investment strategies managed by SL Advisers.)
This site may contain forward-looking statements relating to the objectives, opportunities, and the future performance of the U.S. market generally. Forward-looking statements may be identified by the use of such words as; “believe,” “expect,” “anticipate,” “should,” “planned,” “estimated,” “potential” and other similar terms. Examples of forward-looking statements include, but are not limited to, estimates with respect to financial condition, results of operations, and success or lack of success of any particular investment strategy. All are subject to various factors, including, but not limited to general and local economic conditions, changing levels of competition within certain industries and markets, changes in interest rates, changes in legislation or regulation, and other economic, competitive, governmental, regulatory and technological factors affecting a portfolio’s operations that could cause actual results to differ materially from projected results. Such statements are forward-looking in nature and involves a number of known and unknown risks, uncertainties and other factors, and accordingly, actual results may differ materially from those reflected or contemplated in such forward-looking statements. Prospective investors are cautioned not to place undue reliance on any forward-looking statements or examples. None of SL Advisors LLC or any of its affiliates or principals nor any other individual or entity assumes any obligation to update any forward-looking statements as a result of new information, subsequent events or any other circumstances. All statements made herein speak only as of the date that they were made. r
Certain hyperlinks or referenced websites on the Site, if any, are for your convenience and forward you to third parties’ websites, which generally are recognized by their top level domain name. Any descriptions of, references to, or links to other products, publications or services does not constitute an endorsement, authorization, sponsorship by or affiliation with SL Advisors LLC with respect to any linked site or its sponsor, unless expressly stated by SL Advisors LLC. Any such information, products or sites have not necessarily been reviewed by SL Advisors LLC and are provided or maintained by third parties over whom SL Advisors LLC exercise no control. SL Advisors LLC expressly disclaim any responsibility for the content, the accuracy of the information, and/or quality of products or services provided by or advertised on these third-party sites.
All investment strategies have the potential for profit or loss. Different types of investments involve varying degrees of risk, and there can be no assurance that any specific investment will be suitable or profitable for a client’s investment portfolio.
Past performance of the American Energy Independence Index is not indicative of future returns.


I have a question and a comment.
My question is, since ET is an MLP why does the first chart, entitled “Back to the Future”, refer to “stock” and “dividends”?
My comment is that I don’t think that Kelcy Warren has a “deft touch”. Rather I would describe him as having a “Heavy hand”.
Elliot, you are correct that ET as an MLP has “units” oustanding and pays “distributions” rather than stock and dividends respectively. Many readers who don’t invest in MLPs find the terms confusing, so I used the more familiar terminology.